InorganicCompLab yd3717
EX3
BH3
General information
B3LYP / 6-31G(d, p) level

Item               Value     Threshold  Converged?
 Maximum Force            0.000014     0.000450     YES
 RMS     Force            0.000007     0.000300     YES
 Maximum Displacement     0.000053     0.001800     YES
 RMS     Displacement     0.000027     0.001200     YES
BH3 frequency file: File:YD3717 BH3 FREQ.LOG
Low frequencies ---   -7.5936   -1.5614   -0.0054    0.6514    6.9319    7.1055
Low frequencies --- 1162.9677 1213.1634 1213.1661
Optimized BH3 molecule |
Vibrational spectrum
| Wavenumber (cm-1) | Intensity (arbitrary units) | Symmetry | IR active? | Type |
| 1163 | 93 | A2 | yes | out-of-plane bend |
| 1213 | 14 | E | very slight | bend |
| 1213 | 14 | E | very slight | bend |
| 2582 | 0 | A1 | no | symmetric stretch |
| 2716 | 126 | E | yes | asymmetric stretch |
| 2716 | 126 | E | yes | asymmetric stretch |
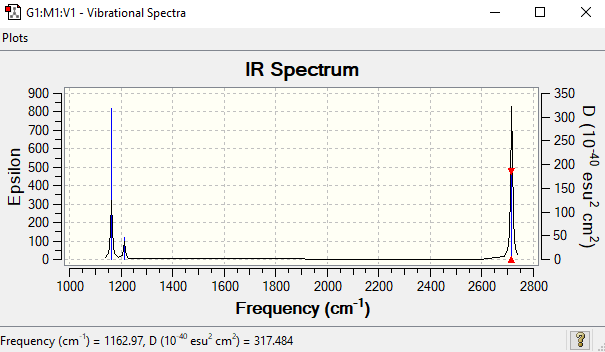
There are clearly 6 vibrations, but only 3 peaks are seen on the IR spectrum. First reason is that there are two sets of degenerate vibrations, at frequency = 1213 cm-1 and 2716 cm-1. Therefore these four vibrations will only show two different peaks on the spectrum. The vibration at frequency = 2582 cm-1 is a symmetric stretch, which has no change in dipole moment. So this vibration is IR inactive and will not show on the spectrum. The other peak shown on the spectrum corresponds to the vibration at 1163 cm-1.
MO diagram
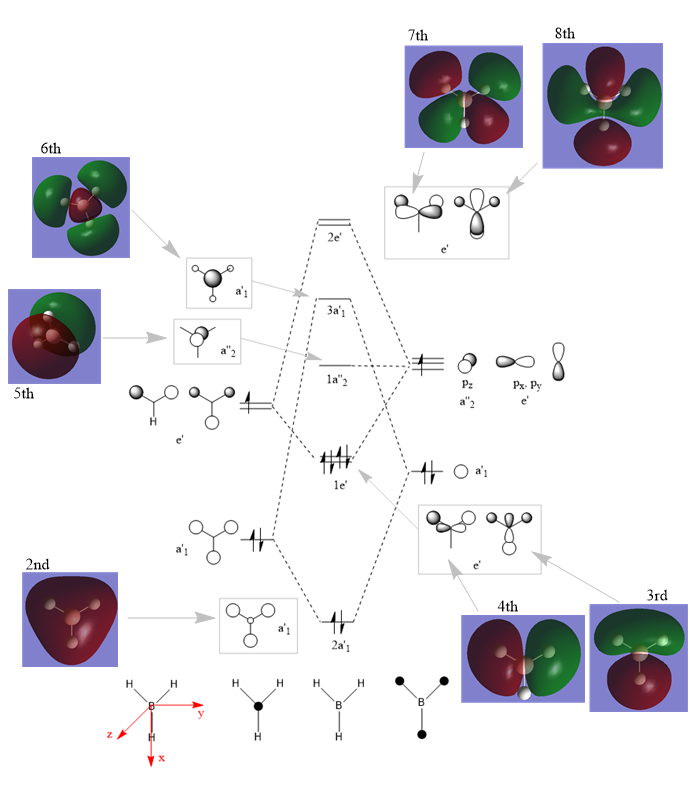
The predicted LCAO MOs look very similar to the real MOs. They have exactly the same distribution of phases and nodes. However there are slight differences in phase orientation. For example, the 7th LCAO MO are predicted to have p orbital horizontal. But the real MO shows the p orbital is push downwards a little bit. Similar for the 8th MO, the vertical p orbital is squeezed in between the other phases.
Therefore MO theory can predict most of the MOs correctly, with slight differences on phase orientations. However it is still very useful in learning orbital bondings as it predicts the MO phases and nodes correctly.
Ng611 (talk) 13:10, 17 May 2019 (BST) You're totally correct about qualitative MO theory being unable to predict the distortion of MOs off the atoms, well done. However, you should try to be more clear and succinct in your answer. There are also other minor differences that are important, can you spot them?
NH3
General information
B3LYP / 6-31G(d, p) level
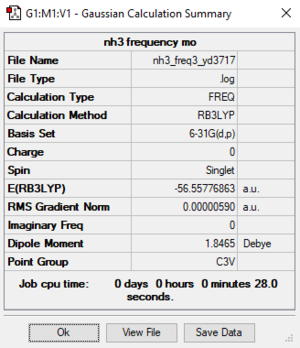
         Item               Value     Threshold  Converged?
 Maximum Force            0.000013     0.000450     YES
 RMS     Force            0.000006     0.000300     YES
 Maximum Displacement     0.000040     0.001800     YES
 RMS     Displacement     0.000013     0.001200     YES
NH3 frequency file: File:YD3717 NH3 FREQ.LOG
 Low frequencies ---   -8.5223   -8.4750   -0.0033    0.0335    0.1919   26.4067
 Low frequencies --- 1089.7616 1694.1862 1694.1866
Optimized NH3 molecule |
NH3BH3
General information
B3LYP / 6-31G(d, p) level
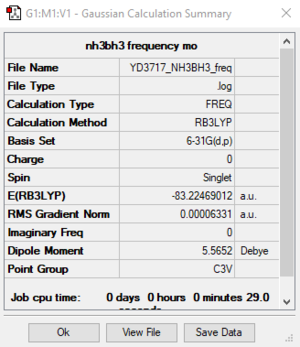
         Item               Value     Threshold  Converged?
 Maximum Force            0.000114     0.000450     YES
 RMS     Force            0.000063     0.000300     YES
 Maximum Displacement     0.000621     0.001800     YES
 RMS     Displacement     0.000355     0.001200     YES
NH3BH3 frequency file: File:YD3717 NH3BH3 FREQ.LOG
 Low frequencies ---   -0.0614   -0.0457   -0.0065   21.6818   21.6877   40.5522
 Low frequencies ---  266.0205  632.3610  640.1375
Optimized NH3BH3 molecule |
Energy calculation
E(NH3) = -56.55777 a.u.
E(BH3) = -26.61532 a.u.
E(NH3BH3) = -83.22469 a.u.
ΔE = E(NH3BH3)-[E(NH3)+E(BH3)]
= -0.0516 a.u.
= -135 kJ/mol
The normal B-N bond has a strength of 389 kJ/mol [1], while the dative B-N bond strength calculated above is 135 kJ/mol. A very strong bond like N-N triple bond has a energy of 946 kJ/mol [1]. Therefore in comparison, this B-N dative bond is only a weak bond.
Ng611 (talk) 13:14, 17 May 2019 (BST) Good calculation. I'd avoid using websites as literature sources if you can. Try to use a paper or text/databook if you can.
NI3
General information
B3LYP / 6-31G(d, p) LANL2DZ level
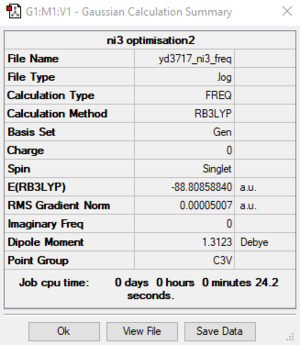
         Item               Value     Threshold  Converged?
 Maximum Force            0.000096     0.000450     YES
 RMS     Force            0.000050     0.000300     YES
 Maximum Displacement     0.001084     0.001800     YES
 RMS     Displacement     0.000616     0.001200     YES
NI3 frequency file: File:YD3717 NI3 FREQ.LOG
 Low frequencies ---  -12.7232  -12.7172   -6.4215   -0.0039    0.0189    0.0620
 Low frequencies ---  101.0767  101.0775  147.4581
Optimized NI3 molecule |
N-I distance
The optimised N-I distance is 2.184 Å.
Project: Lewis acids and bases
Five possible structures and symmetry
Determine the five possible isomers and identify the symmetry of each isomer of Al2Cl4Br2.
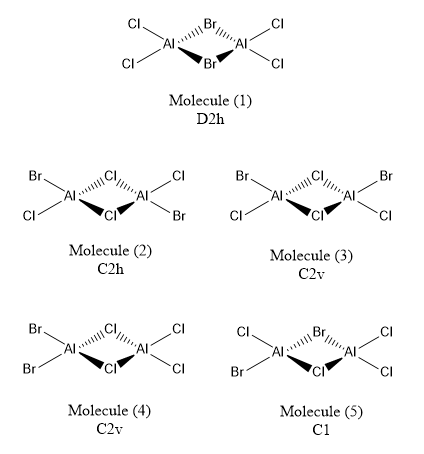
Two bridging Br ions (Molecule 1)
B3LYP / 6-31G(d, p) LANL2DZ level
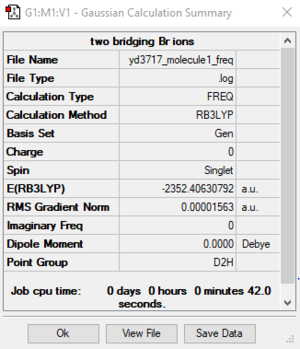
         Item               Value     Threshold  Converged?
 Maximum Force            0.000034     0.000450     YES
 RMS     Force            0.000016     0.000300     YES
 Maximum Displacement     0.000687     0.001800     YES
 RMS     Displacement     0.000394     0.001200     YES
Molecule 1 frequency file: File:YD3717 MOLECULE1 FREQ.LOG
 Low frequencies ---   -4.9368   -4.7940   -3.2374    0.0019    0.0028    0.0031
 Low frequencies ---   14.9456   63.3281   86.1024
Optimized molecule 1 |
Bridging Cl ions and trans terminal Br ions (Molecule 2)
B3LYP / 6-31G(d, p) LANL2DZ level
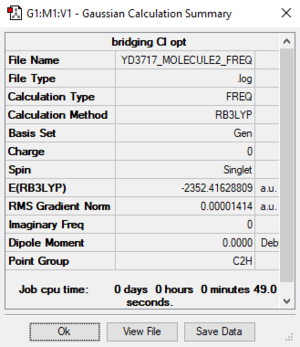
         Item               Value     Threshold  Converged?
 Maximum Force            0.000039     0.000450     YES
 RMS     Force            0.000014     0.000300     YES
 Maximum Displacement     0.001287     0.001800     YES
 RMS     Displacement     0.000438     0.001200     YES
Molecule 2 frequency file: File:YD3717 MOLECULE2 FREQ.LOG
 Low frequencies ---   -4.2020   -2.2652    0.0037    0.0041    0.0042    1.1849
 Low frequencies ---   17.7423   48.9741   72.9606
Optimized molecule 2 |
Energy and stability analysis
E (molecule 1) = -2352.40631 a.u. = -6175067 kJ/mol
E (molecule 2) = -2352.41629 a.u. = -6175093 kJ/mol
ΔE = E(molecule 1) - E(molecule 2)
= 0.00998 a.u.
= 26 kJ/mol
Molecule 1 with two Br ions bridging has higher energy than molecule 2 with two Cl ions bridging. The energy difference is about 26 kJ/mol.
This is because both Al and Cl are in row 3, while Br is in row 4. The 3p orbitals are similar in energy and sizes, therefore 3p-3p overlap of Al-Cl is better than the 3p-4p overlap of Al-Br.
Better overlap results in lower energy, which means molecule 2 with Cl bridging is more stable than molecule 1.
Ng611 (talk) 13:19, 17 May 2019 (BST) Good calculation and an interesting explanation, although I think it's more likely that steric interactions affect the stability more.
AlCl2Br
B3LYP / 6-31G(d, p) LANL2DZ level
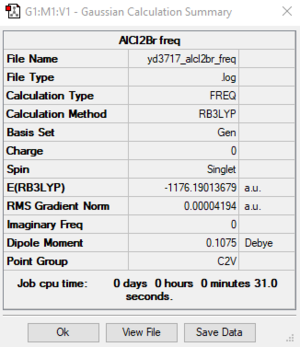
         Item               Value     Threshold  Converged?
 Maximum Force            0.000081     0.000450     YES
 RMS     Force            0.000042     0.000300     YES
 Maximum Displacement     0.001588     0.001800     YES
 RMS     Displacement     0.000974     0.001200     YES
AlCl2Br frequency file: File:YD3717 ALCL2BR FREQ.LOG
 Low frequencies ---    0.0045    0.0048    0.0053    1.3569    3.6367    4.2604
 Low frequencies ---  120.5042  133.9178  185.8950
Optimized AlCl2Br |
Dissociation energy analysis
E (molecule 2) = -2352.41629 a.u. = -6175093 kJ/mol
E (AlCl2Br) = -1176.19014 a.u. = -3087499 kJ/mol
ΔE = 2 * E(AlCl2Br) - E(molecule 2)
= 0.03601 a.u.
= 95 kJ/mol
The reaction of molecule 2 dissociate into 2AlCl2Br takes in energy, which means this is an endothermic reaction. The product, i.e. AlCl2Br, is higher in energy than the reactant molecule 2.
Therefore, AlCl2Br is less stable.
MO analysis of molecule 2
40th MO
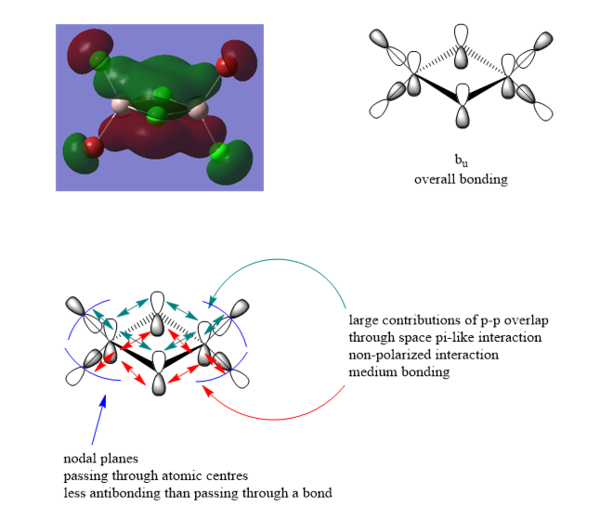
41st MO
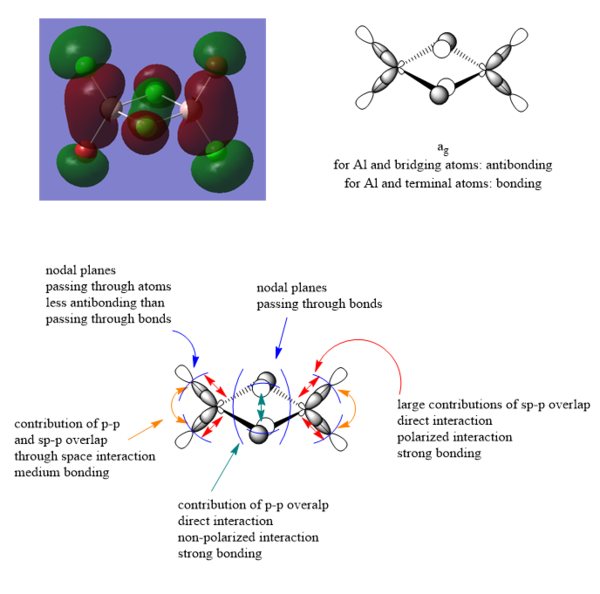
43rd MO
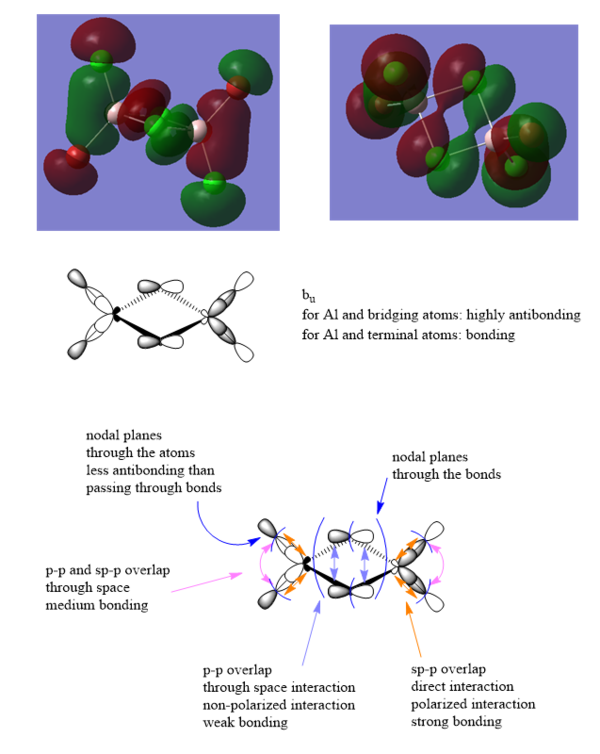
Ng611 (talk) 13:22, 17 May 2019 (BST) Great LCAO analysis and good description of the key interactions. Well done!
Reference
[1] Bond strength https://labs.chem.ucsb.edu/zakarian/armen/11---bonddissociationenergy.pdf
