
Inorganic:whoisthedaddy
Module 2: Inorganic
Optimising a molecule of BH3
A molecule of BH3 (diagram A) was optimised using Guassian with the method B3LYP and the basis set 3-21G, it's bond lengths and H-B-H bond angles are shown below. The gradient of the moelcule is 0.0002, therefore I know the calculation is complete

. When further investigating the optimized BH3 molecule two graphs can be obtained, these plot the energy and the gradient throughout the optimization, the gradient is the first derivative of the energy and show the rate at which the energy changed throughout the optimization. For the optimization to end the gradient must equal 0 as this is the minimum energy.
| Atoms | Bond Lengths (A) | Atoms | Bond Angles (°) | |
|---|---|---|---|---|
| 1-2 | 1.19 | 2-1-3 | 120 | |
| 1-3 | 1.19 | 3-1-4 | 120 | |
| 1-4 | 1.19 | 2-1-4 | 120 |
An optimization is the determination of the lowest energy form of a molecule and is completed by solving the Shrodinger equation for the the molecule with the atoms in position R and a slightly different R values and therefore finding the R values associated with the lowest energy.
In the early stages of an optimization Gaussian shows no bonds between the atoms in the molecule,

this is because the distance is greater the programs predefined value, however a bond is simply a favourable interaction between two atoms. For example, in a single covalent bond two atoms share two electrons in a favourable interaction. So the "bond" does occur between the two atoms but is just not shown by Gaussian.
| Atoms | Bond Lengths (Calc)(A) | Bond Lengths (Lit)(A) | Atoms | Bond Angles (Calc)(°) | Bond Angles (Lit) (°) | |
|---|---|---|---|---|---|---|
| 1-2 | 1.87 | 1.75 | 2-1-3 | 120 | 120 | |
| 1-3 | 1.87 | 1.75 | 3-1-4 | 120 | 120 | |
| 1-4 | 1.87 | 1.75 | 2-1-4 | 120 | 120 |
In order to achieve more accurate calculation larger and more complex basis sets (a group of functions used to create a molecular orbital) must be used aswell as pseudopotentials which simplify complex systems by stating that only valence electrons contribute to bonding interactions. An optimization was then run with a medium level basis set and pseudopotential on BCl3 (diagram B). The calculations took less than five minutes to run due to the simplicity of the molecule. The results are shown in the table to the right along with literature values, which as you can see are in agreement with eachother.
When optimising a structure to find its minimum energy, the first derivative of the energy is calculated and set to zero to complete the optimisation. However when the first derivative is equal to zero this is just a point on the energy profile where the change in energy is 0, therefore it could bea minimum, maximum or transition state. In order to differentiate between these possible states the second derivative must be taken, this is the frequency analysis. If the frequencies calculated are negative this is a maximum point in the curve, if they are positive it is a minimum. If one of the frequencies is negative then a transition state has been found. Frequency analysis can also be used to compared IR stretches with experimental values.
When carrying out the frequency analysis of BH3 the same method and basis set were used, this is because the calculation will run in a shorter time as the optimisation has allready been calculated. We can see that the optimisation was successful as none of the vibration frequencies are below zero. There are only three peaks on the IR spectra to the right despite the fact that there are 6 different vibrations. This is because there are 3 pairs of degenerate vibrations. These are shown in the table below along with symmetry point groups which were found in log file for the calculation.

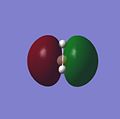
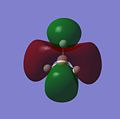
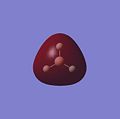
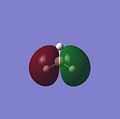
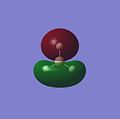
The Molecular Orbitals for BH3 were calculated using the same method and basis set. https://www.ch.ic.ac.uk/wiki/index.php/Image:BH3_MO.LOG. The thereoretical molecular orbital diagram is shown below with the calculated orbitals further down.

| Vibration | Freq (cm-1) | Intensity | Point Group |
|---|---|---|---|
 |
1144.2 | 92.9 | A"2 |
 |
1203.6 | 12.3 | E' |
 |
1203.6 | 12.3 | E' |
 |
2598.4 | 0 | A'1 |
 |
2737.4 | 103.7 | E' |
 |
2737.4 | 103.7 | E' |
When comparing the calculated and the LCAO model of the atomic orbitals they are in agreement. However the sizes and therefore contributions of the orbitals are slightly different. For example when looking at the 3a' orbital the LCAO model predicts small contributions by the bonding H orbitals, but when looking at the calculated 3a' orbital the contributions are simillar. This shows that the quantitive analysis can be somewhat misleading. However this was not the case when modelling the molecular orbitals of C=O further on in this investigation.
-
 1a"2
1a"2 -
 2e'
2e' -
2e'
-
 3a'
3a' -
 2a'1
2a'1 -
 1e'
1e' -
 1e'
1e'


Isomers of Mo(CO)4(X)2

The skills learnt in the above section will now be used to analyse the Cis (diagram C) and Trans (diagram D) isomers of Mo(CO)4L2, where L=PCl3. The molecules were optimised using Gaussian with the low level basis set LANL2MB, the optimised forms were then modfified and then optimised again with the more complex basis set LANL2-DZ to order to obtain a more accurate calculation. Then in order to obtain the most accurate calculation possible the fact that in the bonding for these complexes Phosphorus is hypervalent uses its low lying d orbitals was added into the calculation.
| Complex | Energy (kJ/mol) | |
|---|---|---|
| Mo(CO)(PCl3)2 | -1637509 | |
| Mo(CO)4(PPh3)2 | -5050256.46 |
| Complex | Energy (kJ/mol) | |
|---|---|---|
| Mo(CO)(PCl3)2 | -1637504 | |
| Mo(CO)4(PPh3)2 | -5050259.84 |
The energies of the two isomers are very simillar, however during the second year lab course it was found that with [Mo(CO)4(PPh3)2] the Trans isomer was more stable due to a lack of steric hindrance between the PPh3 groups. This is not the case for the [Mo(CO)4(Cl)2] isomers as the tables below show that the energy of the Trans isomer is actually greater than that of the Cis isomer (by 5 kJ/mol).This difference in stabilty between the two complexes is due to the fact that the Cl is smaller than the PPh3 group and therefore causes less steric hindrance in the Cis complex. I will now prove that this is the case by optimizing the two [Mo(CO)4(PPh3)2] complexes and analysing their energy. The results from the calculations for the PPh3 complexes are shown in the tables above. It is clear to see that the prediction was correct, that the trans isomer is more stable with bulkier groups due to steric reasons.
The IR frequencies were then computed for the two isomers and the main stretches are shown in the relevent tables along with literature1 values. http://hdl.handle.net/10042/to-2696 (Trans) http://hdl.handle.net/10042/to-2697 (Cis). I can conclude that the energy optimisation was did produce a minimum all the frequencies recieved are positive apart four of the lower vibrations.
| Frequency (cm-1) (Calc) | Intensity | Frequency (cm-1) (Lit) |
|---|---|---|
| 1938 | 1589.2 | 1896 |
| 1939 | 1586.3 | |
| 1967 | 3.7 | |
| 2024 | 5.1 |
| Frequency (cm-1) | Intensity | Frequency (cm-1) (Lit) |
|---|---|---|
| 1937 | 1584.4 | 1986 |
| 1934 | 831.3 | 1994 |
| 1951 | 609.9 | 2004 |
| 2018 | 561.6 | 2072 |
If a vibration has a low frequency it also has a low energy. (E = hv, E = Energ, h = Plancks Constant, v = Frequency). So if a vibration has a low energy then it will occur at room temperature. Both isomers have vibrations at low frequencies and are shown below.

The two high intensity vibrations for the Trans isomer can be considered the same. These vibrations are the two opposite CO groups, they have been measured as slightly different values due to the fact that the molecule is not completely symmetric. The very low intensity of the other two vibrations allows them to be discarded. Therefore the Trans isomer only gives one vibration which is in agreement with the literature.
This Cis isomer shows four different vibrations all with considerable intensities, this is expected as the lack of symmetry leads to a change in dipole moment during the vibrations, giving the absorptions.
Chemistry of Nitroglycerine
The skills learnt from the earlier parts of this investigation will now be used to explore the structure of nitroglycerine and explain why it is such an efficient explosive material. First a small amount of background knowledge about explosives must be introduced2.
An explosive material is a substance that when activated produces a sudden expansion of material which is usually accompanied by the production of heat and a large change in pressure. The reaction proceeds with the use of oxygen in the molecule and not in the air. Therefore an explosive material needs to contain oxygen and be able to degrade into smaller gaseous molecules, Nitroglycerine as shown in the diagram fufills both these criteria.
Trans |
C3H5(NO3)3 → 3CO + 2.5H2O + 1.5N2 + 1.75O2
Unlike many other explosives, the decomposition of nitroglycerin does not produce any solid forms of carbon such as smoke, this can be an advantage when being used in industry eg. mining.
When detonated Nitroglycerine degrades according to the equation above. The generation of these gases occupy 1200 times the orignal volume of the explosive in its liquid form at room temperature and pressure. This great increase in pressure is accompanied by an increase in temperature (PV = nRT) of approximately 5000°C. This is known as an explosion.
Nitroglycerine and its constituent molecules were optimised using Guassian in order to the analyse the thermodynamics of the reaction, these values are shown in the following table.
| Molecule | Energy (Hartrees) |
|---|---|
| C3H5(NO3)3 | 951.5 |
| 3CO2 | 1.23 |
| 2.5H2O | 0.54 |
| 1.5N2 | 0.53 |
| 1.75O2 | 0.33 |
| Constituent Molecules | 2.65 |
We can see that that the energy difference [E(products)-E(reactants)] between the original and constituent molecules is very large, this shows that the reaction is very exothermic (-2491241.9 kJ/mol).
An effective explosive material must have a large difference in energy between its products and reactants. Otherwise the reaction would occur without an explosion. Therefore it has been shown that Nitroglycerine satifies this first criterion.
The next question is then "How does Nitroglycerine create such a large explosion?"
This can be answered by looking at the bonds that are formed during the decomposition reaction. The relatively weak bonds in Nitroglycerine are broken and bonds such as N2 and CO are formed. These bonds are very strong and therefore release a large amount of energy when broken. This stability can be rationalised by viewing the molecular orbitals of the N2 http://hdl.handle.net/10042/to-2792 and CO, which are shown below. The reason for the high strength of these bonds are the fact that both atoms are of very similar size and therefore have simillar size orbitals giving a greater overlap and therefore more stabillised bonding orbitals.
-
 Orbital 1
 -
 Orbital 2
 -
 Orbital 3
 -
 Orbital 4
 -
 Orbital 5
 -
 Orbital 6
 -
 Orbital 7 (HOMO)


Another reason for the destructive properties of this material is entropy. As we can see from the reaction scheme; 7.25 moles of gas are produced from one mole of liquid, this rapid increase in pressure and temperature is also responsible for the explosion.
Therefore I can conclude that Nitroglycerin is a very efficient and powerful explosive.
Carbonyl IR stretches in Cr Complexes


An investigation was performed in order to rationalise the variation of Carbonyl stretching frequencies in Cr(X)6 complexes using computational methods.
The main interest of the investigation is a concept named "backbonding", this is the donation of electrons from the central atom of a complex into the π* orbital of a ligand. It is generally thought that as the amount of backbonding present in a complex increases then the bond order and the IR stretch frequency of the C=O bond decrease3. However there is also another mechanism involved with an increase in electron density on the Cr atom. When this increase in electron density on the metal atom occurs occurs, it decreases the extent to which the Cr atom accepts σ donation from the C=O ligand. This also leads to a weakening of the C=O bond and therefore a decrease in the IR frequency.
Primarily two different Cr complexes were optimised using Guassian with method B3LYP and the basis set 3-21G(http://hdl.handle.net/10042/to-2793). They were then subjected to frequency analysis, these two molecules are shown in the labelled diagrams.
The Carbonyl stretches for these molecules are shown in the following tables.
| Frequency (cm-1) (Calc) | Intensity | |
|---|---|---|
| 2010.85 | 2032 | |
| 2010.85 | 2032 | |
| 2101.89 | 482.9 |
| Frequency (cm-1) | Intensity | |
|---|---|---|
| 1447.89 | 239 | |
| 1846 | 206 |
As expected the Cl substituted complex has considerably lower IR stretches. This is due to the donation of π electrons from the Cl atoms onto the Cr atom. This increases the п electron density on the Cr atom and therefore increases the amount of backbonding present and therefore decreasing the C=O bond order and IR stretch frequency. This is shown in the following diagram.


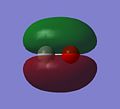
This molecular orbital diagram of C=O clearly shows the antibonding character of the LUMO 2π orbital, it also shows the fact that the orbital is relatively low in energy and can easily accept electron density from the central Cr atom. Also the fact that both of the lowest lying antibonding orbitals 5σ* and 2π* have more antibonding character on the carbon atom shows that this will be the atom accepting the electron density. The corresponding orbitals are shown below. When comparing the orbitals calculated by Gaussian and the orbitals shown in the diagram do correlate with eachother. This was not the case for the BH3 orbitals modelled in the earlier part of this invetigation.
-
 4σ
4σ -
 1π
1π -
 1π
1π -
 5σ*(HOMO)
 -
 2π*(LUMO)


In order to further this investigation, the carbonyl vibrations will now be computed for a Cr complex with electron withdrawing groups attached. The decrease in backbonding will lead to an increase in bond order of the C=O bond and IR stetching frequency.
| Frequency (cm-1) (Calc) | Intensity | |
|---|---|---|
| 1881.9 | 2035 | |
| 1957.9 | 21.3 |
The C=O streches for the compound shown on the right are greater than the those for the Cr(CO)2(Cl)4 molecule for the reasons explained above.

So far in this investigation only the ligand Cis to a CO group have varied, now a ligand Trans to a CO group will be analysed the the results are shown in the table below.
| Frequency (cm-1) (Calc) | Intensity | |
|---|---|---|
| 1384.11 | 502.8 | |
| 2018.95 | 512.2 |
References
1. F.A.Cotton, Vibrational Spectra and Bonding in Metal Carbonyls, Vol, 3, 1964, 709.
2. P. Persson, R. Holbern, J. Lee, Rock Blasting and Explosive Engineering, 1994, 63.
3. R. P. Houghton, Metal Complexes in Organic Chemistry, 1979, 21.