Inorganic:sherryqw1998
BH3 molecule
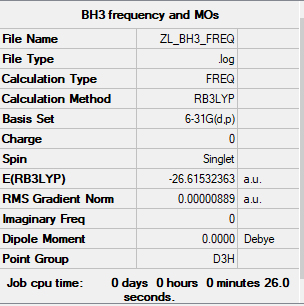
The method and basis set: B3LYP/6-31G level
Summary table:
Item table:
 Item                     Value        Threshold  Converged?
 Maximum Force            0.000018     0.000450     YES
 RMS     Force            0.000009     0.000300     YES
 Maximum Displacement     0.000070     0.001800     YES
 RMS     Displacement     0.000035     0.001200     YES
Frequency analysis log file:
Low frequencies table:
 Low frequencies ---  -10.3498   -3.4492   -1.2454   -0.0056    0.4779    3.2165
 Low frequencies --- 1162.9519 1213.1527 1213.1554
Jmol image of BH3:
optimised BH3 |
Information about BH3 vibrations:
| Mode | wavenumber(cm-1) | Intensity | Symmetry | Dipole moment(Deby) | IR active? | Types of vibrations |
|---|---|---|---|---|---|---|
| 1 | 1163 | 317 | A2 | 92.55 | yes | out-of-plane bend |
| 2 | 1213 | 46 | E' | 14.05 | yes | bend |
| 3 | 1213 | 46 | E' | 14.06 | yes | bend |
| 4 | 2582 | 0 | A1' | 0.00 | no | symmetric stretch |
| 5 | 2716 | 186 | E' | 126.32 | yes | asymmetric stretch |
| 6 | 2716 | 186 | E' | 126.32 | yes | symmetric stretch |
BH3 IR spectrum:
Explanation of IR spectrum:
There are overall 6 vibration modes of BH3, but only 4 peaks can be seen on the IR. Mode 2 and 3 have the same wavenumbers and intensities, so there is only one peak shown on the IR because these two peaks overlap. So as mode 5 and 6. Mode 4 does not have the change in dipole, so it is IR inactive, no peak can be seen on the IR.
You have the correct reasons but have made a slight error in the opening line where I think you mean that only 3 peaks can be seen on the IR. Your calculated structure is good but I think you've got the dipole moment and the IR intensities the wrong way round in your table. Smf115 (talk) 09:21, 30 May 2019 (BST)
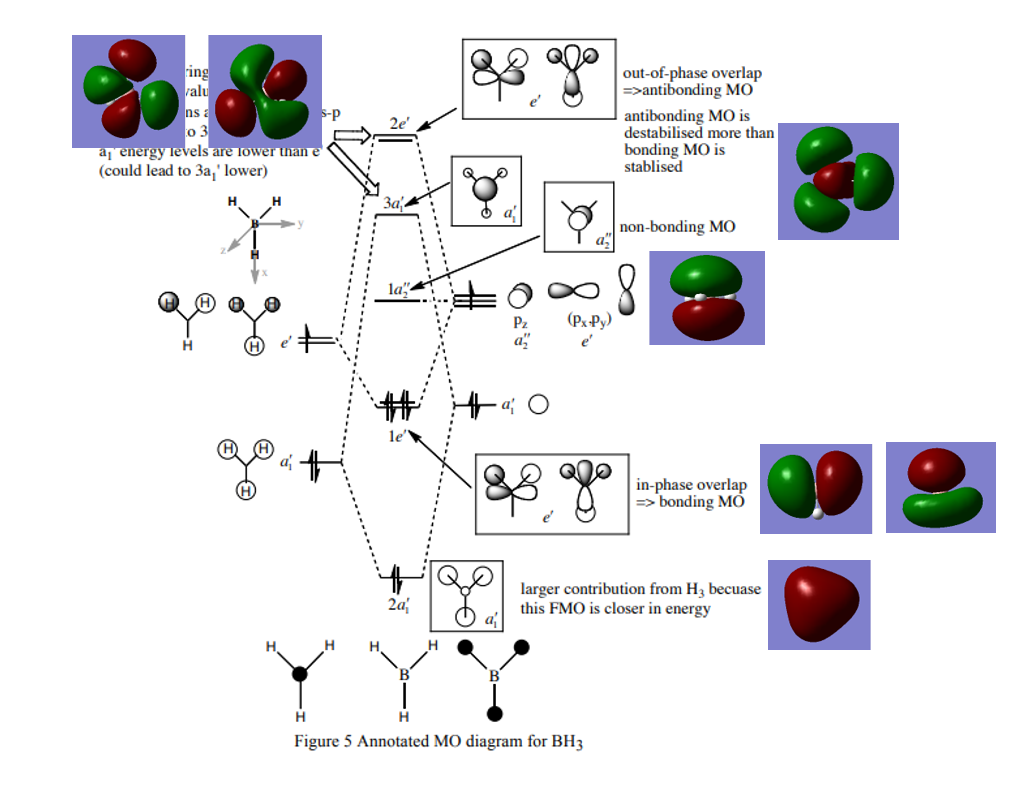
The MO diagram of BH3:
- ↑ This is HuntResearchGroup reference.
Questions:
1.Are there any significant differences between the real and LCAO MOs?
The LCAO MOs only show the individual AO components which can be used for predictions theoretically. However the real model gives the exact size of AOs for different elements and how the mix looks like in reality.
2.What does this say about the accuracy and usefulness of qualitative MO theory?
Compared to the real situation and LCAO MOs, the LCAO MOs theory correspond to the real, which is useful for the predictions.
NH3 molecule
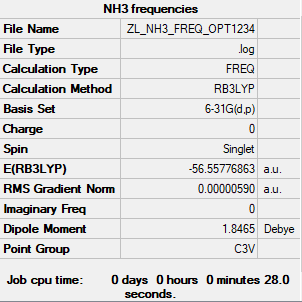
The method and basis set: B3LYP/6-31G level
Summary table:
Item table:
 Item                     Value        Threshold  Converged?
 Maximum Force            0.000013     0.000450     YES
 RMS     Force            0.000006     0.000300     YES
 Maximum Displacement     0.000040     0.001800     YES
 RMS     Displacement     0.000013     0.001200     YES
Frequency analysis log file:
Low frequencies table:
Low frequencies ---   -8.5223   -8.4750   -0.0029    0.0335    0.1918   26.4067
Low frequencies --- 1089.7616 1694.1862 1694.1866
Jmol image of NH3:
optimised NH3 |
NH3BH3 molecule
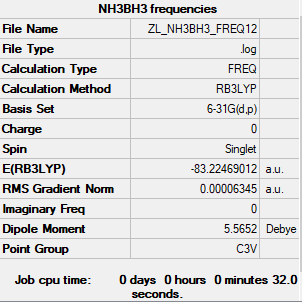
The method and basis set: B3LYP/6-31G level
Summary table:
Item table:
 Item                     Value        Threshold  Converged?
 Maximum Force            0.000113     0.000450     YES
 RMS     Force            0.000063     0.000300     YES
 Maximum Displacement     0.000615     0.001800     YES
 RMS     Displacement     0.000354     0.001200     YES
Frequency analysis log file: Media:ZL NH3BH3 FREQ1256.LOG
Low frequencies table:
Low frequencies ---   -0.0614   -0.0456   -0.0065   21.6960   21.7019   40.6115
Low frequencies ---  266.0407  632.3710  640.1446
Jmol image of NH3BH3:
optimised NH3BH3 |
Association energies: Ammonia-Borane
The energy of the dissociated fragments:
E(NH3)=-56.55777 a.u.
E(BH3)=-26.61532 a.u.
E(NH3BH3)=-83.22469 a.u.
The association energy:
ΔE=E(NH3BH3)-[E(NH3)+E(BH3)]= -83.22469 a.u. + 26.61532 a.u. + 56.55777 a.u. = --0.05160 a.u. = -135 kJ/mol
Question:
Based on your energy calculation is the B-N dative bond weak, medium or strong? What comparison have you made to come to this conclusion?
Compared to the bond strength of C-C bond, which is 346 kJ/mol, the bond strength of B-N bond is much smaller than that of C-C bond. It means that the B-N dative bond is weak.
Correct calculation and good consideration of the accuracy of your final energy value. Your comparison is ok but could be improved by considering other bonds or why the C-C bond is a good comparison. You should also always reference literature values! Smf115 (talk) 09:33, 30 May 2019 (BST)
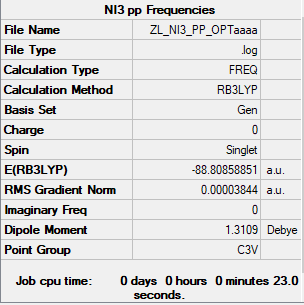
Heavy molecule: NI3
The method and basis set: B3LYP/6-31G(d,p)LANL2DZ
Summary table:
Item table:
 Item                     Value        Threshold  Converged?
 Maximum Force            0.000064     0.000450     YES
 RMS     Force            0.000038     0.000300     YES
 Maximum Displacement     0.000488     0.001800     YES
 RMS     Displacement     0.000278     0.001200     YES
Frequency analysis log file:
Low frequencies table:
Low frequencies ---  -12.7380  -12.7319   -6.2907   -0.0039    0.0188    0.0633
Low frequencies ---  101.0326  101.0333  147.4124
Jmol image of NI3:
optimised NI3 |
Optimised N-I distance: 2.18362A
Mini project--Ionic Liquids: Designer Solvents
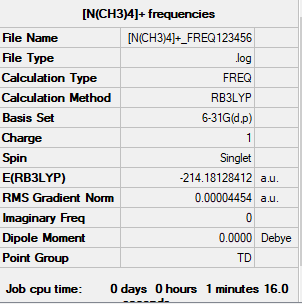
[N(CH3)4]+ molecule
The method and basis set:B3LYP/6-31G level
Summary table:
Item table:
 Item                     Value        Threshold  Converged?
 Maximum Force            0.000062     0.000450     YES
 RMS     Force            0.000045     0.000300     YES
 Maximum Displacement     0.000124     0.001800     YES
 RMS     Displacement     0.000085     0.001200     YES
Frequency analysis log file:
Media:-N(CH3)4-+ FREQ123456.LOG
Low frequencies table:
Low frequencies ---   -0.0003    0.0005    0.0011   22.7128   22.7128   22.7128
Low frequencies ---  190.7454  294.0627  294.0627
Jmol image of [N(CH3)4]+:
optimised [N(CH3)4]+ |
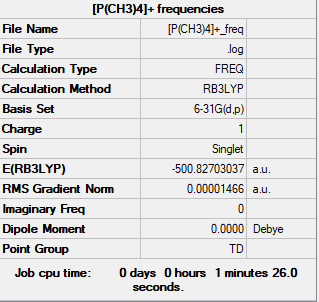
[P(CH3)4]+ molecule
The method and basis set:B3LYP/6-31G level
Summary table:
Item table:
 Item                     Value       Threshold  Converged?
 Maximum Force            0.000020     0.000450     YES
 RMS     Force            0.000015     0.000300     YES
 Maximum Displacement     0.000069     0.001800     YES
 RMS     Displacement     0.000057     0.001200     YES
Frequency analysis log file:
Low frequencies table:
Low frequencies ---   -0.0025   -0.0022   -0.0021   25.3058   25.3058   25.3058
Low frequencies ---  161.2513  195.7468  195.7468
Jmol image of [P(CH3)4]+:
optimised [P(CH3)4]+ |
Compare charge distribution of [P(CH3)4]+ and N(CH3)4+
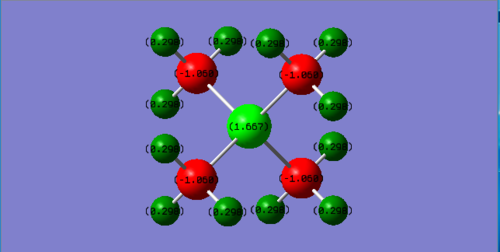
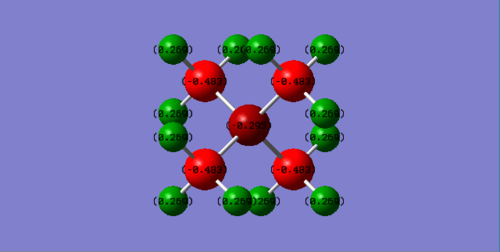
Charge distribution:
P(CH3)4+ P:1.667 C:-1.060 H:0.298

N(CH3)4+ N:-0.295 C:-0.483 H:0.269
Explanation:
Based on the electronegativity of the central atom in these two ionic molecules, N is more electronegative than P so that as seen in the charge distribution, P is positive value and N is negative value.In traditional description, the "+1" formal charge is always located in the centre atom in both molecule. However, this is not working for N(CH3)4+. Due to the highly electronegativity of N compared to C and H, the positive charge is actually located in H atom. For P(CH3)4+, the positive charge is evenly distributed on P and H.
Correct NBO charges calculated, the charge range is the same across the ILs which is good but you should have selected a larger range to show the actual distribution (note that the C's are the same colours in both despite having very different charges). In terms of the analysis, you haven't really justified or compared the distributions apart from a brief statement, the positive charge is also not evenly distributed on the P and H's (very different charges!). To improve, you also needed to explain why the N has a +1 formal charge in the traditional picture.Smf115 (talk) 17:12, 30 May 2019 (BST)
A LCAO MO diagram for three MOs in N(CH3)4+
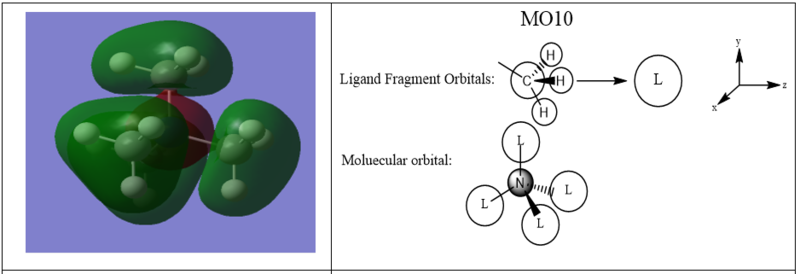

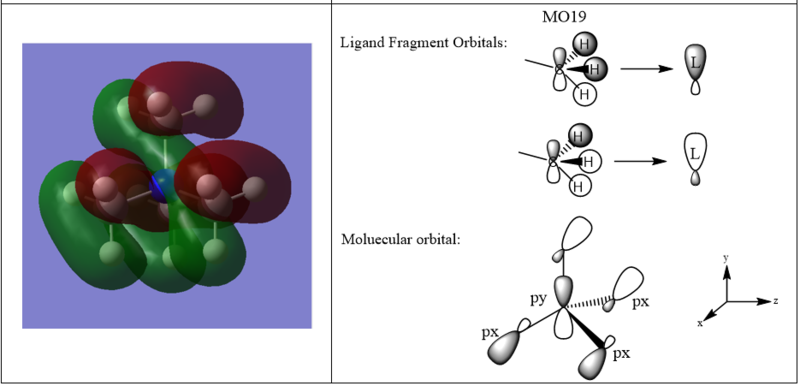
Good assignment of the FOs across a nice range of MOs. For MO 16 the labelling as px/y isn't correct as they aren't p-orbitals and the alignment isn't strictly x/y. It would have been good to see some of the main interactions highlighted and used to evaluate the overall character of the MOs. Smf115 (talk) 17:18, 30 May 2019 (BST)
Overall, a decent report with good structure calculations throughout. Smf115 (talk) 17:18, 30 May 2019 (BST)

