Inorganic:rf116
BH3
Optimisation Using 3-21G Basis Set
The .log file for the optimisation of BH3 can be found here. The basis set used is B3LYP/3-21G.
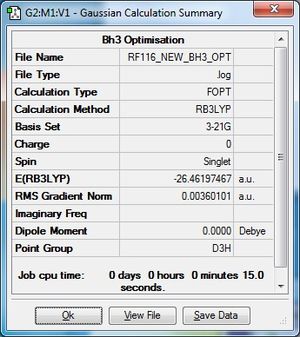
Item Table
       Item               Value     Threshold  Converged?
Maximum Force            0.000090     0.000450     YES
RMS     Force            0.000059     0.000300     YES
Maximum Displacement     0.000350     0.001800     YES
RMS     Displacement     0.000229     0.001200     YES
Predicted change in Energy=-4.546985D-08
Optimization completed.
   -- Stationary point found.
                          ----------------------------
                          !   Optimized Parameters   !
                          ! (Angstroms and Degrees)  !
--------------------------                            --------------------------
! Name  Definition              Value          Derivative Info.                !
--------------------------------------------------------------------------------
! R1    R(1,2)                  1.1945         -DE/DX =   -0.0001              !
! R2    R(1,3)                  1.1945         -DE/DX =   -0.0001              !
! R3    R(1,4)                  1.1945         -DE/DX =   -0.0001              !
! A1    A(2,1,3)              120.0            -DE/DX =    0.0                 !
! A2    A(2,1,4)              120.0            -DE/DX =    0.0                 !
! A3    A(3,1,4)              120.0            -DE/DX =    0.0                 !
! D1    D(2,1,4,3)            180.0            -DE/DX =    0.0                 !
--------------------------------------------------------------------------------
Optimisation Using 6-31G(d,p) Basis Set
The .log file for the optimisation of BH3 can be found here. The basis set used is B3LYP/6-31G(d,p).
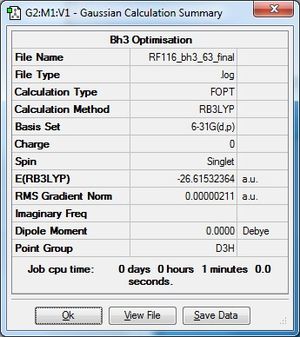
Item Table
       Item               Value     Threshold  Converged?
Maximum Force            0.000004     0.000450     YES
RMS     Force            0.000003     0.000300     YES
Maximum Displacement     0.000017     0.001800     YES
RMS     Displacement     0.000011     0.001200     YES
Predicted change in Energy=-1.021830D-10
Optimization completed.
   -- Stationary point found.
                          ----------------------------
                          !   Optimized Parameters   !
                          ! (Angstroms and Degrees)  !
--------------------------                            --------------------------
! Name  Definition              Value          Derivative Info.                !
--------------------------------------------------------------------------------
! R1    R(1,2)                  1.1923         -DE/DX =    0.0                 !
! R2    R(1,3)                  1.1923         -DE/DX =    0.0                 !
! R3    R(1,4)                  1.1923         -DE/DX =    0.0                 !
! A1    A(2,1,3)              120.0            -DE/DX =    0.0                 !
! A2    A(2,1,4)              120.0            -DE/DX =    0.0                 !
! A3    A(3,1,4)              120.0            -DE/DX =    0.0                 !
! D1    D(2,1,4,3)            180.0            -DE/DX =    0.0                 !
-------------------------------------------------------------
Frequency Analysis
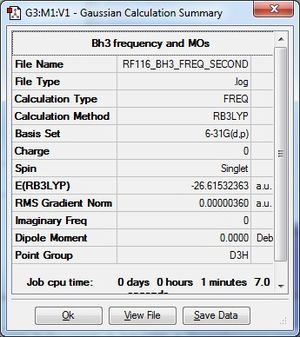
The .log file for the frequency analysis of BH3 using the B3LYP/6-31G(d,p) basis set can be found here.
Borane |
Frequencies
Low frequencies ---   -1.1800   -1.0028   -0.0054    4.1927   11.0182   11.0637
Low frequencies --- 1162.9912 1213.1792 1213.1819
Diagonal vibrational polarizability:
       0.7181028       0.7180026       1.8414118
Harmonic frequencies (cm**-1), IR intensities (KM/Mole), Raman scattering
activities (A**4/AMU), depolarization ratios for plane and unpolarized
incident light, reduced masses (AMU), force constants (mDyne/A),
and normal coordinates:
                     1                      2                      3
                    A2"                    E'                     E'
Frequencies --   1162.9912              1213.1792              1213.1819
Red. masses --      1.2531                 1.1072                 1.1072
Frc consts  --      0.9986                 0.9601                 0.9601
IR Inten    --     92.5488                14.0549                14.0585
 Atom  AN      X      Y      Z        X      Y      Z        X      Y      Z
    1   5     0.00   0.00   0.16     0.00   0.10   0.00    -0.10   0.00   0.00
    2   1     0.00   0.00  -0.57     0.00   0.08   0.00     0.81   0.00   0.00
    3   1     0.00   0.00  -0.57    -0.39  -0.59   0.00     0.14   0.39   0.00
    4   1     0.00   0.00  -0.57     0.39  -0.59   0.00     0.14  -0.39   0.00
Table of Vibrational Frequencies
| Mode | Frequency /cm-1 | Intensity | IR active? | Symmetry | Type of vibration |
| 1 | 1163 | 93 | Yes | A2" | Bend |
| 2 | 1213 | 14 | Yes | E' | Bend |
| 3 | 1213 | 14 | Yes | E' | Bend |
| 4 | 2582 | 0 | No | A1' | Symmetric Stretch |
| 5 | 2715 | 126 | Yes | E' | Asymmetric Stretch |
| 6 | 2715 | 126 | Yes | E' | Asymmetric Stretch |
IR Spectrum
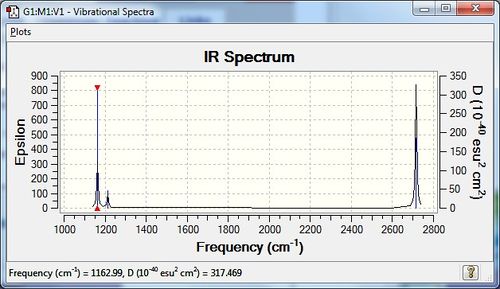
Bond frequency modes 1-3 are bond angle deformations, and modes 4-6 are bond stretches. Modes 2 and 3 are degenerate at 1213 cm-1, as are modes 5 and 6 at 2715 cm-1. There are 5 IR active vibrations - modes 1,2,3,5 and 6 are all IR active as there is a change in dipole moment, but mode 4, a symmetric stretch, is IR inactive as there is no change in dipole moment as all bond lengths move in unison. The IR spectrum only shows 3 different peaks, this is as there are two doubly degenerate modes, where the signals overlap, and one mode is not IR active, giving only 3 peaks.
BH3 Molecular Orbitals
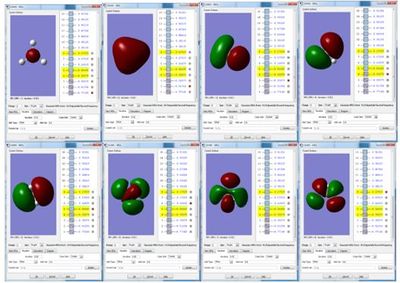
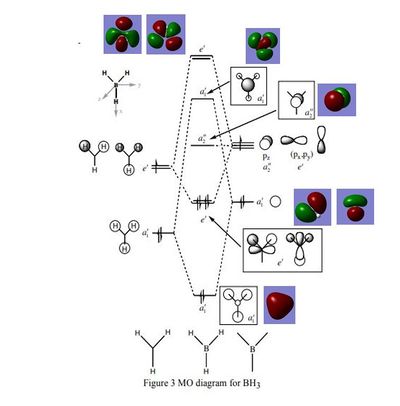
The molecular orbital diagram for the trigonal planar D3h BH3 molecule, shows the LCAO's next to the 'real' MOs obtained via frequency and optimisation of the molecule. The LCAO MO's look very similar to the real MOs, and there are no major differences. This indicates that qualitative MO theory is an accurate and useful way of predicting the shape of the molecular orbitals.
Smf115 (talk) 16:48, 28 May 2018 (BST)Clear inclusion of the MOs in the diagram and the useful nature of qualitative MO theory is highlighted. To improve, the differences in some of the contributions between the calculated and qualitative MOs, such as the B and H contributions in the 3a1' anti-bonding orbital, could have been mentioned.
NH3 and NH3BH3
NH3
Optimisation
The .log file for the optimisation of NH3 can be found here. The basis set used is B3LYP/6-31G(d,p).
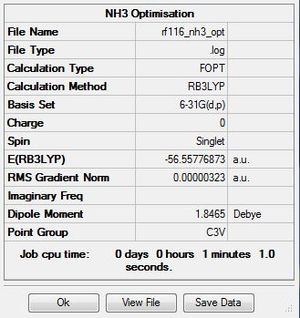
Item Table
        Item               Value     Threshold  Converged?
Maximum Force            0.000006     0.000450     YES
RMS     Force            0.000004     0.000300     YES
Maximum Displacement     0.000012     0.001800     YES
RMS     Displacement     0.000008     0.001200     YES
Predicted change in Energy=-9.844600D-11
Optimization completed.
   -- Stationary point found.
                          ----------------------------
                          !   Optimized Parameters   !
                          ! (Angstroms and Degrees)  !
--------------------------                            --------------------------
! Name  Definition              Value          Derivative Info.                !
--------------------------------------------------------------------------------
! R1    R(1,2)                  1.018          -DE/DX =    0.0                 !
! R2    R(1,3)                  1.018          -DE/DX =    0.0                 !
! R3    R(1,4)                  1.018          -DE/DX =    0.0                 !
! A1    A(2,1,3)              105.7446         -DE/DX =    0.0                 !
! A2    A(2,1,4)              105.7446         -DE/DX =    0.0                 !
! A3    A(3,1,4)              105.7446         -DE/DX =    0.0                 !
! D1    D(2,1,4,3)           -111.8637         -DE/DX =    0.0                 !
-------------------------------------------------------------
Frequency Analysis
The .log file for the NH3 frequency analysis can be found here. The basis set used is B3LYP/6-31G(d,p).
Ammonia |
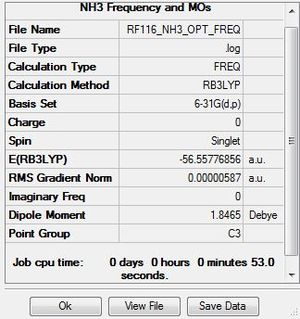
Frequencies
Low frequencies ---   -8.5646   -8.5588   -0.0047    0.0454    0.1784   26.4183
Low frequencies --- 1089.7603 1694.1865 1694.1865
Table of Vibrational Frequencies
| Mode | Frequency / cm-1 | Intensity | IR active? | Symmetry | Type of vibration |
| 1 | 1090 | 145 | Yes | A | Bend |
| 2 | 1694 | 14 | Yes | E | Bend |
| 3 | 1694 | 14 | Yes | E | Bend |
| 4 | 3461 | 1 | Very slightly | A | Symmetric Stretch |
| 5 | 3589 | 0.3 | No | E | Asymmetric Stretch |
| 6 | 3589 | 0.3 | No | E | Asymmetric Stretch |
IR Spectrum

The IR spectrum below shows two main peaks - corresponding to modes 1, 2 and 3. Modes 2 and 3 are degenerate and hence overlap. Mode 4 is only very slightly IR active, and does not have a very high intensity peak. Modes 5 and 6 are IR inactive, and hence this is why only 2 large peaks and one smaller peak can be observed.
NH3BH3
Optimisation
The .log file for the optimisation of the NH3BH3 molecule can be found here. The basis set used is B3LYP/6-31G(d,p).

Item Table
        Item               Value     Threshold  Converged?
Maximum Force            0.000123     0.000450     YES
RMS     Force            0.000058     0.000300     YES
Maximum Displacement     0.000515     0.001800     YES
RMS     Displacement     0.000296     0.001200     YES
Predicted change in Energy=-1.635696D-07
Optimization completed.
   -- Stationary point found.
Frequency Analysis
The .log file for the frequency analysis of NH3BH3 can be found here. The basis set used is B3LYP/6-31G(d,p).
Ammonia-Borane |
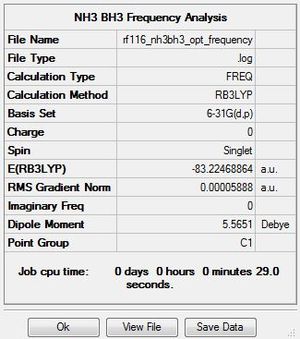
Frequencies
Low frequencies ---   -4.5368   -0.0008   -0.0004    0.0004   20.0857   42.9675
Low frequencies ---  266.7463  632.1363  638.9809
Table of Vibrational Frequencies
| Mode | Frequency / cm-1 | Intensity | IR active? | Symmetry | Type of vibration |
| 1 | 267 | 0 | No | A | Bend |
| 2 | 632 | 14 | Yes | A | Symmetric Stretch |
| 3 | 639 | 4 | Yes | A | Bend |
| 4 | 640 | 4 | Yes | A | Bend |
| 5 | 1069 | 40 | Yes | A | Bend |
| 6 | 1069 | 41 | Yes | A | Bend |
| 7 | 1196 | 109 | Yes | A | Bend |
| 8 | 1204 | 4 | Yes | A | Bend |
| 9 | 1204 | 4 | Yes | A | Bend |
| 10 | 1329 | 114 | Yes | A | Bend |
| 11 | 1676 | 28 | Yes | A | Bend |
| 12 | 1677 | 28 | Yes | A | Bend |
| 13 | 2470 | 67 | Yes | A | Symmetric Stretch |
| 14 | 2530 | 231 | Yes | A | Asymmetric Stretch |
| 15 | 2530 | 231 | Yes | A | Asymmetric Stretch |
| 16 | 3462 | 3 | Yes | A | Symmetric Stretch |
| 17 | 3579 | 28 | Yes | E | Asymmetric Stretch |
| 18 | 3579 | 28 | Yes | E | Asymmetric Stretch |
IR Spectrum

Association Energies
| Energy | Energy Value / au | Energy Value / kJmol-1 |
| E(NH3) | -56.55777 (5 d.p) | -148492.4251 |
| E(BH3) | -26.61532 (5 d.p) | -69878.52266 |
| E(NH3BH3) | -83.22469 (5 d.p) | -218506.4236 |
In auː ΔE = E(NH3BH3)-[E(NH3)+E(BH3)] = [(-83.22469) - (-56.55777 - 26.61532)] au = -0.0516 au (5. d.p)
In kJmol-1ː ΔE = E(NH3BH3)-[E(NH3)+E(BH3)] = [(-218506.4236) - (-148492.4251 - 69878.52266)] kJmol-1 = -135.5 kJmol-1.
The value of the B-N dative bond was calculated to be -135.5 kJmol-1, which is reasonably within the range that would be expected for a bond energy. When this energy is compared to the bond dissociation energy of B-B at 293 kJmol-1 and N-N at 167 kJ-1[2], it becomes apparent that the B-N bond is considerably weaker than the B-B bond, and slightly weaker than the N-N bond. Due to the difference in electronegativity of boron and nitrogen, with nitrogen being more electronegative, the B-N bond is polar (whereas both B-B and N-N bonds are not) and most of the electron density is centred around the nitrogen atom. This results in a weaker bond in comparison to the non-dative B-B and N-N bonds, and hence the B-N bond is concluded to be relatively weak.
Smf115 (talk) 16:49, 28 May 2018 (BST)Correct calculation and excellent explaination and comparison to evaluate the relative bond strength. Consider the accuracy of the reported, final energy values (both for kJ/mol and a.u.) to improve.
Optional - Ethane Comparison
Optimisation of Ethane
The .log file for the optimisation of ethane can be found here. The basis set used is B3LYP/6-31G(d,p).

Item Table
       Item               Value     Threshold  Converged?
Maximum Force            0.000198     0.000450     YES
RMS     Force            0.000038     0.000300     YES
Maximum Displacement     0.000390     0.001800     YES
RMS     Displacement     0.000117     0.001200     YES
Predicted change in Energy=-8.261579D-08
Optimization completed.
   -- Stationary point found.
Frequency Analysis of Ethane
The .log file for the frequency analysis of ethane can be found here. The basis set used is B3LYP/6-31G(d,p).

Frequencies
Low frequencies ---  -26.7609  -12.9742   -0.0007   -0.0005   -0.0001   24.3645
Low frequencies ---  313.8511  827.5327  828.3270
Charge Comparison between Ethane and NH3BH3

Ethane Charge Analysis
| Atom | Charge |
| C | -0.687 |
| H | +0.229 |
Ammonia-Borane Charge Analysis
| Atom | Charge |
| B | -0.170 |
| N | -0.962 |
| HB | -0.059 |
| HN | +0.436 |
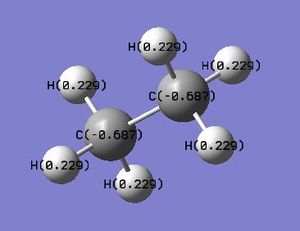
In ethane, both carbons are negatively charged with equal value of -0.687, and all hydrogens are positively charged, all with a value of +0.229. For NH3BH3, the boron is negatively charged (-0.170) and the nitrogen is also negatively charged, but more so than boron (-0.962). The hydrogens around the boron are all negatively charged, but only very slightly (-0.059) and the hydrogens around the nitrogen are all positively charged (+0.436). The nitrogen is able to draw electron density from both boron and the hydrogens surrounding it as it is significantly more electronegative than both hydrogen and boron. Boron is slightly less electronegative than hydrogen, but still maintains a negative charge even though it is bonded to both nitrogen and hydrogen, as some of its electron density is drawn away from it, but not enough to render the boron positive itself. This may be due to the very small difference in electronegativity between hydrogen and boron. In ethane, all the hydrogens have the same positive charge, as they are both bonded to an identical carbon atom. Carbon is more electronegative than hydrogen, hence resulting in a positive charge on all hydrogens, and a negative charge on both carbons. Ethane does not display differing amounts of charge on each of its hydrogens as all hydrogens are in the same environment, unlike the hydrogens in ammonia-borane, which experience different amounts of charge due to the different atoms (N or B) to which they are bonded.
The C-C bond is non-polar, whereas the N-B bond is slightly polar due to difference in electronegativity of nitrogen and boron. To chemically manipulate the charges on the carbon atoms in ethane, or the nitrogen and boron atoms in ammonia-borane, the molecule could be synthesised with a different functional group in place of one of the hydrogen atoms. For example, in ethane, if one hydrogen was replaced with an alcohol group, the carbon that is bonded to the alcohol group would have a more positive charge (or less negative), as oxygen is more electronegative than carbon and will draw electron density towards itself away from the specified carbon. The same effect would be observed if one of the hydrogens bonded to either the nitrogen or boron in ammonia-borane was replaced with an alcohol group, as oxygen is more electronegative than both nitrogen and boron.
Smf115 (talk) 16:51, 28 May 2018 (BST)Great charge analysis between ethane and NH3BH3 with mention of the bond polarity and ideas given on how to manipulate the charges.
BBr3
Optimisation
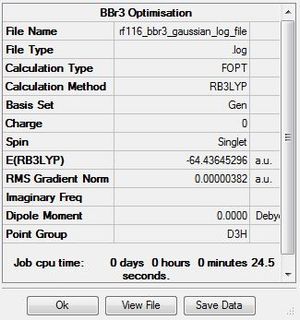
The .log file for the optimisation of BBr3 can be found here. The basis set used is B3LYP/6-31G(d,p)LANL2DZ.
Item Table
       Item               Value     Threshold  Converged?
Maximum Force            0.000008     0.000450     YES
RMS     Force            0.000005     0.000300     YES
Maximum Displacement     0.000036     0.001800     YES
RMS     Displacement     0.000023     0.001200     YES
Predicted change in Energy=-4.027291D-10
Optimization completed.
   -- Stationary point found.
The database link for the optimised BBr3 molecule can be found atː DOI:10042/202453 .
Frequency Analysis
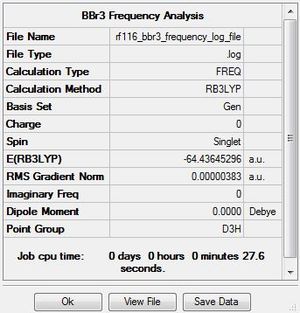
The .log file for the frequency analysis of BBr3 can be found here. The basis set used is B3LYP/6-31G(d,p)LANL2DZ.
Boron tribromide |
Frequencies
Low frequencies ---   -0.0137   -0.0064   -0.0046    2.4315    2.4315    4.8421
Low frequencies ---  155.9631  155.9651  267.7052
The database link for the frequency analysis of the BBr3 molecule can be found atːDOI:10042/202454 .
Table of Vibrational Frequencies
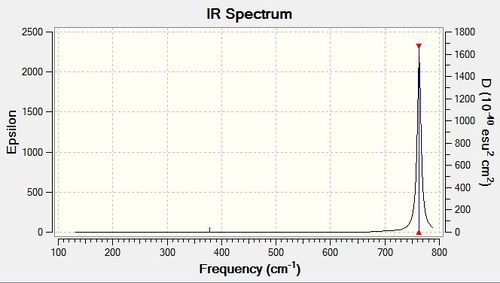
| Mode | Frequency / cm-1 | Intensity | IR active? | Symmetry | Type of vibration |
| 1 | 156 | 0.08 | No | E' | Bend |
| 2 | 156 | 0.08 | No | E' | Bend |
| 3 | 268 | 0 | No | A1' | Symmetric Stretch |
| 4 | 378 | 4 | Yes | A2" | Bend |
| 5 | 763 | 320 | Yes | E' | Asymmetric Stretch |
| 6 | 763 | 320 | Yes | E' | Asymmetric Stretch |
IR Spectrum
Projectː Aromaticity
Benzene
Optimisation
The .log file for the optimisation of benzene can be found here. The basis set used is B3LYP/6-31G(d,p).
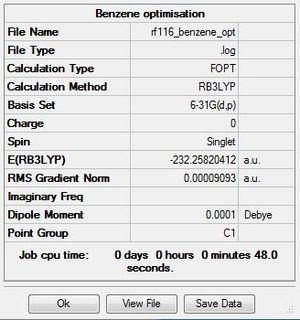
Item Table
       Item               Value     Threshold  Converged?
Maximum Force            0.000198     0.000450     YES
RMS     Force            0.000082     0.000300     YES
Maximum Displacement     0.000849     0.001800     YES
RMS     Displacement     0.000305     0.001200     YES
Predicted change in Energy=-4.741875D-07
Optimization completed.
   -- Stationary point found.
Frequency Analysis
The .log file for the frequency analysis of benzene can be found here. The basis set used is B3LYP/6-31G(d,p).
Benzene |
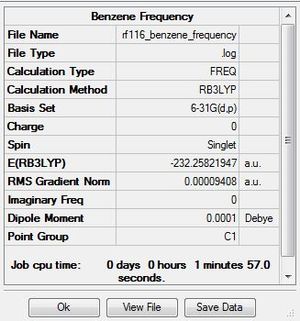
Frequencies
 Low frequencies ---  -11.6728   -0.0010   -0.0002    0.0001    6.6686   15.6846
 Low frequencies ---  414.0392  414.6031  621.0860
Borazine
Optimisation
The .log file for the optimisation of borazine can be found here. The basis set used is B3LYP/6-31G(d,p).
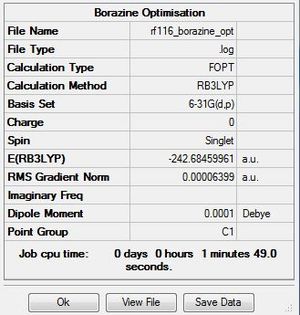
Item Table
       Item               Value     Threshold  Converged?
Maximum Force            0.000085     0.000450     YES
RMS     Force            0.000033     0.000300     YES
Maximum Displacement     0.000249     0.001800     YES
RMS     Displacement     0.000077     0.001200     YES
Predicted change in Energy=-9.317214D-08
Optimization completed.
   -- Stationary point found.
Frequency Analysis
The .log file for the frequency analysis of borazine can be found here. The basis set used is B3LYP/6-31G(d,p).
Borazine |

Frequencies
 Low frequencies ---  -16.2492  -10.9927    0.0005    0.0006    0.0008    1.4057
 Low frequencies ---  288.8325  289.7549  404.2298
Charge Analysis

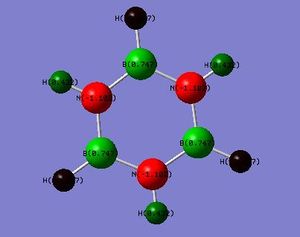
Benzene Charge Table
| Atom | Charge |
| C | -0.239 |
| H | +0.239 |
Borazine Charge Table
| Atom | Charge |
| B | +0.747 |
| N | -1.102 |
| HB | -0.077 |
| HN | +0.432 |
Discussion
The images and tables above show the charge analysis of both benzene and borazine. The colour range used is the same for both molecules, in order to make the colours and therefore the charges on each atom in the molecules directly comparable.
For benzene, all the carbons have an equal amount of negative charge (-0.239) and all the hydrogens have the same positive charge, which is equal in magnitude to that of the carbon atoms, but with opposite sign (+0.239). This is because all hydrogens are in the same chemical environment within the symmetric molecule, as are all the carbons. As a result of this, all the carbons in the molecule have the exact same electronegativity. Since carbon is more electronegative than hydrogen, the carbon draws electron density away from the hydrogen atoms, resulting in a negative charge on the carbon and a positive charge on the hydrogens.
In borazine, the charges are more varied as the molecule has reduced symmetryː in borazine the carbon atoms are replaced by alternating nitrogen and boron atoms. The charge of the hydrogens differ depending on whether the hydrogen in question is bonded to a nitrogen or a boron atom. The charge table for borazine shows that the hydrogens bonded to a boron atom, HB, have a small amount of negative charge (-0.077), whereas the hydrogens bonded to the nitrogen atoms, HN, have a significantly greater magnitude of positive charge (+0.432). All borons in borazine are in the same chemical environment, as are all the nitrogens, hence the all the nitrogens have equal negative charge (-1.102) and all borons have equal positive charge (+0.747).
Nitrogen is significantly more electronegative than both boron and hydrogen, which explains why the nitrogen has the largest charge magnitude, and why its charge is negative. The nitrogen draws the electron density away from the hydrogens bonded to it (and also from the boron atoms that it neighbours) and hence such hydrogens are positively charged. Boron is only slightly less electronegative than hydrogen and significantly less electronegative than nitrogen. The boron atoms already have some of their electron density drawn away from them by the nitrogen atoms, and the HB atoms also draw away a small amount of this remaining electron density. This results in a slightly negative HB, and a large positive charge on the boron atoms.
The charges are therefore more variable in both magnitude and sign in borazine than they are in benzene. In borazine, there are two different hydrogen environments, which are bonded to either a nitrogen or a boron, each of which have different electronegativity, therefore each hydrogen type has a different charge. In benzene, there is only one hydrogen environment, all of which are bonded to an identical carbon atom, all with the same electronegativity and hence all hydrogens have the same charge.
Smf115 (talk) 14:34, 1 June 2018 (BST)Good justification of the charge distribution using the relative electronegativities. However, the same colour range has not been used across both molecules (similar charge values would have similar colours which they don't). To improve, other factors such as symmetry of the net charge of the molecule could have also been considered.
Molecular Orbitals
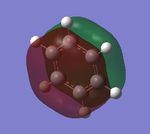
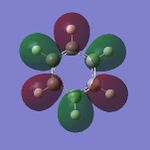
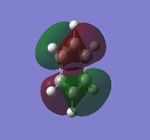
Analysing the molecular orbitals for benzene, it can be concluded that MO7 - MO21 are the occupied valence MOs. MO21 is the HOMO and MO22 is the LUMO. This is as the energy is significantly lower for MOs 1-6. The energy increases from -6.747, corresponding to MO6, to -0.835, corresponding to MO7. Since the energy increases significantly from MO6 to MO7, it can be concluded that MO7 onwards are the valence molecular orbitals. The lowest five unoccupied orbitals are MO22-MO26.
The molecular orbitals for borazine follow a similar pattern to that of benzene. There is again a significant increase in energy between MO6 and MO7, increasing from -6.747 to -0.889, for MO6 and MO7 respectively. The occupied valence MOs are therefore again MO7-MO21. The HOMO is MO21 and the LUMO is MO22. Similarly to benzene, the lowest 5 unoccupied MOs are MO22-26.
The HOMO of both benzene and borazine have very similar energy values, at -0.247 and -0.276 respectively. However, the energy of the LUMO differs by a 10th order of magnitude - benzene has a slightly lower energy LUMOː -0.00267 and -0.0242 for benzene and borazine respectively.
Smf115 (talk) 14:42, 1 June 2018 (BST)Nice introduction explaining which ones the valence and core orbitals in both molecules and decent comparison for each of the MOs. The character summary is very clear and well presented, however, the overall MO character should be one of anti-bonding, bonding or non-bonding and not multiple. To improve, more details could be included and energies should never be compared between two different orbitals, only relative positioning of the orbitals/energies can be.
An aromatic molecule is defined as a molecule that is cyclic, has a continuous set of p orbitals that are orthogonal to the plane of the ring, and has (4n+2) p electrons (in other words, it obeys Huckel's Rule). Aromatic molecules have a very high stability, and therefore are not very reactive. This is due to resonance stabilisation and π-conjugation around the ring - the p electrons are destabilised across the ring. Using benzene as an example, when a magnetic field is applied to an aromatic molecule, a ring current is induced caused by the movement of π electrons. The protons that are outside the ring are therefore deshielded. The bond lengths of aromatic molecules are intermediate between the single and double bond lengths (for example - in benzene, the bond carbon-carbon bond lengths is in between the values for a single C-C bond and a double C=C bond). [3]
The real MOs show a variety of bonding and antibonding character, and both σ and π MOs are present. The MOs, for example MO17, which shows a π bonding MO, shows that the electron density from the orthogonal p orbitals does combine in phase to form delocalised electron charge above and below the plane of the ring. This is representative of the basic concept of aromaticity. This represents the overlap of pz AOs. However, this is not a sufficient description in itself for aromaticity. This is because some molecules that are not completely planar, and therefore do not have overlapping pz AOs (and are not formally defined as aromatic using the above definition), can have some degree of aromaticity. Therefore there must be further contributions other than overlapping pz AOs that are able to contribute to a molecule being aromatic. From the calculated MOs, it can be concluded that other orbitals overlapping - such as a combination of p orbitals overlapping and p orbitals overlapping with s orbitals, can form a π MO that is similar to a delocalised electron density, which is able to result in increased stabilisation of the molecule and movement of π electrons throughout the molecule. Furthermore, some molecules that do have overlapping pz AOs are not aromatic - for example cyclobutadiene, which is actually anti-aromatic, with 4n p orbital electrons. This molecule does have a continuous set of overlapping p orbitals with a delocalised π electron system, but in contrast to aromatic molecules, is very unstable and highly reactive. It can be concluded that therefore for a molecule to be aromatic it has to fit all the criteria, including the correct number of p orbital electrons, which all together result in the stabilisation of the molecule.
By comparison of the MOs of benzene and borazine, it can be concluded that borazine is an aromatic molecule. The MOs are not as delocalised compared to benzene, and hence borazine is not as aromatic as benzene.
Smf115 (talk) 14:42, 1 June 2018 (BST)Overall, a decent wiki report.
References
- ↑ Dr. P Hunt, Molecular Orbitals Lecture Course, The molecular orbital diagram for trigonal planar BH 3 (Model Answers) •, Boron, 3, 3–5.
- ↑ http://www.chem.tamu.edu/rgroup/connell/linkfiles/bonds.pdf
- ↑ M. Palusiak and T. M. Krygowski, Application of AIM parameters at ring critical points for estimation of π-electron delocalization in six-membered aromatic and quasi-aromatic rings, Chem. - A Eur. J., 2007, 13, 7996–8006

