Inorganic:luke4912
Computational Chemistry Lab: Inorganic - Module 2
Optimising a Molecule of BH3
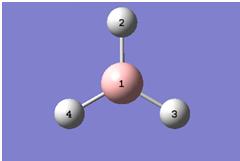
The first task in this module was to optimise a molecule of borane - BH3. This was done in Gaussview, using the Gaussian Calculation Function with the following parameters: B3LYP methodology and 3-21G basis set. Since the molecule is relatively simple and the basis set is a poor one, the calculation was performed on the laptop and took 20 seconds. The population analysis output file can be viewed here:[[1]]
The results summary showed an RMS gradient <0.001 therefore the calculation was a success and the optimisation had reached the energy minimum. From the output file, the different B-H bond lengths and H-B-H bond angles were found, these are tabulated below:
| Atoms | Value | |
|---|---|---|
| Bond Length | 1-2 | 1.19A |
| Bond Length | 1-3 | 1.19A |
| Bond Length | 1-4 | 1.19A |
| Bond Angle | 4-1-3 | 120.0o |
| Bond Angle | 4-1-2 | 120.0o |
| Bond Angle | 3-1-2 | 120.0o |
The data proves all the B-H bonds are equivalent and thus the molecule must have a D3h point group.
Frequency Analysis
A frequency analysis was then performed on BH3, this is the process of differentiating between the possible maxima, minima and transition states within the energy profile of the molecule. When BH3 is optimised the first derivative of the energy is set to zero. Graphically speaking, the second derivative must then be calculated to determine the nature of this stationary point. For instance, if the calculation output frequencies are all positive, a minimum energy has been found; if they are all negative then a maximum energy has been found. A mixture means the point is a transition state.
In order to minimise calculation time on the laptop, the same methodology and basis set used for the optimisation was used for the frequency analysis. This way the program didnt need to re-optimise the molecule again. The results are discussed in the vibrational analysis section below, in summary: all the frequencies were positive meaning the minimum energy orientation had been found.
Vibrational Analysis
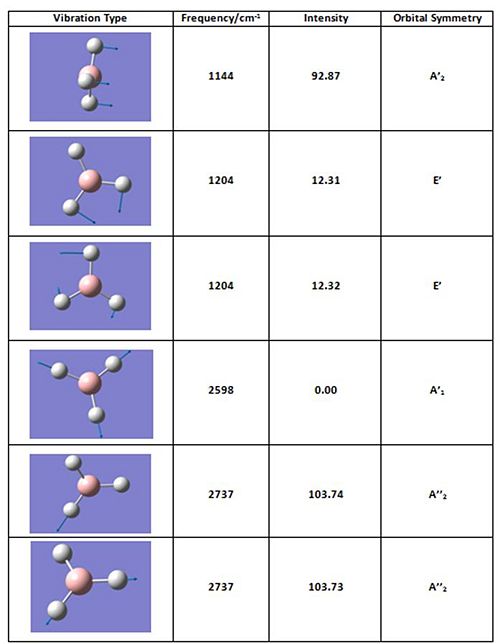
Analysis of the molecular vibrations of BH3 was carried out using the frequency analysis output file. In the table below, all six vibrations have been animated and their respective frequencies and intensities reported. The table shows all the vibrational frequencies are positive and therefore the calculation was a success, the lowest energy orientation has been found. Also to note is the degeneracy of some vibrations as well as a zero intensity mode, therefore an IR spectrum of this molecule may not contain six peaks.
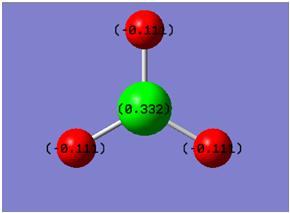
Natural bond orbital data was also recorded - bonding orbital occupancy and energy is reported in the table below. This is accompanied with a diagram of BH3 showing the NBO charges on each atom.
| Orbital | Atoms | Occupancy | Energy/Ha |
|---|---|---|---|
| BD | B1-H2 | 2.00 | -0.437 |
| BD | B1-H3 | 2.00 | -0.437 |
| BD | B1-H4 | 2.00 | -0.437 |
| CR | B1 | 2.00 | -6.645 |
| LP* | B1 | 0.00 | 0.678 |
In the initial stages of a Gaussian calculation, Gaussview does not show any bonds in a molecule. This however is just a convention and should not be noticed - if the distance between two atoms is larger than Gaussview's predefined definition of a bond length it will simply not draw a bond in place, this does not mean however there is no interaction between the atoms. A bond could be defined as a favourable electronic interaction between two atoms.
Molecular Analysis
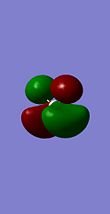
The BH3 molecule was subject to one further analysis, of its molecular orbitals. By refining the Gaussian calculation with keywords: "pop=full" the seven lowest energy BH3 molecular orbitals were calculated and animated below (with their symmetry labels). A molecular orbital diagram of the molecule accompanies the animations so the correlation between real MOs and LCAO MOs can be seen. The diagrams show good agreement between models, however the real MOs are somewhat misleading when visualised. For instance, the 3a' real MO shows roughly equal bonding contributions from the H & B orbitals, whereas the LCAO MO predicts small contributions from the H orbitals. This highlights the differences between a theoretical and mathematical model.
 |
 |
 |
 |
 |
 |
 |

Optimising a Molecule of BCl3

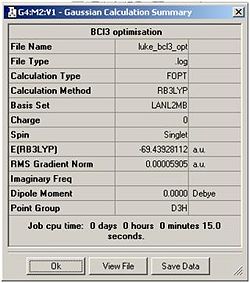
The next stage of this module was to improve the accuracy of calculations using the simple molecule BCl3. This involved optimising the molecule using the same method as before (B3-LYP) but with a more accurate basis set: LanL2MB. This basis set imposes a pseudo-potential on the chlorine atoms, the result is: the calculation is restricted and will only take into account the valence electron bonding interactions with the boron atom. This is merely to shorten the calculation time. Captured on the right is the calculation summary, showing it took 15 seconds to complete and the RMS gradient once again is satisfactory. The molecule has been assigned the D3h point group.
From the log file:[[2]] the following properties of the molecule were deduced:
| Atoms | Value | |
|---|---|---|
| Bond Length | 1-2 | 1.87A |
| Bond Length | 1-3 | 1.87A |
| Bond Length | 1-4 | 1.87A |
| Bond Angle | 4-1-3 | 120.0o |
| Bond Angle | 4-1-2 | 120.0o |
| Bond Angle | 3-1-2 | 120.0o |
Again, all the bonds are equivalent in this molecule. The literature[1] quotes the exact same bond angles and B-H bond lengths of 1.75A which are very close to the calculated values. The model is in good agreement with the experimental evidence, this is expected since BCl3 is a simple molecule and thus the basis set is accurate enough.
Isomers of Mo(CO)4L2
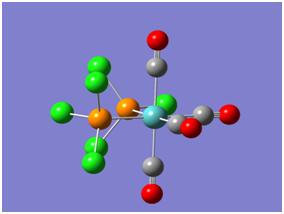
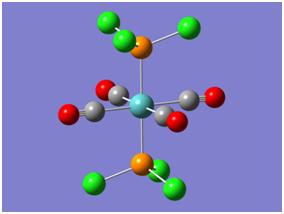
In this section of the module two octahedral complexes of molybdenum were investigated: the cis and trans isomers of Mo(CO)4L2 where L = PCl3. Images of these molecules are shown below, the investigation was centered on their structures, relative energies (for thermal stability comparison) and IR spectra. Due to the complex nature of these molecules their calculations had to be submitted to SCAN for overnight computing. To begin with however, a "loose" or inaccurate optimisation was performed to gain a rough interpretation of their geometries. Both isomers were optimised using the B3-LYP method and pseudo-potential basis set LanL2MB, these parameters gave a short calculation time. The resultant optimised molecules were then subject to a more accurate calculation, by changing the basis set to LanL2DZ and restricting it to "int=ultrafine". Keyword "scf=conver=9" was also inputted which relates to the high definition Gaussian is required to compute the molecular orbitals with. Finally, it was known the molecule had several potential energy minima close to each other, so the molecules had to be manually altered to avoid Gaussian calculating to a false minimum. This was achieved by changing the PCl3 groups torsion angles and orientation.
The new optimised molecules were shown to contain no bonds between the P and Cl atoms, however this was discussed earlier and is irrelevant to the analysis. One final step to the improve the results included changing the keyword in the calculation to "extrabasis" this allows gaussian to incorporate P's d-orbitals. The results from this optimisation are clear: more basis functions are used and thus a more accurate geometry is calculated - the P-Cl bonds shorten slightly. (Expected since Cl will back-bond into vacant Pd-orbitals.
 |
 |
Structural Analysis
From the LOG files, the final optimised molecules differ in energy by only 2kJ/Mol (the trans isomer having the lower energy of: -1637350.5 kJ/mol). Although the trans isomer is expected to be lower in energy, given the inherent assumptions and inaccuracies of this computational work, such a small difference in energy can be deemed negligible. The trans isomer should be lower in energy since it would cause less steric hinderance within the molecule, this effect may have been easier to see with larger L ligands like PPh3 for instance. From 2nd year synthetic labs, thermal cis to trans isomerisation was seen in Mo(CO)4(PPh3)2.
Frequency Analysis
Similar for BH3 a frequency analysis was run on the molecules. The resultant frequencies (for C=O stretches) are tabulated below for both isomers, along with the literature[2] values. All the frequencies are positive indicating the zero point on the potential energy surface was a minimum.
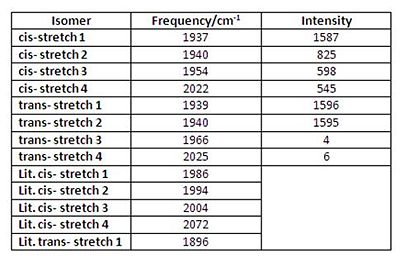
In accordance with group theory, the cis isomer shows four C=O stretching modes, all different in frequency and intensity. Whereas the trans isomer only shows one real stretching mode, since two signals have a negligible intensity and two signals have nearly identical frequencies (ie they are degenerate). Upon Gaussview animation of the trans vibrations, the degenerate signals were found to be from two pairs of carbonyls stretching asymmetrically - in effect the same movement. Overall, the calculated frequencies are all lower than the literature values, but relatively speaking they retain the same margins and patterns eg. cis stretch 1 & 2 are similar. This would lead to the conclusion that the calculations were successful, but due to model limitations and inaccuracies, the computed values are not an exact match to the experimental values.
Symmetry
Worth mentioning is Gaussian's symmetry result that the trans complex optimised into C1 point group geometry. This is initially strange since it is expected to have D4h symmetry. However, it is this slight deviation in symmetry that allows the two trans low-intensity absorptions to occur (at 1966 & 2025 cm-1)- these vibrations are still changing the dipole moment of the molecule. (They wouldnt be if the molecule was perfect D4h. The calculation shows all the Mo-C bond lengths are slightly different length.
One final point can be made from the frequency analysis - the presence of low frequency vibrations (at 5.87cm-1 in the cis complex and 7.03cm-1 in the trans). Much a minor absorption would be related to a freely occurring rocking motion of the PCl3 groups, happening at room temperature.
References
[1] - S. Lu, Chemical Physics, 2003, 287 (3), pp 297-302
[2] - C. S. Kraihanzel, Inorg. Chem., 1963, 2 (3), pp 533–540
