Inorganic:club banger
Module 2
Initial Calculations on Trigonal Planar Boron Molecules
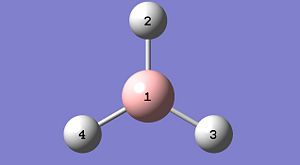
Borane was created and manipulated so the B-H bonds were initially at 1.50A each. This was then optimised using B3LYP and the 3-21G basis set. The resultant molecule is shown below in it's Gaussview image, and selected physical data is also tabulated.
| Property | Atoms | Value |
|---|---|---|
| Bond Length | 1-2 | 1.19A |
| Bond Length | 1-3 | 1.19A |
| Bond Length | 1-4 | 1.19A |
| Bond Angle | 2-1-3 | 120deg. |
| Bond Angle | 2-1-4 | 120deg. |
| Bond Angle | 4-1-3 | 120deg. |
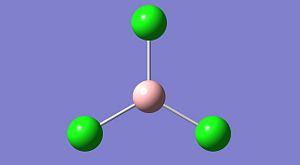
A trichloroborane was then optimised using the same B3LYP method, but a different, more accurate basis set LanL2MB. This also imposes a psuedo potential on the chloride to reduce the amount of electrons in the calculation and to then reduce the calculation time required.
| Property | Value |
|---|---|
| B-Cl bond length | 1.87A |
| Cl-B-Cl angle | 120deg. |
| Energy | -69.4393Hartree |
| Dipole | 0Debeye |
The population analysis of borane was completed and the file can be found here: https://www.ch.ic.ac.uk/wiki/index.php/Image:BH3_POP.LOG
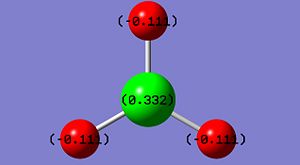
NBO data on the bonding orbital occupancy and energy is tabulated below. The image shows the NBO charges on each atom.
| Orbital | Atoms | Occupancy | Energy |
|---|---|---|---|
| BD | B1-H2 | 1.99853 | -0.43712Ha |
| BD | B1-H3 | 1.99853 | -0.43712Ha |
| BD | B1-H4 | 1.99853 | -0.43712Ha |
| LP* | B1 | 0.0000 | 0.67666Ha |
| Number | Form of Vibration | Frequency / cm-1 | Intensity | Symmetry |
|---|---|---|---|---|
| 1 |  |
1144 | 92.9 | A |
| 2 | 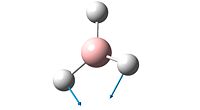 |
1204 | 12.3 | E' |
| 3 | 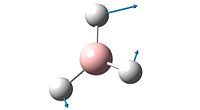 |
1204 | 12.3 | E' |
| 4 | 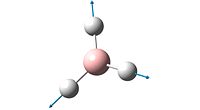 |
2598 | 0 | A' |
| 5 | 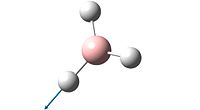 |
2737 | 103.7 | E' |
| 6 | 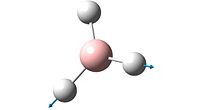 |
2737 | 103.7 | E' |
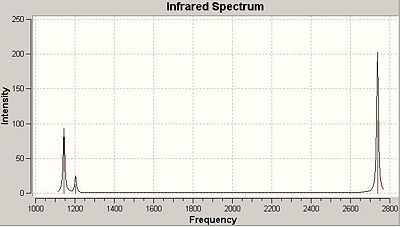
The spectrum of BH3 only inculdes 3 peaks whereas the calculations show that the molecule has 6 vibrations (3N-6 rule). The reason there are only 3 peaks is that two vibrations that both absorb at 1204 are degenerate, as are two absorptions which absorb at 2737cm-1. The peak at 1144cm-1 is unique, and shows on the spectrum. The 4th vibration, frequency 2598cm-1, shows no peak in the spectrum as its vibration incurs no change in dipole for the molecule and so does not meet the necessary characteristics of vibrations imposed by group theory.
Calculations on BCl3
The BCl3 was optimised and subjected to a frequency analysis. The analysis gave 6 different vibrations all with positive values which confirms the stationary point found in the optimisation was a minimum.
The method used in calculating the optimal geometry was B3LYP a method which is based on Density Functional Theory. The basis set used with this was LANL2MB which also incorporates a psuedo potential for the heavier chlorine atoms. A psuedo potential takes the core electrons and nucleus as one, and gives them their own potential. The valence electrons are then placed around this. It is only necessary for heavier atoms and reduces the computational time/power required.
The same method and basis set must be used for both calculations as the PE surface calculated by a certain method and basis set will vary from that calculated by another, and as the optimisation relies on the first derivative of the PE surface (amongst other things) and the frequency relies on the second derivative, for the two to match up, the same basis set and method must be used.
A frequency analysis is used to ensure that the stationary point found in the optimisation was a minimal (stable) stationary point. The frequency analysis computes the second derivative of the PE surface in which the molecule sits so any negative values given in the output indicate that the molecule is at a maximal point on the surface as the curvature is negative for these points. These maximal stationary points are unstable and so not the desired finishing points for an optimisation.
The bonds that are produced by GaussView are implemented by the program from the data given in the Gaussian output. For GaussView to place a 'bond' between two atoms, the distance between those must be less than a pre-defined value that is written into the program. If for some reason the distance between the two atoms is longer than normal, then GaussView may remove the 'bond' that it shows in the image produced. This does not mean that the atoms aren't bonded, just that they are not as close as together as those two atoms are when bonded. The reasons for a longer bond than normal can be multiple (anomeric effect, pi backbonding to coordinated ligands, etc.) but GaussView is not smart enough to take these into account. Gaussian computes the ideal electronic structure around nuclear coordinates and then GaussView converts this data into a viewable image. Just because GaussView doesn't show the bond, doesn't mean it isn't there!
For a bond to be formed there are several factors which need to be met. In covalent bonds there is a significant orbital overlap between the two atoms and this forms a bonding orbital which allows electron density to congregate between the two nuclei, making the favourable coulombic interactins between electrons and nuclei greater than the repulsive interactions between the two nuclei. In ionic species there may not be so much orbital overlap, but an electrostatic interaction between the anion and cation.
The expected symmetry of the optimised structure is D3H and this is the reported point group from the Gaussian output. This shows good agreement between the theoretical and experimental procedures.
The time taken for the frequency was 14.0s.
BH3 MOs
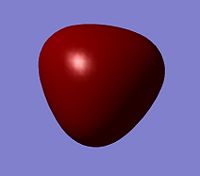
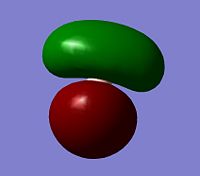
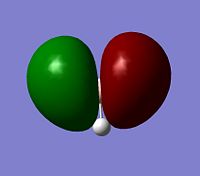
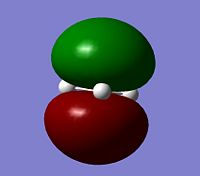
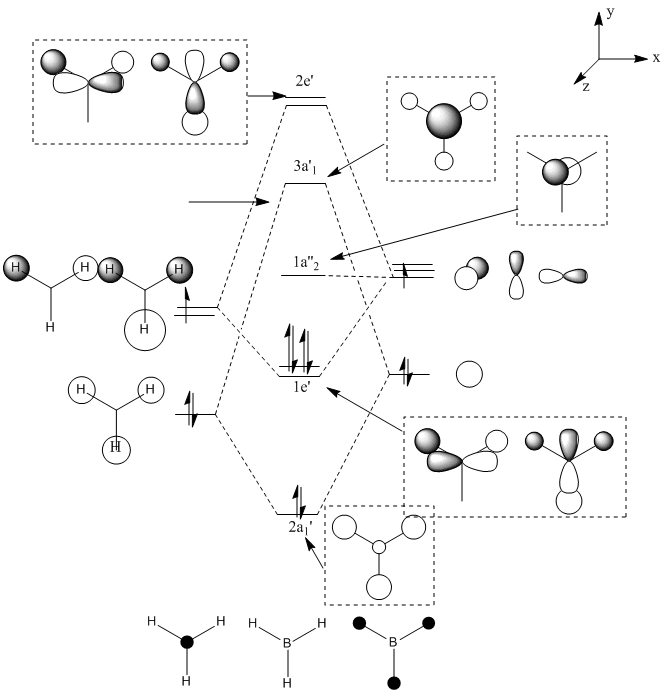
The computed MO surfaces are shown below from HOMO-2 (left) to LUMO+1 (right). By comparison with the LCAO MO diagram given below these images, the agreement of the two methods is good. The AOs in each MO seem to match exactly in orientation. The coefficients of the different AOs does not match between the two methods. Such as in LUMO+2, the LCAO approach implies a larger contribution from the hydrogens, but the generated MO doesn't show this.
Isomers of Mo(CO)4(PCl3)2
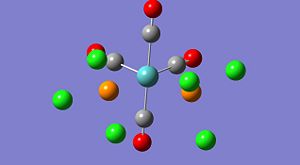
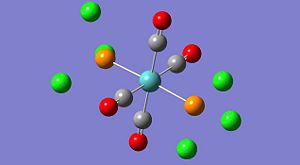
Two isomers of the a molybdenum complex were studied computationally to predict their relative thermal stability and spectroscopic data. The isomers studied were the cis and trans forms shown below. (Please note these are not the optimised structures).
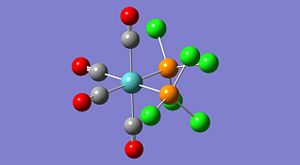
Initially the two molecules were optimised using B3LYP and a low level basis set and psuedo potential, LANL2MB. On top of this the keyword opt=loose was used to increase the threshold value for convergence and so reduce the amount of time taken to run the calculation. This was justified by the fact that this was just an initial calculation and the result would only be used as a stepping stone to a more accurate optimisation.
The calculation returned an optimised structure, and this was then submitted to a more precise calculation by changing the basis set/psuedo potential to LANL2DZ. The 'opt=loose' was removed and replaced with int=ultrafine - which decreases the threshold value for the gradients (force) and step-sizes (displacment) to reach before the structure is deemed optimised. The keyword scf=conver=9 relates to the electronic structure of the molecule and defines how well gaussian will calculate the molecular orbitals. With conver=9 the electronic structure will be optimised to a higher level than was done in the previous optimisation.
Some manual manipulation of the initially optimised structure was also required as the PE surface was known to contain more than one stable minimum in close vicinity. The manipulation was to the PCl3 groups, particularly their dihedral angles with the CO groups. These changes ensured that the optimisation proceeded to a global minimum. Gaussview images of the optimised structures are given below.
The structures look quite misleading as Gaussview has not assigned bonds between the phosphorus and chloride atoms on each PCl3 group. Although this seems like an error in the calculation it is actually a misinterpretation of gaussview. Gaussian does not consider bonds between atoms, but optimises the electronic and nuclear structure from the given input configuration. Gausview then reads the final geometry and displays the configuration in the image shown above, whether there is a bond 'bar' shown between two atoms is determined by gaussview by comparing the distance between two particular atoms to a predefined value for the bond distance of those particular atoms. In this case, the P-Cl distance is obviously slightly longer than normal and is over the threshold imposed by gaussview. The chlorides are still bonded to the phosphorus, but the bond is longer and weaker than a standard P-Cl bond is.
To improve the level of accuracy even further the basis set was improved using the key word: extrabasis. This allowed gaussian to include the phosphorous d-orbitals during its electronic optimisation and so improve the approximation to the true form of the molecular orbitals. The difference this made can be seen in the log files. The previous optimisation reported using '158 basis functions' whereas this final optimisation used '168 basis functions'. Clearly there has been an increase in the number of functions gaussian can use to approximate the molecular orbitals. The difference is seen in the shortening of the P-Cl bonds by over 0.2angstrom in both cases, quite a significant change.
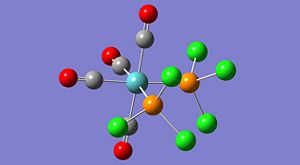
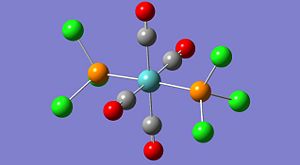
The final structures are shown to the left and the difference in energy between the two was just 4kJ/mol, with the trans isomer being lower. This is a relatively small difference in energy between the two but the equilibrium mixture would be determined by the barrier or isomerisation, which was not determined. It is known that the cis isomer will convert to the more stable trans form at room temperature when dissolved in toluene. (2nd yr Inorganic lab)
The extra stability of the trans form is expected to lie mainly in the reduced sterics in comparison to the cis form. The sterically demanding PCl3 groups interact quite a fair amount in the cis form, compared to the trans, and this in turn increases the molecule's energy.
The frequency analysis of the molecule yielded just positive values - indicating that the stationary point reached was a minimum. The stretches in the carbonyl region (1700-2100cm-1) are tabulated below for each isomer.
| Frequency | Intensity |
|---|---|
| 1939 | 1596 |
| 1942 | 822 |
| 1953 | 593 |
| 2020 | 541 |
| Frequency | Intensity |
|---|---|
| 1939 | 1606 |
| 1940 | 1606 |
| 1967 | 6 |
| 2026 | 5 |
The cis isomer shows 4 distinct bands in the carbonyl region, all with similar but different frequencies as well as intensities. The trans isomer also shows four different absorptions, but two are very similar both in the frequency absorbed and the intensity, and the other two are very low in intensity and expected to be negligable. From group theory, the expected number of bands for CO vibrations is 4 for the cis isomer and 1 for the trans.
The two very similar frequencies for the trans isomer can be considered the same vibration. Animation in gaussview showed that 1939cm-1 was the assymetric stretching of two trans-carbonyls, whereas 1940 was the assymetric stretching of the other two - equivalent - trans carbonyls. This is essentially the same movement, and the two movements should be degenerate as the carbonyls should map onto each other upon rotation, but, the point group is C1 rather than D4h (due to small discrepencies in the structure, see below) so the moevements are infact slightly different and hence lose their degeneracy, becoming two distinct vibrations in the calculations of gaussian.
The reported literature values[1] for the complexes CO vibrations are given below.
| cis-isomer | 2072, 2004, 1994, 1986 |
|---|---|
| trans-isomer | 1896 |
According to group theory, an IR absorption will only occur if the resultant vibration incurs a change in dipole moment of the molecule. The two very low intensity vibrations for the trans isomer seemingly break this rule but this is assuming that the molecule is of the D4h point group. The log file reports the syymetry of the molecule as C1, and the 4 Mo-C bonds are all slightly different lengths. This means that despite the high symmetry of the vibrations, the dipole moment does change by a small amount and a low intensity absorption occurs as seen.
Low freqency absorptions occur for both isomers. For the cis at 4.45cm-1 and 6.97cm-1 and the trans at 11.39cm-1 and 20.07cm-1. These vibrations primarily involve the rocking of the PCl3 groups and would occur freely at room temperature. The energy of the photons in joules for each of the absorptions is lower than the value of kT so the vibrations would be expected to occur freely as the photons of the correct energy/frequency would be in abundance.
Mini-Project: Square Planar Complexes of Platinum containing an Ethylene Ligand
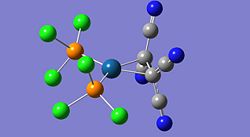
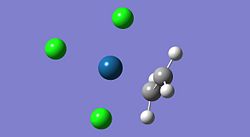
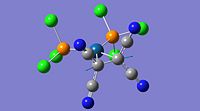
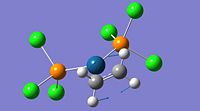
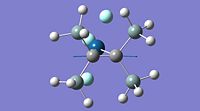
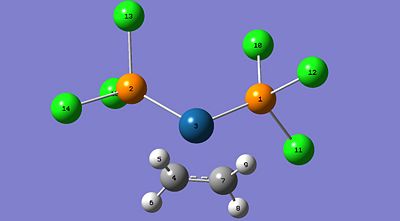
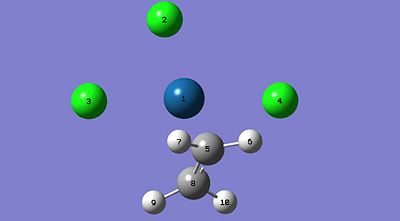
A study into the electronic structure of 5 different platinum complexes was undertaken using quantum based computational methods. The five different complexes studied are shown below and are expected to show varying electronic structure, particularly around the ethylene bond.
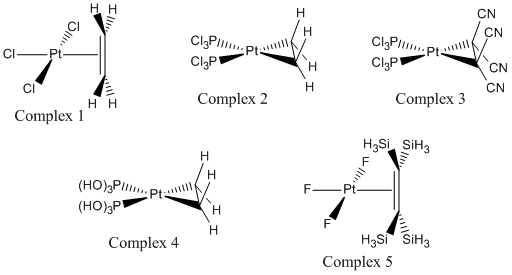
The 5 complexes are expected to show different lengths of C-C bond in the ethylene ligand, this is due to different levels of pi-back bonding from the platinum metal induced by the variation of the other ligands on the Pt centre as well as the substituents on the ethylene. The back bonding occurs through interactions between the C=C pi* bond and the symmetry relevant d-orbitals of the platinum. As the pi* on the ethylene is empty, the d-orbital on the platinum needs to be occupied and the occupancy of the Pt orbitals is related to the electron withdrawing or donating abilities of the ligands around the platinum centre.
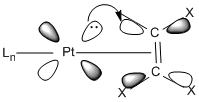
The image to the left depicts the back-bonding process. The filled d-orbital on the platinum donates electron density to the ethene pi* bond, which decreases the bond order of the ethene C=C bond. The nature of the other ligands on the platinum effect this process as they influence how electron rich or poor the platinum centre is. Electron donating groups, such as the PCl3 groups in two of the complexes, increase the elctron density on the platinum and so the back-bonding process with the ethene pi* is exaggerated to spread this extra electron density over the molecules. This means that these complexes should show an increased C=C bond length compared to the other complexes. The complexes in which L is chloride or flouride should see the opposite effect as they are both strongly electron withdrawing. This will decrease the elctron density on the platinum and so the pi back-bonding will be decreased and the ethene bond should be shorter and stronger compared to the other complexes.
The X substituents on the ethene will also have an influence on the level of back bonding occuring as they dictate how electron poor or rich the C=C double bond is. The cyano groups in complex 3 are fairly electron withdrawing, so making the ethen bond electron poor, this should induce more back-bonding from the platinum and increase the C=C bond length. The opposite can be said for the silane substituents on complex 5 as silicon is more electropositive than carbon so should make the ethene electron rich and decrease the level of back bonding occuring.

Unfortunately complex 4, with the P(OH)3 ligands, was problematic during optimisations and was dropped from the study. The reasons for this are not immediately obvious, but the structure produced from the optimisation was not sensible and despite adjustments before a re-optimisation the molecule still proceeded to a non-sensical structure.
The expected results - from the theory given above - are that complex 5 will have the shortest and strongest bond and complex 3 will have the longest and weakest. The ethylene C=C bond distances are tabulated below.
| Complex | C=C bond distance / Angstroms |
|---|---|
| 1. [PtCl3(C2H4)]- | 1.41 |
| 2. [PtF3(C2(SiH3)4)]- | 1.46 |
| 3. [Pt(PCl3)2(C2H4)] | 1.42 |
| 4. [Pt(PCl3)2(C2(CN)4)] | 1.50 |
The calculated bond lengths don't quite match the expected pattern, particularly for the fluoro silane complex (complex 5) as the C=C length is a lot longer than expected in relation to the other complexes. Despite the high electron density of the alkene and the low electron density of the platinum the alkene bond is weaker than in the other complexes (except for the cyano complex 4) therefore another C=C bond destabilising process must be taking place in the complex and this is expected to be hyperconjugation of the Si-H sigma bonds with the C=C anti-bonding orbital.
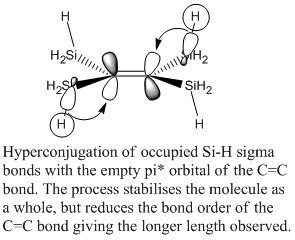
This process is shown in the image to the right. The Si-H bonding orbital overlaps strongly with the pi* C=C orbital and due to the electropositivity of the silicon the bonding orbital is high in energy and well matched with the pi* orbital. The sigma bond is a good donor and the pi* is a good acceptor. This process can happen from one Si-H bond from all 4 silane groups so is therefore 4 times additive. This gives a significant amount of electron density to the pi* orbital and destabilises the C=C bond giving the lengthening observed. The optimised structure produced by gaussian shows the one Si-H bond on each silicon to be alligned with the C=C pi*. It is also interesting to note that the structure of this complex is slightly distorted from the expected geometry as the plane in which the Pt and 3 F atoms sit in is not perpendicular to the plane of the ethylene bond. These are usually perpendicular (as in the trichloro complex) due to steric reasons, but in this case the hydrogens on the SiH3 groups cause the planes to be shifted 13deg from perpendicular.
Other than the result for the silane, the other 3 complexes give C=C bond distances as expected relative to each other. The cyano complex give the longest C=C bond and the chloro gives the shortest bond.
As well as these bond distances the variation in the electronic structure can be analysed using the Natural Bond Orbital data and also a frequency analysis as the frequency of absorption is proportional to the strength of a bond.
The C=C bond stretches for each complex are given below.
| Complex | C=C stretching freq. / cm-1 |
|---|---|
| 1. [PtCl3(C2H4)]- | 1279 |
| 2. [PtF3(C2(SiH3)4)]- | 1298 |
| 3. [Pt(PCl3)2(C2H4)] | 1247 |
| 4. [Pt(PCl3)2(C2(CN)4)] | 1295 |
The frequency analysis does not give the expected correlation with the bond length data. The harmonic oscillator model says that the frequency of vibration is proportional to SQRT(k/mu) where k is the force constant - proportional to the strength of the bond - and mu is the reduced mass of the atoms in the vibration. This implies that the larger the force constant (stronger bond) the larger the frequency of vibration is.
The expected correlation would therefore be that the longest bond would have the lowest frequency of absorption, but this is not the case. Infact the two longest C=C bonds, found in the silane and cyano substituted alkenes, also have the largest stretching frequency of 1295cm-1. This is counter-intuitive but can be explained by the other factors that influence the stretching frequency, namely the substituents on the carbon atoms. In the complexes with a non-substituted ethene ligand, the C=C vibration tabulated to the left shows the CH2 stretching as well quite major internal movement of the hydrogen atoms as well. In the cyano-ethene and silane ethene the cyanide and silane groups stay relatively still and the C=C stretching is quite exaggerated. These factors seemingly distort the frequency of absorption for the C=C stretching and so the correlation expected is not observed. The images below show the molecules with the displacement vectors for the vibration of the C=C.
The displacement vectors on the images above show the differences in the vibrations. The substituted ethenes have the majority of the movement on the carbon atoms but in the non-substituted forms the whole CH2 group moves both internally and relatively to each other. In the substituted forms the peak between 1200 and 1300cm-1 is relatively isolated, but in the normal ethane there are several peaks in this area that combine small amounts of C=C stretching with different motions of the hydrogen, these peaks all tend to come a little higher in frequency as well, tending more towards the standard ethene stretching of 1400-1500cm-1.
The NBO analysis of a molecule gives quantitative information on the occupancy of bonding and anti-bonding orbitals between adjacent atoms in the molecule. The data primarily gives data on the make up of the bonds i.e which AOs contribute, the hybridisation of each atoms, the coefficients of the AOs involved and the energy of the bonding orbital. It then also gives the formal occupancy of the orbital which is oftten close to 2. Any bonding orbitals which show a low value (~<1.8) for the occupancy of a bonding orbital indicated that the electrons have been delocalised over another part of the molecule. This should be seen in the pi-orbital of the ethene bond as these electrons form the sigma donation to the metal. A low occupancy should also be seen for the d-orbital lone pairs as these are expected to be delocalised partially into the pi* orbital of the alkene. As well as poorly occupied bonding orbitals and lone pairs the empty anti-bonding orbitals can also be analysed and some will be expected to have an occupancy greater than 0; particularly the pi* alkene bond.
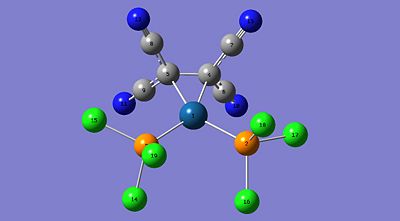
| Atoms | Type of Orbital | Occupancy |
|---|---|---|
| Pt(1)-C(5) | Bonding | 1.600 |
| C(4)-C(5) | Bonding | 1.937 |
| C(4) | Lone Pair | 1.176 |
| Pt(1) | Lone Pair | 1.868 |
| Atoms | Type of Orbital | Occupancy |
|---|---|---|
| C(4)-C(7) | sigma-Bonding | 1.995 |
| C(4)-C(7) | pi-Bonding | 1.714 |
| C(4)-C(7) | pi* Anti-Bonding | 0.320 |
| Pt(1) | Lone Pair | 1.706 |
| Atoms | Type of Orbital | Occupancy |
|---|---|---|
| C(5)-C(8) | sigma-Bonding | 1.997 |
| C(5)-C(8) | pi-Bonding | 1.642 |
| C(4)-C(7) | pi* Anti-Bonding | 0.289 |
| Pt(1) | Lone Pair | 1.725 |

| Atoms | Type of Orbital | Occupancy |
|---|---|---|
| Pt(1)-C(5) | Bonding | 1.995 |
| C(5)-C(6) | sigma-Bonding | 1.714 |
| C(6) | Lone Pair | 1.054 |
| Pt(1) | Lone Pair | 0.1343 |
The NBO data yields some interesting results, most notably at the complete emission of the C=C pi-bond in the silane and cyano substituted ethene ligands. This correlates with the longer bond seen in these coordinated ethenes, and gaussview has assigned the connection as a single bond. To replace this a Pt-C bond has been set up in both the complexes and a lone pair has been assigned to one of the carbons with an occupancy of just over one in both cases. This is expected to be interacting with the partially occupied LP* orbitals on the platinum centre.
The Cyano complex gave the longest C-C bond and this can be justified by noting the slightly increased occupancy in the carbon lone pair which is formed as the platinum donates electron density into the pi* of the C=C.
The two ethene ligands with the shorter bond show a fairly highly occupied pi-orbital between the two carbons but also a partially occupied C=C pi*. The shortest bond seen for C=C in the ethene ligands was in the [PtCl3(ethene)] complex and this is supported by the lower occupancy of the C=C pi* in this complex (0.289) compared to the complex [Pt(PCl3)2(ethene)] (0.320). The chloride complex also has a higher occupancy in it's pi bonding orbital (1.714 c.f 1.642) which strengthens the bond.
The NBO data supports the bond length data well, and also the theory given on which ligands will show the greatest degree of pi back-bonding and C=C bond lengthening.
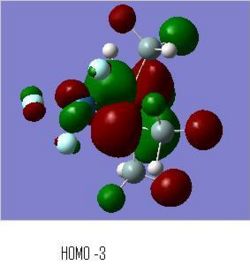
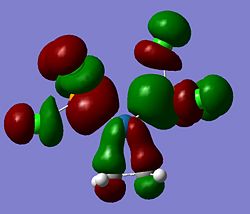
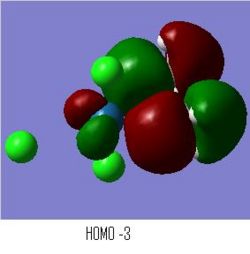
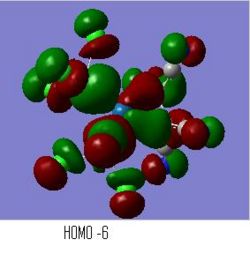
The MOs of the compexes were also produced and particular focus was placed upon the MOs which showed interaction between the pi* of the alkene and the Platinum centre. These are shown below.
The Cyano complex shows the best interaction between the C=C pi* and the Pt d-orbitals (right image) and the this is supported by this also having the longest C=C bond. The bonding interaction between the platinum and the pi* will give the pi* some electron density and so lengthen the C=C bond. The MO above shows the interaction occuring.
The Pt complex with a silane substituted ligand gave the second longest bond but the MO in the image above (left image) does not support this bond lengthening. The interaction between the pi* and the d-orbital seems weak, without much orbital overlap. This lack of interaction between the Pt and ethylene pi* supports the earlier conclusions that the lengthening of the C=C bond is due to hyper-conjugation of Si-H sigma bonds into the pi* and not from delocalised electron density from the platinum centre.
The shortest C=C bond was observed in the trichloro platinum complex (right centre), and the MOs for this complex also showed a lack of interaction between the pi* of the ethene and the platinum d-orbitals. The chlorides are fairly electronegative so inductively withdraw electron density from the platinum centre, this reduces the susceptibility of the platinum to back-bond with the ethylene ligand.
The opposite can be said for the PCl3 ethene coordinated platinum complex (left centre) which is slightly more electron rich as the phosphorus ligands are more electron donating than the chlorides so giving more electron density to the platinum centre. The MO shown in the image above has a fairly good interaction between the ligand and metal centre. This gives rise to the slighlty increased bond length in comparison to the trichloro platinum complex.
Overall the bond lengths observed in the complexes have been supported by the electronic data obtained from the calculations. The NBO analysis gave quantitative data on the occupancy of key bonding and anti-bonding orbitals which defined the length of the C=C bond and fully supported the bond lengths recorded. Those with longer bonds had more lectron density in the pi* orbital and less in the pi bonding orbital.
The frequency analysis was a bit inconclusive as it was found that the substituents on the ethylene ligand had more of an effect on the stretching frequency than the apparent strength of the bond did. This led to a lack of correlation between bond lengths and frequency of absorption.
The MO analysis has shown a qualitative version of the interaction between the ethylene orbitals and the platinum centre and supports the conclusions and bond length data reported. The longer the C=C bond, the better the MO interactions between metal centre and ethylene ligand.
In terms of the substitutents on the platinum centre and the ethylene the predictions were partly correct and partly incorrect. The mildly electron withdrawing cyano groups on the ethylene, combined with the mildly electron donating phosphorus ligands on the platinum gave rise to a longer C=C bond. The NBO and MO analysis then showed this to be due to an increased level of back-bonding from the platinum into the pi* orbital of the ethylene. This effect was then seen to decrease as the alkene was made more electron rich by changing the cyano groups to hydrogens (complex 2) and then also changing the electron donating ligands on the platinum to electron withdrawing chlorides.
A combination of electron poor platinum and an electron rich alkene was also attempted by using fluoride ligands and a silane substituted alkene. This was expected to yield the shortest C=C bond, but other factors came into play and the C=C bond length was actually the second longest. This was expected to be due to hyperconjugation of the Si-H sigma bonds into the pi* and also possibly to do with sterics.
References
1. 1. F.A.Cotton, Vibrational Spectra and Bonding in Metal Carbonyls, Vol, 3, 1964, 709.
2. Complexes for mini-project taken from Ed Marshall's 3rd Year Organo-metallics course.
D-space Uploads of Frequency Calculations on 4 molecules
https://www.ch.ic.ac.uk/wiki/index.php/Image:Cyano_Frq.out
https://www.ch.ic.ac.uk/wiki/index.php/Image:Fluoro_Silane_Freq.out
https://www.ch.ic.ac.uk/wiki/index.php/Image:PCl3_ethene_Freq.out
https://www.ch.ic.ac.uk/wiki/index.php/Image:Trichloro_Freq.out

