Inorganic:av4217
Day 1: Revision
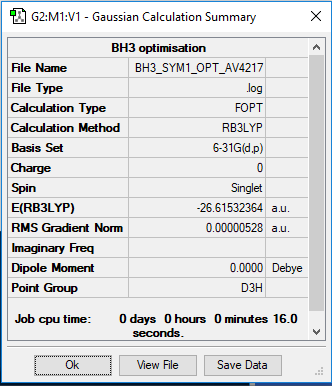
BH3 Molecule
         Item               Value     Threshold  Converged?
 Maximum Force            0.000011     0.000450     YES
 RMS     Force            0.000007     0.000300     YES
 Maximum Displacement     0.000042     0.001800     YES
 RMS     Displacement     0.000027     0.001200     YES
 Predicted change in Energy=-6.625456D-10
 Optimization completed.
    -- Stationary point found.
Low frequencies ---   -7.5936   -1.5614   -0.0055    0.6514    6.9319    7.1055
 Low frequencies --- 1162.9677 1213.1634 1213.1661
BH3 Molecule |
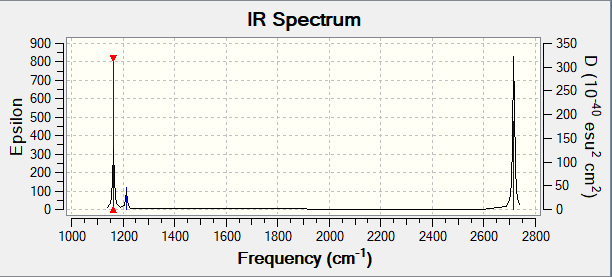
| Frequency/cm-1 | Intensity/a.u | Symmetry | IR Active? | Type |
|---|---|---|---|---|
| 1162 | 92 | A2 | Yes | Bend |
| 1213 | 14 | E' | Weak | Bend |
| 1213 | 14 | E' | Weak | Bend |
| 2582 | 0 | A'1 | No | Symmetric Stretch |
| 2715 | 126 | E' | Yes | Asymmetric Stretch |
| 2715 | 126 | E' | Yes | Asymmetric Stretch |
There are only 3 peaks when there are 6 vibration frequencies shown. This is because two pairs of vibrations (1213 cm-1 and 2715 cm-1) are degenerate, they have the same frequency, so only one peak is seen for each. Hence, two peaks are not seen in the spectrum. The frequency at 2582 cm-1 has 0 intensity as it's not IR active, so this peak is also not seen.
Good identification of both reasons which result in only 3 visible peaks in the spectrum. Smf115 (talk) 07:06, 30 May 2019 (BST)
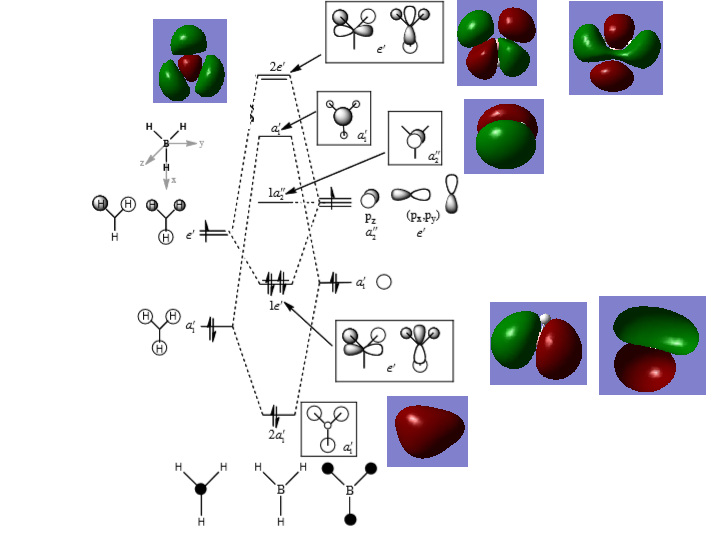
The LCAO MOs shows the two separate atomic orbitals which combine to form the molecular orbitals, while the real MOs show what the molecular orbital look like when the orbitals combined. The LCAO MOs don't show what the final molecular orbital looks like when the electron density is shared. The LCAO MOs are useful since, they show the individual atomic orbitals that form the molecular orbital. Also, they can be used to predict whether the final orbital is bonding, antibonding or non-bonding and their relative energies. However, they're not accurate in predicting the distribution of electron density in the molecular orbital, especially antibonding orbitals.
Good inclusion of the calculated MOs on to the diagram. It's nice to see that you've tried to consider the differences between the MOs but the LCAO showing the individual AOs is more a component of their construction and not a real difference. You had the right ideas but weren't clear enough in highlighting that it is the relative contributions of the AOs (consider 3a1', for example) which differ between the calculated and LCAO MOs. Smf115 (talk) 07:06, 30 May 2019 (BST)
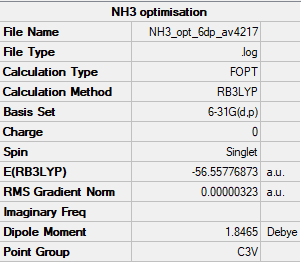
NH3 Molecule
Item               Value     Threshold  Converged?
 Maximum Force            0.000006     0.000450     YES
 RMS     Force            0.000004     0.000300     YES
 Maximum Displacement     0.000012     0.001800     YES
 RMS     Displacement     0.000008     0.001200     YES
 Predicted change in Energy=-9.844605D-11
 Optimization completed.
    -- Stationary point found.
 Low frequencies ---   -8.5646   -8.5588   -0.0044    0.0454    0.1784   26.4183
 Low frequencies --- 1089.7603 1694.1865 1694.1865
Ammonia Molecule |
NH3BH3 Molecule
         Item               Value     Threshold  Converged?
 Maximum Force            0.000122     0.000450     YES
 RMS     Force            0.000058     0.000300     YES
 Maximum Displacement     0.000540     0.001800     YES
 RMS     Displacement     0.000297     0.001200     YES
 Predicted change in Energy=-1.663823D-07
 Optimization completed.
    -- Stationary point found.
Low frequencies ---   -0.0014   -0.0010   -0.0010   12.5258   18.8909   42.6127
 Low frequencies ---  266.2536  632.2667  638.9708
BH3NH3 Molecule |
Bond Energy
E(NH3)=-26.61532 Hartrees
E(BH3)=-56.55777 Hartrees
E(NH3BH3)=-83.22468 Hartrees
-83.22468 + 26.61532 + 56.55777 = -0.05159 Hartrees
-135.5 kJmol-1
This is a relatively weak bond compare to other covalent bonds, such as a H-H bond which is around 436 kJmol-1 [2]. Even very weak bonds such as C-I has a higher bond energy and these bonds react readily.
Correct calculation but consider the accuracy of your final reported energy value. Well referenced literature value for the H-H bond in your comparison, just make sure that if you then mention another bond (i.e C-I) it would have been good to include the corresponding bond dissociation energy for this one too. Smf115 (talk) 07:01, 30 May 2019 (BST)
Day 1: New
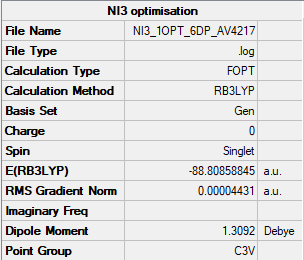
NI3
         Item               Value     Threshold  Converged?
 Maximum Force            0.000102     0.000450     YES
 RMS     Force            0.000075     0.000300     YES
 Maximum Displacement     0.000667     0.001800     YES
 RMS     Displacement     0.000490     0.001200     YES
 Predicted change in Energy=-9.239334D-08
 Optimization completed.
    -- Stationary point found.
 Low frequencies ---  -12.3847  -12.3783   -5.6131   -0.0040    0.0194    0.0711
 Low frequencies ---  100.9307  100.9314  147.2333
NI3 Molecule |
The optimal bond distance of N-I is 2.184 a.u
Day 2 and 3: Lewis Acids and Bases
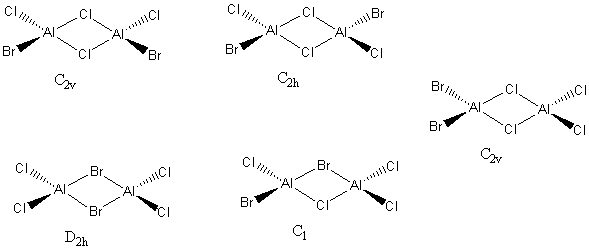
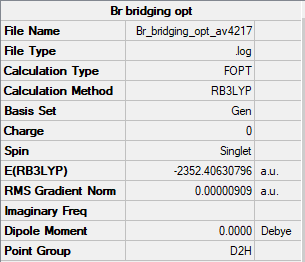
2 Bridging Br ions
         Item               Value     Threshold  Converged?
 Maximum Force            0.000003     0.000450     YES
 RMS     Force            0.000001     0.000300     YES
 Maximum Displacement     0.000040     0.001800     YES
 RMS     Displacement     0.000015     0.001200     YES
 Predicted change in Energy=-2.937162D-10
 Optimization completed.
    -- Stationary point found.
File:BR BRIDGING FREQ1 AV4217.LOG
 Low frequencies ---   -5.2784   -5.2119   -3.0962    0.0043    0.0044    0.0049
 Low frequencies ---   14.7649   63.2302   86.0517
Al2Br2Cl4 Molecule |
Energy of isomer = -2352.40631 Hartrees = -6176243.2 kJ/mol
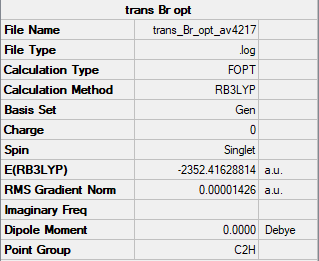
Trans terminal Br ions
         Item               Value     Threshold  Converged?
 Maximum Force            0.000029     0.000450     YES
 RMS     Force            0.000012     0.000300     YES
 Maximum Displacement     0.000211     0.001800     YES
 RMS     Displacement     0.000080     0.001200     YES
 Predicted change in Energy=-1.286645D-08
 Optimization completed.
    -- Stationary point found.
Low frequencies ---   -4.0892   -2.4307    0.0033    0.0037    0.0038    0.9105
 Low frequencies ---   17.7328   48.9885   72.9546
Al2Br2Cl4 Molecule |
The energy of the isomer = -2352.41629 Hartrees = -6176269.4 kJ/mol
Relative Energies
ΔE = -2352.412629 - -2352.40631 = 0.006319 Hartrees = 16.6 kJ/mol
The isomer with chlorine as the bridging atom has a slightly lower energy indicating the isomer is more stable. This could be due to the chlorine being the bridging atom as it is in the same period as aluminium. Therefore, there is a larger orbital overlap and electron density isn't as diffuse as with bromine atoms. The electron density is shared better over the 3 centres and the bonds are shorter. Meaning the bond is stronger and the isomer is more stable.
Good justification of your result and you have obviously considered it. However, you've made a mistake in the energy of the C2h isomer (should be-2352.416228814...) resulting in the wrong relative energy. Also, consider the accuracy of the energy values used, full values should be used for calculations and final reported energies should be left to the correct accuracy. Smf115 (talk) 22:31, 30 May 2019 (BST)
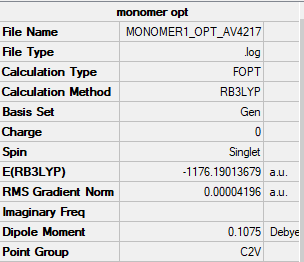
AlCl2Br Molecule
B3LYP/6-31G(d.p)LANL2DZ level
         Item               Value     Threshold  Converged?
 Maximum Force            0.000136     0.000450     YES
 RMS     Force            0.000073     0.000300     YES
 Maximum Displacement     0.000681     0.001800     YES
 RMS     Displacement     0.000497     0.001200     YES
 Predicted change in Energy=-7.984447D-08
 Optimization completed.
    -- Stationary point found.
Low frequencies ---   -0.0033   -0.0015    0.0032    1.3569    3.6367    4.2604
 Low frequencies ---  120.5042  133.9178  185.8950
Al2Br2Cl4 Molecule |
Dissociation Energy
E(AlCl2Br) = -1176.19014 Hartrees
E(Al2Cl4Br2) = -2352.41629 Hartrees
Dissociation Energy = 2(-1176.19014) - -2352.41629 = 0.03601 Hartrees = 94.5 kJ/mol
The reaction is endothermic suggesting the dimer is more stable, as its at a lower energy.
Molecular Orbitals
Real MOs and LCAOs of three molecular orbitals of the trans isomer (lowest energy)

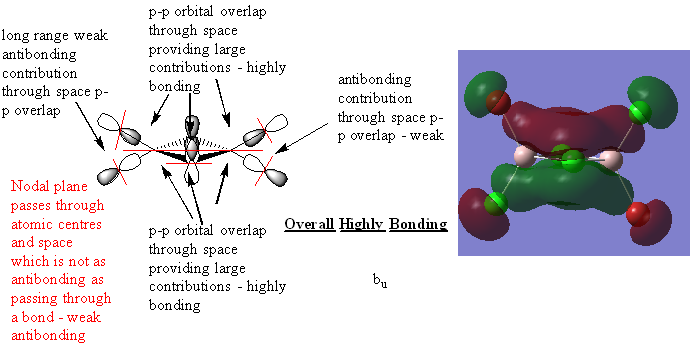
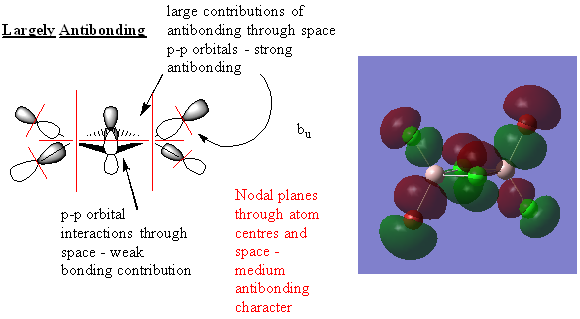
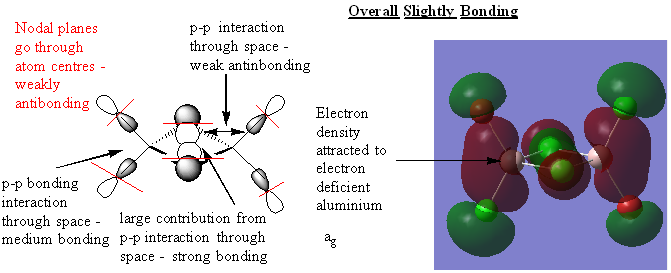
Great analysis of the MOs, your LCAOs are all correct and you've clearly annotated the key interactions and justified the overall character of the MOs. Slight improvements would have been to include the number of the MO that you looked at and consider describing the overlaps as σ and π interactions where appropriate. Smf115 (talk) 22:40, 30 May 2019 (BST)
A very good report with a good project section. Smf115 (talk) 22:40, 30 May 2019 (BST)
References
- ↑ http://www.huntresearchgroup.org.uk/teaching/teaching_comp_lab_year2a/Tut_MO_diagram_BH3.pdf - accessed 17/05/2019
- ↑ https://calculla.com/bond_energy - accessed 17/05/2019

