Inorganic:HughLaurie
Molecular modelling using Gaussview
Optimisation of Borane
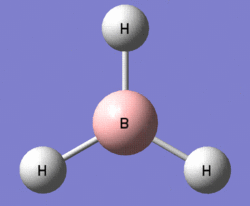
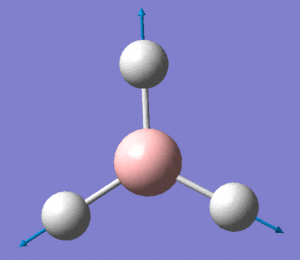
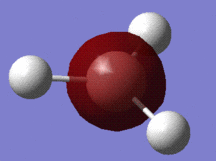
A molecule of borane (of molecular formula BH3) was modelled in Gaussview, and the B-H bonds were all adjusted to a length of 1.50 Ångströms. Having altered the bond lengths thus, the molecule was subjected to a Gaussian optimisation calculation, using the B3LYP method, with the basis set 3-21G, in order to find the most energetically favourable arrangement of borane. In its optimised form, shown to the right, the bond lengths were all found to be equal at 1.193Å, and likewise, the bond angles - perhaps predictably - were all equal at 120°.
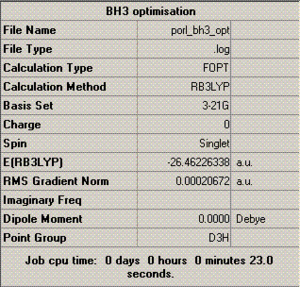
To the left is a table summarising various information relating to the optimisation process, most of which requires no further comment (the charge and dipole moment of this molecule, for example, are obviously 0), but what is of particular note here is the 'RMS gradient norm' value. This gradient represents the accuracy of the optimisation - if this value is close to zero, then it suggests that the optimisation was successful, and, as the value given in this case is 0.0002, it appears that it was (this is further confirmed by a brief inspection of the text based file documenting the optimisation, in which it is shown that all force and displacement values involved in the calculation process converged).
Also of interest in this table is that it gives the energy in atomic units (-26.5), and the point group of the molecule (D3H), which can be useful data in analysis.
Additionally, the summary table gives the time taken to complete the optimisation, which here is 23.0 seconds - scarcely any time at all, hence the fact that the procedure could be conducted on a laptop.
Molecular Orbital analysis of Borane
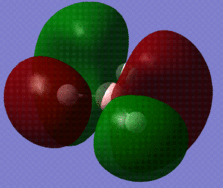
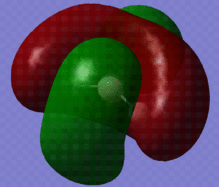
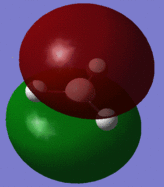
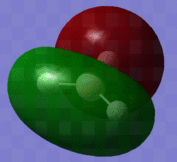
The optimised BH3 molecule now underwent a population analysis, using a Gaussian energy calculation, with the basis set 3-21G and additional keywords 'pop=full'. After this calculation was made, the molecular orbitals of the molecule could now be mapped and visualised in Gaussview. Eight of these orbitals can be seen below, in descending order of energy, with the first row of four being unoccupied, and the second four being occupied.
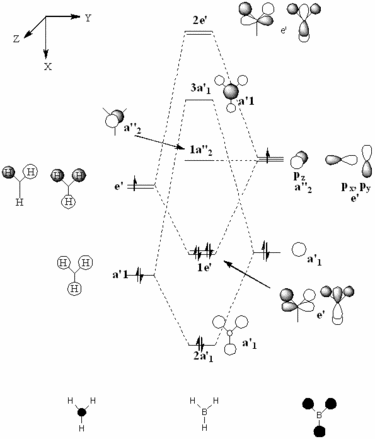
The molecular orbital diagram for borane is seen to the right, with all MOs illustrated. Comparing these simplistic representations of the overlapping orbitals to the calculated Gaussview models shown below, it is apparent that there is a very strong correspondence between the two.
Molecular orbital 1 simply represents the 1S atomic orbital of boron, which is not depicted to the right, as only the valence orbitals are shown. There is no significant overlap between this orbital and the hydrogen orbitals, and so there is no real need to show it in an MO diagram.
MO2 is obviously the 2a'1 orbital.
MOs 3 and 4 depict the 1e' orbitals shown to the left and right respectively in the diagram.
MO 5 clearly corresponds to the a' '2 orbital
MO 7 is very similar to the 2e' orbital on the left as seen in the diagram.
A certain amount of confusion arises, however, when examining MOs 6 and 8. It is obvious, purely in terms of energy, that these orbitals must correspond to the 3a'1 and 2e' (right) orbitals respectively, but this is not immediately apparent simply from a comparison of the calculated and LCAO MOs. This indicates that the higher in energy you look, the more complex the orbitals become, and hence, the less accurate and reliable a qualitative MO theory becomes. For lower energy, occupied orbitals on the other hand, it can be conclusively said from the evidence here that the method suffices.
The text based log file of the population analysis can be seen here - https://www.ch.ic.ac.uk/wiki/images/a/a6/PAULM_BH3_POP.LOG
 |
 |
 |
 |
 |
 |
 |
 |
Vibrational analysis of BH3
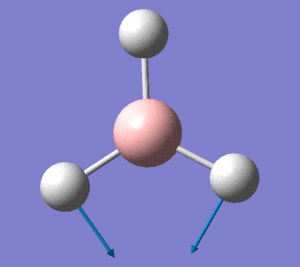
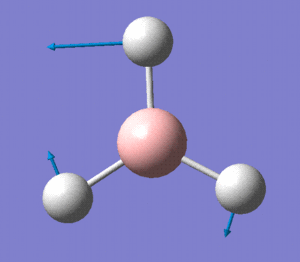
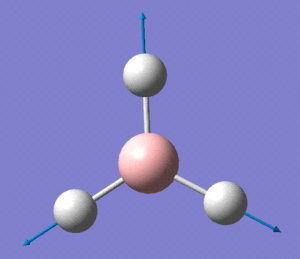
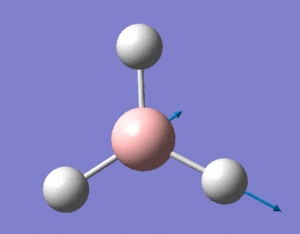
With the optimised borane molecule, a vibrational analysis was now conducted. The job type of the Gaussian calculation was set to 'frequency', and the additional keywords "pop=(full,nbo)" were used to obtain an analysis of the electron density and molecular orbitals of the molecule. The results of this calculation demonstrated it to be adequate - the energy of the molecule was exactly the same as that of the optimised form to eight decimal places, and in the log file (https://www.ch.ic.ac.uk/wiki/images/7/78/PAULM_BH3_FREQ.LOG), the low frequency values were sufficiently low for the level of accuracy expected from such a low level calculation.
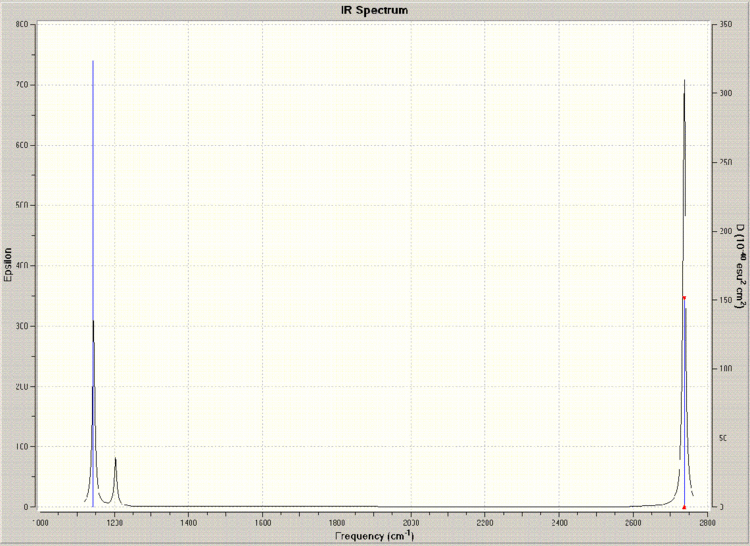
A table depicting the various vibrations of the molecule gleaned from the frequency calculation is shown below, along with the corresponding IR spectrum.
BCl3 Optimisation
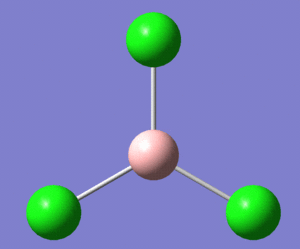
A similar Gaussian optimisation was now carried out on a molecule of boron trichloride, or BCl3, with the point group symmetry of the molecule very tightly restricted, and this time using the LanL2MB basis set, in order to approximately account for the non-valence electrons of the second row chlorine atoms. The calculation here took 15 seconds.
The optimisation process was animated, and it was noted that, in the first few steps, there did not appear to be any bonds at all. This is not in fact the case, it is simply that the Gaussview program doesn't draw them explicitly if the distance between the two atoms exceeds a certain value. It is useful, in this case, to think of a chemical bond as merely an attractive interaction between two atoms, rather than - as most models might lead one to believe - some sort of rigid stick holding them together.
After being optimised, the B-Cl bond lengths were all found to be exactly equal, at 1.87Å, and the bond angles were all 120°. This is in approximate agreement with the data obtained from the literature, in which the B-Cl bond length was found to be 1.75Å.
Next, a frequency analysis was conducted on the optimised molecule, in order to determine that the optimised structure was in fact a minima - results revealed that it was.
Cis and trans isomerism in organometallic complexes
Optimisation
 |
 |
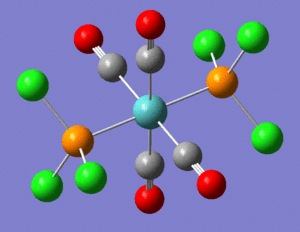
An investigation was now conducted into the properties of the cis and trans isomers of the complex Mo(CO)4(PCl3)2. The reason behind the choice of the PCl3 ligand, rather than the more commercially available complex with the ligand PPh3, is that the phenyl groups would serve to overcomplicate any calculations made. Due to the relative complexity of the molecule (at least in comparison with the simple molecules of borane and BCl3 in part one) these two isomers both underwent a preliminary process of 'loose' optimisation (using basis set LANL2MB, and keyword "opt=loose"), meaning a less accurate but less time-consuming calculation. After this optimisation was completed, the P-Cl bonds all seemed to have disappeared - the bonds are still present, and bond angles and distances can be easily obtained, but the lengths obviously exceed the values in the Gaussview program, and have thus not been drawn, so this is not an issue.
The loosely optimised molecules were now adjusted - the trans so that both PCl3 groups were eclipsed and one Cl was parallel to an axial bond, and the cis so that one PCl3 group had a Cl pointing down parallel to the axial bond, and the other had one pointing down. These molecules were now subject to a further optimisation, using the B3LYP method, the LANL2DZ basis set, and the additional keywords "int=ultrafine scf=conver=9", in place of "opt=loose", which increased the accuracy and convergence of the calculations.
In terms of energy, both isomers proved to be almost identical, at around -623.6 atomic units, so it can be said that neither isomer is more stable than the other. The only substantial difference between the two sets of summary data, is the dipole moments of the molecules - the trans isomer has a moment of 1.31 Debyes, while the cis isomer had a moment of 0.30 Debyes.
Frequency Analysis
The two optimised forms now underwent a frequency analysis, in order to obtain their IR vibrational data. All vibrations were positive, so it can be concluded that the frequency calculations were successful. The IR spectra obtained from the frequency analyses are shown below:
 |
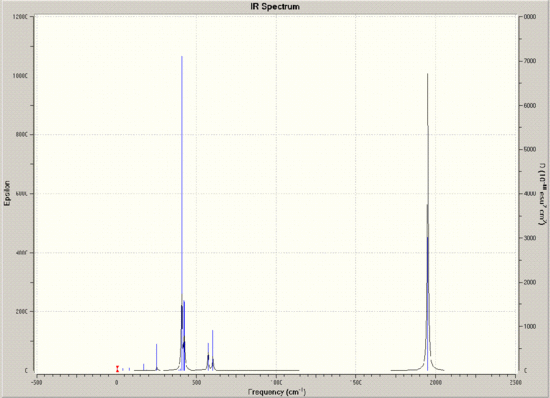 |
Of particular interest in these spectra is the C=O region, around 2000cm-1. Looking at the arrangements of the molecules, it should be expected that all CO bonds in the trans isomer would be equivalent, and that all four in the cis isomer would be different, however, looking closely at the vibrational data, it appears that there are four peaks in this region for each. It is worth noting though, that two of the trans peaks are of minimal intensity, and that the other two are so close together in both frequency and intensity that it appears there is only one peak. Indeed, by animating the vibrations, it seems that these two should be identical.
| Frequency | Intensity |
|---|---|
| 1945.3 | 762.6 |
| 1948.7 | 1498.7 |
| 1958.37 | 633.0 |
| 2023.3 | 597.6 |
| Frequency | Intensity |
|---|---|
| 1950.28 | 1475.4 |
| 1948.7 | 1466.8 |
| 1958.37 | 0.7 |
| 2023.3 | 3.8 |


