Inorganic:Alexandra
Analysis of Boron based compounds: BH3 and BCl3
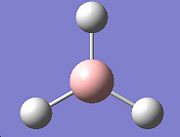
To gain an understanding of how the GAUSSIAN software can be used to investigate molecules, some simple analysis was performed on the BH3 and the BCl3 molecules. The BH3 molecule was drawn in Gausview and then optimised using the DFT B3LYP method and the 3-21G basis set. The total energy of the molecule was found to be -26.4623578 AU. From the output produced by the optimisation the bond lengths and bond angles can be calculated and plots can be produced showing the change in energy of the molecule as the calculation progressed.
Molecular Orbital Calculations
GAUSSIAN can perform Molecular Orbital calculations and generate representations of what the molecular orbitals of certain molecules may look like depending on the level on analysis which was used. There are various levels of calculations which can be performed those with the highest level of accuracy requiring more computational 'power' and being more costly and those with a lower level of accuracy being cheaper and requiring less computational 'power'. Often a compromise must be determined between accuracy and time/cost the calculation will require.
An MO calculation was performed on BH3. This calculation used a DFT B3LYP method with a 3-21G basis set. This method is a medium level method however the basis set used is not of a high level of accuracy. In this case it will not be too detremental to the results as the molecule being modelled is simple and therefore the calculation can be fast. The unoccupied molecular orbtials calculated in this analysis looked unusual, particularly the LUMO+1. The unusual nature of these orbitals is one reason why in a MO analysis they are rarely looked at. MO calculation log file

The linear combination of atomic orbitals approach is useful in terms of providing a quick approximation of molecular orbitals, as it can be done without a computer. In terms of accuracy the LCAO approach should not be used to draw accurate conclusions about a molecules' orbitals. The 'real' MOs which have been computed are more accurate than the LCAO produced MOs, however as a low-medium level basis set was used to run the calculations the results will not be as accurate as they could be. The MOs produced by the LCAO approach are considerably different from the 'real' MOs. The LCAO MOs are restricted to specific bonds whereas the 'real' MOs have deloacalised electron density across the molecule.
NBO and Vibrational Analysis
Next a natural bond order analysis was performed on BH3 from this it was determined that the charge on the hydrogen atoms was -0.04 and the charge on the boron atom was found to be 0.13. The NBO analysis is useful for determining information about the molecules molecular orbitals, ie. their occupancy, orbital coefficients and hybridisation.
      (Occupancy)   Bond orbital/ Coefficients/ Hybrids
---------------------------------------------------------------------------------
    1. (1.99851) BD ( 1) B   1 - H   2
               ( 44.49%)   0.6670* B   1 s( 33.33%)p 2.00( 66.67%)
                                           0.0000  0.5774  0.0000  0.0000  0.0000
                                           0.8165  0.0000  0.0000  0.0000
               ( 55.51%)   0.7451* H   2 s(100.00%)
                                           1.0000  0.0000
    2. (1.99851) BD ( 1) B   1 - H   3
               ( 44.49%)   0.6670* B   1 s( 33.33%)p 2.00( 66.67%)
                                           0.0000  0.5774  0.0000  0.7071  0.0000
                                          -0.4082  0.0000  0.0000  0.0000
               ( 55.51%)   0.7451* H   3 s(100.00%)
                                           1.0000  0.0000
    3. (1.99851) BD ( 1) B   1 - H   4
               ( 44.49%)   0.6670* B   1 s( 33.33%)p 2.00( 66.67%)
                                           0.0000  0.5774  0.0000 -0.7071  0.0000
                                          -0.4082  0.0000  0.0000  0.0000
               ( 55.51%)   0.7451* H   4 s(100.00%)
                                           1.0000  0.0000
    4. (1.99904) CR ( 1) B   1           s(100.00%)
                                           1.0000  0.0000  0.0000  0.0000  0.0000
                                           0.0000  0.0000  0.0000  0.0000
    5. (0.00000) LP*( 1) B   1           s(100.00%)
From this table the four occupied molecular orbitals for the BH3 are represented by numbers 1-4. The first 3 orbitals are bonding orbitals between the B and H atoms, the fourth occupied molecular orbital, the HOMO, contains the lone pair and is non-bonding.
Natural Bond Orbitals (Summary):

                                                 Principal Delocalizations
NBO                        Occupancy    Energy   (geminal,vicinal,remote)
========================================================================
Molecular unit  1  (H3B)
    1. BD (   1) B   1 - H   2          1.99851    -0.43694
    2. BD (   1) B   1 - H   3          1.99851    -0.43694
    3. BD (   1) B   1 - H   4          1.99851    -0.43694
    4. CR (   1) B   1                  1.99904    -6.64523  10(v),11(v),12(v)
    5. LP*(   1) B   1                  0.00000     0.67706
    6. RY*(   1) B   1                  0.00000     0.37188
    7. RY*(   2) B   1                  0.00000     0.37188
    8. RY*(   3) B   1                  0.00000    -0.04547
    9. RY*(   4) B   1                  0.00000     0.43447
   10. RY*(   1) H   2                  0.00032     0.90035
   11. RY*(   1) H   3                  0.00032     0.90035
   12. RY*(   1) H   4                  0.00032     0.90035
   13. BD*(   1) B   1 - H   2          0.00149     0.41070
   14. BD*(   1) B   1 - H   3          0.00149     0.41070
   15. BD*(   1) B   1 - H   4          0.00149     0.41070
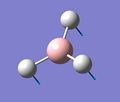
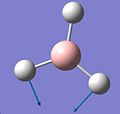
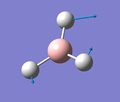
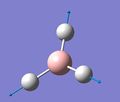
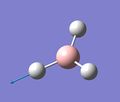
Vibrational analysis was then performed on the BH3 molecule, the total energy of the molecule was found to be -26.46226338AU. This is a good fit with the energy determined by the optimisation. From the vibrational analysis it is possible to find the different modes of vibration within the molecule and hence determine the symmetry of each vibration. Although there are 6 distinct vibrations, there are less than 6 peaks in the IR spectrum of the molecule. This is because two of the vibrations frequencies are doubly degenerate. Therefore where it would be expected to see 6 peaks, there are only 4 shown on the IR spectrum.

BCl3 calculations
To make any calculations more accurate the point group symmetry of the BCl3 molecule was constrained to the D3h point group and the tolerence set to 0.0001 (very tight). An optimisation calculation was run using a DFT B3LYP method, the LanL2MB basis set was used. This medium level basis set uses the D95V basis set on the first row atoms in the periodic table and the Los Alamos ECP pseudo potentials on heavier elements. This same method and basis set will be used for all calculations as otherwise the molecule will not have been optimised to the level of all other calculations resulting in a high level of inaccuracies. The optimised BCl3 molecule was found to have B-Cl bond lengths of 1.87ű0.01Å and bond angles of 120°±0.1°.

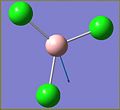
When viewing optimised structures it is possible to view the intermediate geometries of the molecule. There can be several intermediate geometries of any molecule. In some of these it can be found that GAUSSIAN does not draw bonds in where they would be expected. This happens because GAUSSIAN has some values, in this case bond lengths, which are 'pre-programmed' into it, and it uses these values to determine whether it should have bonds drawn within a structures or not. In the intermediate where bonds haven't been drawn in, the distances between the atoms are simply larger than the 'pre-programmed' bond lengths.
This poses an interesting question. What is a bond? In 1916 G.N. Lewis defined the covalent bond as '..an electron pair shared between two neighbouring atoms...'. Lewis' description only applies for the quantum mechanical description of a covalent bond. A broader description of the nature of the chemical bond is presented in Atkins' Physical Chemistry as '...the interplay between the attraction of opposite charges, the repulsion of like charges, and the effect of changing kinetic energy as the electrons are confined to various regions when bonds form.' 1
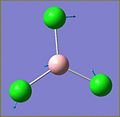
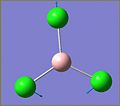
Once a molecule has been fully optimised it is necessary to perform a frequency analysis on it, aside from being incredibly useful as it predicts IR and Raman spectroscopy data a frequency analysis is a good way to check to see if the optimisation has worked. This can be done by looking at the frequencies predicted by the calculation and if there is more than one negative vibration frequency then the optimisation of the molecule has not worked.
From the frequency analysis there were 6 vibrational modes found
As there are no negative vibrational frequencies this confirms that the molecule does indeed have an energy minimum and therefore the optimisation calculations have worked.

As the symmetry of the molecule was confined to the D3h point group, this is the symmetry that would be expected for the ground state molecule. This was the symmetry found to be used by GAUSSIAN to model the molecule. The calculations were all performed in under 10 seconds, the typical time taken for a frequency calculation was 9 seconds. optimisation calculations occured in 6 seconds.
1. Atkins.P, De Paula.J, Atkins' Physical Chemistry, 8th edition, Chapter 11, p362
Accuracy and Errors
All of the values calculated will have errors associated with them due to inaccuracies within the various emthods used. For energies there will be a error associated of ~10kJ(2.29e+21 Hartree). All frequencies calculated have a 10% error, although the larger vibrations have greater errors associated with them potentially up to 300cm-1. This is a large error margin and should be kept in mind when comparing values. Bond distances are accurate to ~0.01Å and bond angles to ~0.1°.
Isomers of Mo(CO)4(PCl3)2
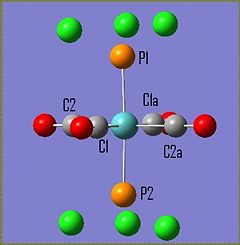
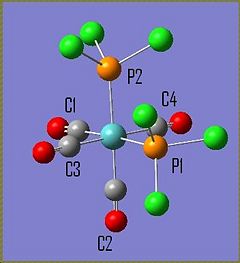
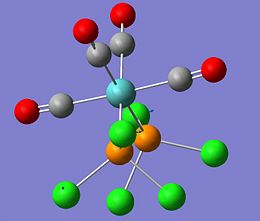
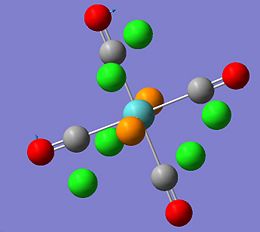
The molecule Mo(CO)4L2 (where L=PPh3) is unusual in the sense that it has different IR spectra for its cis/trans isomers. The amount of active C=O vibrational modes varies depending on the symmetry of the molecule. The cis-Mo(CO)4L2 isomer has the point group symmetry C2v and has all four of its C=O vibrations appearing in its IR spectrum. The trans-Mo(CO)4L2 has the point group symmetry D4h and only has one of its C=O vibrations appearing in its IR spectrum. To investiagte some of the key features of these molecules both isomers were drawn in Gaussian, optimised using the DFT B3LYP method using the basis set LANL2MB, the convergence was set to loose. This initial optimisation was done to optimise the bond lengths and angles. The results of these calculations can be found here D-space cis-Mo LANL2MB optimisation and D-space trans-Mo isomer LANL2MB optimisation
This method does not provide good dihedral angles however, so the torsion angles of the PCl3 substituent in relation to the Mo centre was changed manually. For the cis-isomer the Cl atoms were rearranged so that on one of the ligands there was one chlorine atom up, two down, and on the other ligand the opposite was true. For the trans isomer the PCl3 groups were moved so that they were in the eclipsed conformation.
The geometries of the molecules were then optimised again, this time using a higher level basis set, the DFT B3LYP method was maintained with the LANL2-DZ basis set and pseudopotentials, the higher level of this calculation should lead to it being more accurate than the previous optimisation. For this calculation the electronic converegence was increased. The results of the second optimisation calculations can be found here D-space trans-Mo isomer LANL2-DZ optimisationand D-space cis-Mo LANL2-DZ optimisation. As with all optimisation calculations frequency calculations were then performed on the results from the second optimisations, the data from the frequency calculation can then be compared to literature values. The frequency calculations can be found here Trans isomer frequency calculation LANL2DZ basis set and here Cis isomer frequency calculation LANL2DZ basis set.
Once the frequency calculations had been completed, the values of the bond frequencies were checked to ensure all vibrations were positive frequencies. As this was the case for both isomers a minimum energy conformation has been found for both molecules.
Geometry of Isomers
The bond lengths and bond angles of the fully optimised structures were determined and compared to literature values
Trans Isomer
| Bond types | Calculated bond lengths/ű0.01Š| Literature Values/Š1 |
| Mo-P(1) | 2.45 | 2.5 |
| Mo-C(2) | 2.06 | 2.06 |
| C(1)-O(1) | 1.17 | 1.16 |
In this isomer the Mo-P bond is significantly shorter than the Mo-P bond in the cis isomer. It has been suggested that the trans effect of PPh3 over CO is responsible for this effect.1
Cis Isomer
| Bond types | Calculated bond lengths/ű0.01Š| Literature Values/Š2 |
| Mo-P(1) | 2.51 | 2.58 |
| Mo-C(2) | 2.01 | 1.97 |
| C(1)-O(1) | 1.18 | 1.16 |
The cis isomer has generally longer bond lengths than the trans isomer, this is most likely to minimise electron-electtron repulsions between the ligands, to help keep the molecular energy low.
The calculated bond lengths and literature values are a reasonable fit, more so if the errors associated with the calculated values and the experimental values are taken into account. It is interesting that in both compounds the C-O bond is slightly shorter than the typical C-O (triple) bond, this is most likely due to back-bonding between the d orbitals on the metal and the π-orbitals on the carbon monoxide ligand.
Trans Isomer
| Atoms involved in bond | Calculated bond angle/°±0.1° | Literature Values/°1 |
| P-Mo-P | 178 | 180 |
| Mo-C(2) | 89 | 87.2 |
| C(1)-O(1) | 179 | 180 |
In the trans isomer there is only a slight deviation from the optimum octahedral geometry, with the P-Mo-P bond being 178° instead of 180°. Also the Mo-C bond angles, if the compound was in the ideal octahedral geometry would be expected to be 90°. The deviation from ideality is most likely due to orientation of the PCl3 groups to optimise the molecular energy, and this slight deviation will result in distrotion of the other bond angles within the molecule.
Cis Isomer
| Atoms involved in bond | Calculated bond angle/°±0.1° | Literature Values/°1 |
| P-Mo-P | 94 | 104 |
| Mo-C(2) | 89 | 92 |
| C(1)-O(1) | 178 | 174 |
As with the trans isomer, there is a slight deviation from ideal octahedral geometry. This is most notable in the P-Mo-P bond which is 94° whereas in the optimum geometry this bond would be 90°. This is again most likely due to replusions between the two groups, here as the considerably bulky PCl3 groups are cis to each other steric replusions may play a part in distorting the molecule.
Relative Energies of the two isomers
The energy of the isomers was determined during the frequency calculation with the cis isomer having an energy= -623.5946 Hartree, and the trans isomer having an energy= -623.59617 Hartree. From this it can be seen that the trans isomer is the most thermodynamically stable. This is most likely due to the cis isomer having a higher degree of steric hinderence between the PCl3 groups. In the cis position the chlorine atoms are closer together which results in electron-electron repulsions between the chlorine atoms. These electron-electron repulsions will raise the energy of the isomer. This raise in energy will not be replicated in the trans isomer as the PCl3 groups are on opposite sides of the molecule so there will be no interaction between the groups.
The ΔG between the two isomers was found to be 4.52kJmol-1. This is not a particularly large energy difference, however it is significant. There are many ways in which the PR3 ligand could be modified in order to change the relative energies of the two geometric isomers. The R groups on the phosphine ligands can be changed to reduce their repulsion with the CO ligands, by reducing the steric hinderence and electronic repulsion between the two groups the overall energy of the molecule. The cis isomer in particular would benefit from a change in R groups as if it had less bulky ligands there would be more room for the ligands to orientate themselves in positions which would reduce steric repulsions. Therefore reducing the overall energy of the molecule.
Another way to lower the energy of the molecule would be to make the P-Mo bond longer. A good way to do this would be to make the substituents on the phosphine ligands more electronegative to increase the amount of backbonding which occurs between the metal centre and the phosphorus atom. A trade off would have to be reached between how much the lengthening of the P-Mo bond reduces the energy of the system and how much the electronic repulsions that the more electronegative groups cause raise the energy of the system.
IR spectra of Mo isomers

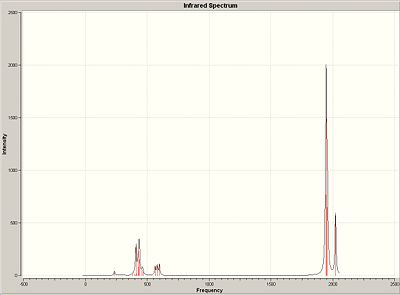
Trans Isomer
| Frequency/cm-1 | Intensity | Literature Values/cm-1 3 |
| 2031 | 4 | 2054 |
| 1977 | 1 | 1985 |
| 1951 | 1468 | 1943 |
| 1950 | 1474 |
Cis Isomer
| Frequency/cm-1 | Intensity | Literature Values/cm-1 3 |
| 2022 | 597 | 2049 |
| 1957 | 649 | 1964 |
| 1947 | 1488 | 1948 |
| 1942 | 770 | 1941 |
For both the trans and cis isomer the literature values reported are from the Mo(CO)4(OC6H5)2 cis and trans isomer. Considering the effects the different R group substituents for the literature values will have on the CO frequencies there is still a fairly close match between the predicted frequencies for the two isomers. Both of the isomers have 4 vibrational frequencies associated with the CO ligands. This does not concur with the experimental results, there should be only one CO vibration appearing in the trans isomer IR spectrum. This is because the other vibrations should be symmetry disallowed as the CO groups are all in the same symmetry environment and therefore cannot have separate vibrations.
The cis isomer has one vibration at the low frequency of 9cm-1 (intensity of 0). In this vibration the PCl3 groups rock back and forth in a concerted motion. Although this vibration has a low frequency at room temperature this vibration will be present.
The trans isomer has two vibrations which occur at low frequencies. One at 2cm-1 (intensity of 0). In this vibration the carbonyls attached to the Mo rock back and forth in a concerted motion and the PCl3 groups rock back and forth in the opposite direction. The second vibration at a low frequency occurs at 5cm-1 (intensity of 0). In this vibration the PCl3 groups rock back and forth in a disconcerted fashion. The intensities of these vibrations are also 0.
 |
 |
 |
1. Hogarth. G, Norman.T, Inorganica Chimica Acta, 254, 1994, 167-171 DOI
2. Cotton. F, Darensbourg. D, Klein. S, Kolthammer. B, Inorg. Chem., 21, (1982), p294-299 DOI
3. M. Y. Darensbourg and D.J. Darensbourg, J. Chem. Ed., 1970, 47, 33
Mini Project: disilabenzene compounds and their germanium derivatives
In 2007 Sekiguchi et al reported the discovery of a new route to the synthesis of 1,2-disilabenzene1. Their synthesis resulted in a mixture of isomers as shown below in the reaction scheme:

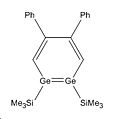
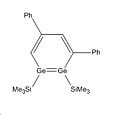
The energy difference between these two isomers will be interesting to investigate to see why regiomer 2 predominates. There could potentially be a third isomeric form of the disilabenzene derivative reported by Sekiguchi et al, although none of this isomer was reported. It is likely that this regiomer (regiomer 3) would have such a high energy that its formation is not thermodynamically favourable.
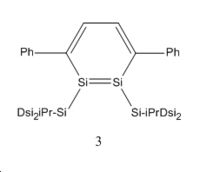
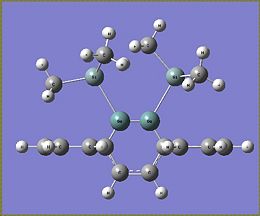
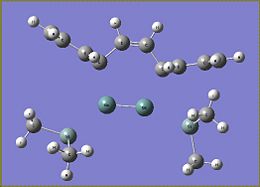
Whilst looking at the compounds it will also be interesting to look at the Germanium analogues of these 3 regiomers to see if they bear any similarities geometrically and energetically. To investigate the geometric and energetic properties of these compounds, it was first necessary to modify the structures being analysed as the computational time required, to model the molecules at they were reported in the journal, would take too long. The SiiPrDsi2 groups were modified to SiMe3 groups as they will take less time to compute and as there are fewer atoms in the substituents. The same side groups were used for the germanium analogues. The compounds were drawn on Gaussview and their structures were then optimised using the DFT B3LYP method and the LANL2MB basis set. This low level basis set is ideal for performing initial optimisations on the geometries of molecules. This initial optimisation was done to adjust the geometry of the compounds so that when the higher level optimisation was performed it did not require too much computational time. The initial calculations are available below: Silicon Isomer 1 LanL2MB , Silicon Isomer 2 LanL2MB, Silicon Isomer 3 LanL2MB, Germanium isomer 1 LanL2MB, Germanium isomer 2 LanL2MB, Germanium isomer 3 LanL2MB
Once the initial optimisation had completed a second optimisation at a higher level basis set was performed on all the molecules. The basis set used was the LanL2DZ basis set, this higher level basis set, used in previous calculations, should provide a higher level of accuracy for optimisation. The results of these calculations can be found here: Silicon Isomer 1 LanL2DZ, Silicon Isomer 2 LanL2DZ , Silicon Isomer 3 LanL2DZ , Germanium Isomer 1 LanL2DZ , Germanium Isomer 2 LanL2DZ , Germanium Isomer 3 LanL2DZ .
To ensure that all optimisations had occured without error and that an energy minimum had been found frequency calculations were run on all of the isomers. The results of the calculations can be found here: Frequency calculation Si Isomer 1 LanL2DZ, Frequency calculation Si isomer 2 LanL2DZ, Frequency calculation Si isomer 3 LanL2DZ, Frequency calculation Ge isomer 1 LanL2DZ, Frequency calculation ge isomer 2 LanL2DZ, Frequency calculation Ge isomer 3 LanL2DZ.
Geometries and Energies of compounds
Silicon Compounds: selected bond lengths
| Bond type | Isomer 1/Å | Isomer 2/Å | Isomer 3/Å | Literature Values/Å1 |
| Si=Si | 2.29 | 2.29 | n/a | 2.2 |
| Si-Si | 2.35 | 2.38 | n/a | 2.38 |
| C-Si | 1.75 | 1.76 | n/a | 1.79 |
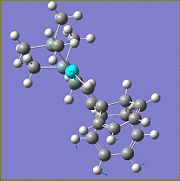
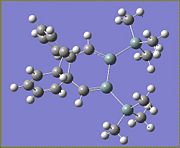
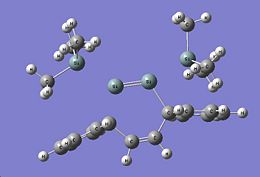
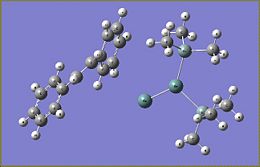
Whilst analysing the log files for the optimisations it was discovered that in isomer 3 something unusual had happened. Two of the methyl substituents on the SiMe3 groups were very close together and due to the resulting steric clashing the molecule underwent coloumbic explosion. This resulted in various fragments of the molecule interacting with each other but not as a whole molecule. For this reason none of the bond lengths can be measured to be compared. The geometry of the molecule was modified to allow the SiMe3 groups less interaction with each other, the optimisation was then repeated with the LanL2MB basis set using the same DFT B3LYP method as before. The calculations with the changed geometry also resulted in the molecule experiencing a coloumbic explosion. The steric hinderence in this molecule appears to be too great for the molecule to exist hence why there was none of it reported in the literature as a by product of the reaction. The calculation for the changed geometry can be found here: Si isomer 3 LanL2MB basis set optimisation of modified geometry
 |
 |
 |
The literature values and the determined values have a good correlation. The Si=Si bond length is inbetween the typical values for a single Si-Si bond and a double Si=Si bond, this is most likely due to the aromatic nature of the disilalene resulting in a shortening of the Si=Si bond length.
Germanium Compounds: selected bond lengths
| Bond type | Isomer 1/Å | Isomer 2/Å | Isomer 3/Å |
| Ge=Ge | 2.62 | 2.77 | n/a |
| Ge-Si | 2.63 | 2.65 | n/a |
| C-Ge | 1.88 | 1.88 | n/a |
No literature values for the bond lengths could be found for these specific compounds, as they have not been synthesised yet. As before with isomer 3 of Si, isomer 3 of Ge underwent coloumbic explosion due to the steric clashing between two of the methyl groups on the SiMe3 groups. The molecule was then modified so the SiMe3 groups were further apart, then the optimisation was re-run using the same DFT B3LYP method and the LanL2MB basis set. The reorganised geometry optimisation calculation also resulted in a coloumbic explosion, like its silicon analogue the high steric hinderance seems to result in the energy of the molecule being too high for it to exist. The calculation can be found here: Ge isomer 3 modified geometry optimisation LanL2MB basis set
 |
 |
 |
Relative Energies of Compounds (not including isomers 3)
| Si Isomer 1 | Si Isomer 2 | Ge Isomer 1 | Ge Isomer 2 | |
| Relative Energy/A.U. | -795.51 | -795.54 | -795.28 | -795.34 |
From the relative energies found here it is apparent that isomer 1 is the most stable for both of the molecules.
1. Kinjo. R, Ichinohe. M, Sekiguchi. A, Takagi. N, Sumimoto. M, Nagase. S, J. Am. Chem. Soc, 2007, 129, 25, pp7766 DOI
Vibrational data
All of the isomers were analysed for vibrational data, it was found that for the isomer 1 and 2 for Si and Ge there were no negative frequencies, therefore an energy minimum can be reached. As isomers 3 for both Si and Ge could not be fully optimised due to the steric hinderence a vibrational calculation could not be performed on these isomers accurately. The vibrations of isomer 1 of the silicon compounds were looked at in detail and the most significant ones reported below. Although Si=Si or Si-Si bond vibrations were looked for none could be found. This could be due to the rigid nature of the aromatic ring making the vibrations very low in energy resulting in the more intense vibrations masking the Si bond vibrations.
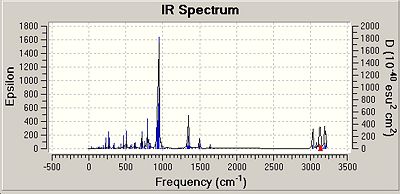
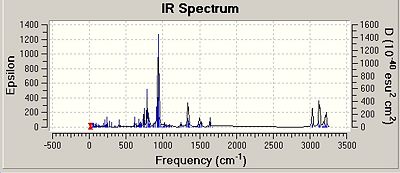
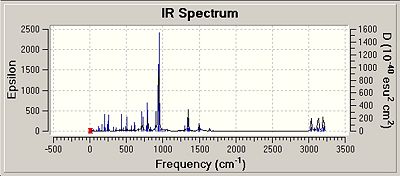
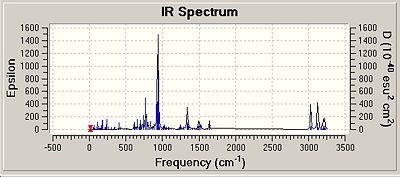
It is interesting that the positioning of the phenyl groups on the disilalene does not seem to affect the vibrational frequencies of the bonds common to both. The most intense vibrations in all of the molecules, including the Ge isomers are from the hydrogens on the SiME2 groups wagging, (Ge isomer 1 freq = 943cm-1 intensity = 368) (Ge isomer 2 freq = 942cm-1 intensity = 354).
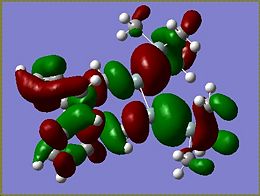
Molecular Orbitals of Si isomer 1
Although calculations were done for isomer 1 and 2 of both the Ge and Si compounds, only the molecular orbitals of Si isomer 1 will be looked at in detail. The calculations performed can be found here: Si isomer 1 MO and NBO analysis LanL2DZ basis set, Si isomer 2 MO and NBO analysis LanL2DZ basis set, Ge isomer 1 MO and NBO analysis LanL2DZ basis set, Ge isomer 2 MO and NBO analysis LanL2DZ basis set.
 |
 |
 |
 |
 |
 |
 |
 |
 |
 |
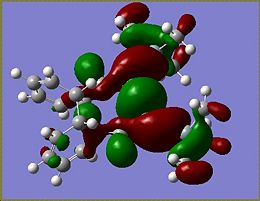
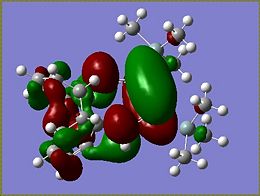
From the MOs determined for the si isomer it becomes apparent that very little of the molecular orbitals are found on the SiMe3 groups. The HOMO of the molecule is the most interesting of the orbitals as it is the HOMO that determines what occurs during addition to the molecule. The HOMO of the Si isomer is mostly located around the Si=Si of the disilalene. The highest energy electrons lie in the HOMO, therefore if an electrophilic addition reaction were to occur it would be reasonable to suggest that an electrophile would attack around the Si=Si bond.
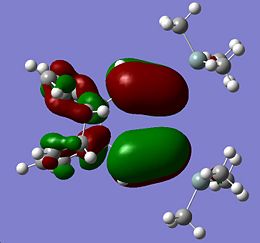
The HOMOs of the other isomers are shown below:
 |
 |
 |
 |
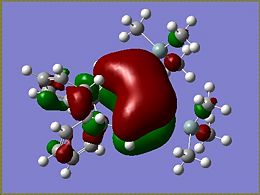
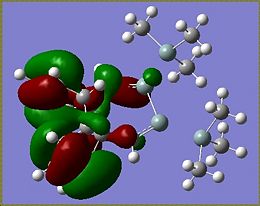
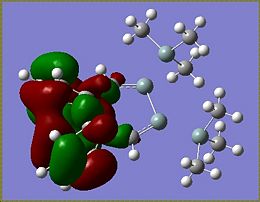
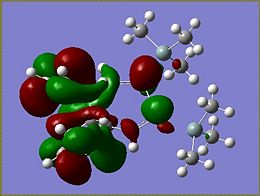
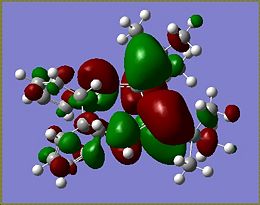
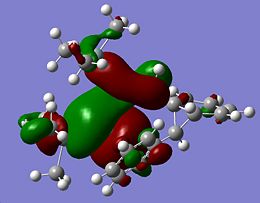
The HOMOs for Si isomer 1 and Ge isomer 1 are incredibly similar. This is not surprising as the only difference in these molecules is in the Ge isomer there is a Ge=Ge bond where a Si=Si bond should be. The Ge isomer 2 and the Si isomer 2 are also incredibly similar and have their HOMO more spread across the molecule than the Ge/Si isomer 1. This suggests that the closer proximity of one of the phenyl groups affects the electron density of the molecule causing it to be more spread out across the Si=Si/Ge=Ge bond onto the Si-Si/Ge-Si bond and the methyl groups fround on the Si atom. The more diffuse nature of the HOMO in these molecules makes it harder to predict where an electrophile would attack. From the similarity of the HOMOs for each type of isomer, it seems likely that if the HOMO could be determined for isomers 3 that for the Ge and Si isomers the HOMOs would look very similar.
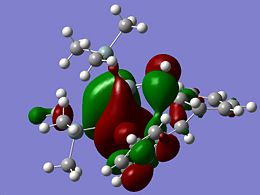
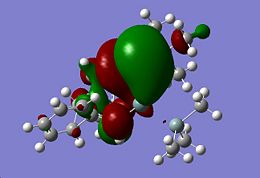
As a point of interest the LUMOs of these molecules are included below
 |
 |
 |
 |
NBO Analysis of Si isomer 1
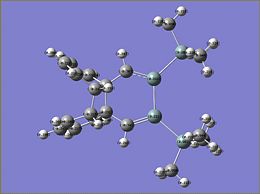
The charge analysis of si isomer 1 is very interesting as considering the molecule is symmetrical the charge distribution is not. One of the Si atoms in the Si=Si has a charge 0.216 yet the other Si atom has the charge 0.221. Also all the hydrogen atoms on the SiM33 groups have different charge distributions despite all the Si in the SiMe3 groups having a charge of 0.966 and the carbon atoms of the methyl groups all having the same charge of -0.94. The charge on the hydrogen atoms varies within the range of 0.2-0.23. This suggests that the charge distribution on the hydrogen atoms is determined on their proximity to other atoms within the molecule.
The natural bond analysis is useful for looking at occupancy of orbitals and determining atoms hybridisations. The natural bond analysis done on this molecule can be used to look at various bonds ie. the Si=Si to determine whether it is actually a double bond. This can be used to investigate some of the more unusual bond lengths determined. The bonds to be analysed are the bonds for which the bond lengths were looked at.

Natural Bond Orbitals (Summary):
                                                           Principal Delocalizations
          NBO                        Occupancy    Energy   (geminal,vicinal,remote)
====================================================================================
    3. BD (   2) C   1 -Si   6          1.90646    -0.20483  216(v),246(v),245(v),225(v)
                                                   224(v),249(r),153(v)
    6. BD (   1) C   2 -Si   5          1.97737    -0.51961  181(v),260(v),220(v),217(g)
                                                   261(v),183(v),97(g),214(g)
                                                   109(r)
    9. BD (   1)Si   5 -Si   6          1.96296    -0.37050  214(v),210(v),220(g),219(g)
                                                   211(g),84(v),215(g),221(v)
                                                   88(v),226(v),101(g),97(g)
                                                   105(v),109(v),93(r),92(r)
   10. BD (   1)Si   5 -Si   7          1.94800    -0.36238  217(v),221(g),222(g),223(g)
                                                   105(g),234(v),230(v),227(v)
                                                   218(g),88(v),211(v),124(v)
                                                   117(v),219(g),101(v),110(v)
                                                   94(g),214(v)
   11. BD (   1)Si   6 -Si   8          1.94805    -0.36226  213(v),226(g),224(g),225(g)
                                                   109(g),238(v),241(v),243(v)
                                                   218(g),215(v),84(v),131(v)
                                                   138(v),220(g),97(v),145(v)
                                                   98(g),210(v)
From the summary of the NBO analysis the bond orbitals to be investigated were found, below is a table from the analysis with more information about the bonding orbitals which are being focussed in on.
      (Occupancy)   Bond orbital/ Coefficients/ Hybrids
---------------------------------------------------------------------------------
    3. (1.90646) BD ( 2) C   1 -Si   6
               ( 57.07%)   0.7554* C   1 s(  0.03%)p99.99( 99.97%)
                                          -0.0001  0.0181  0.0004  0.0342 -0.0008
                                          -0.0009  0.0030  0.9991 -0.0151
               ( 42.93%)   0.6552*Si   6 s(  0.02%)p99.99( 99.98%)
                                           0.0151  0.0016 -0.0247 -0.0006  0.0272
                                           0.0015  0.9992 -0.0085
    6. (1.97737) BD ( 1) C   2 -Si   5
               ( 71.12%)   0.8433* C   2 s( 38.65%)p 1.59( 61.35%)
                                           0.0000  0.6216 -0.0113  0.7421 -0.0128
                                           0.2459 -0.0290  0.0350  0.0007
               ( 28.88%)   0.5374*Si   5 s( 33.51%)p 1.98( 66.49%)
                                           0.5771  0.0453 -0.7673 -0.0383 -0.2688
                                          -0.0341 -0.0360 -0.0007
    9. (1.96296) BD ( 1)Si   5 -Si   6
               ( 50.10%)   0.7078*Si   5 s( 30.81%)p 2.25( 69.19%)
                                           0.5550 -0.0100  0.1300  0.0181  0.8207
                                           0.0005 -0.0342  0.0003
               ( 49.90%)   0.7064*Si   6 s( 30.66%)p 2.26( 69.34%)
                                           0.5536 -0.0098  0.1608  0.0180 -0.8166
                                           0.0000  0.0178 -0.0007
   10. (1.94800) BD ( 1)Si   5 -Si   7
               ( 55.84%)   0.7472*Si   5 s( 35.84%)p 1.79( 64.16%)
                                           0.5985 -0.0106  0.6205 -0.0118 -0.4995
                                           0.0186  0.0812 -0.0017
               ( 44.16%)   0.6645*Si   7 s( 21.93%)p 3.56( 78.07%)
                                           0.4678 -0.0196 -0.6505  0.0233  0.5908
                                          -0.0195 -0.0874  0.0024
   11. (1.94805) BD ( 1)Si   6 -Si   8
               ( 55.83%)   0.7472*Si   6 s( 35.85%)p 1.79( 64.15%)
                                           0.5986 -0.0104  0.6048 -0.0111  0.5246
                                          -0.0187 -0.0083  0.0004
               ( 44.17%)   0.6646*Si   8 s( 21.91%)p 3.57( 78.09%)
                                           0.4676 -0.0194 -0.6310  0.0225 -0.6179
                                           0.0205  0.0071 -0.0007
C-Si bonds
Number 3 and 6 deal with C-Si bonds. Number 3 looks at the C(1)-Si(6) bond in the disilalene. The C and Si atoms have 99.9% p-hybridisation, with the majority of the electron density being on the C atom (57%), the bonding orbital has 1.90 electrons in it. Number 6 looks at the other C(2)-Si(5) bond within the disilalene. This bond is considerably different from the bond looked at in number 3. Bonding orbital 6 has both Si and C atoms 39%s-hybridised and 61%p-hybridised with the majority of the electron density being on the C atom (71%), the orbital has 1.97 electrons present in it. The high π-character of one of these bonds explains why the average C-Si bond length is short.
Si=Si bond
Bonding orbital 9 is for the Si=Si bond. Both Silicons have has 69%p-hybridisation and 31%s-hybridisation which leads to a mostly pi-bond. This accounts for the calculated bond length being inbetween a Si=Si and Si-Si bond length. Si(5)has 50.1% of the electron density with Si(6) having 49.9%. The bonding orbital has 1.96 electrons present in it.
Si-Si bonds
Bonding orbital 10 looks at Si(5)-Si(7). Si(5) is 36% s-hybridised and 64%p-hybridised, with Si(7) 22% s-hybridised 78% p-hybridised. 56% of the electron density is on Si(5) with 1.95 electrons in the bonding orbital. Bonding orbital 11 looks at Si(6)-Si(8). Si(6) is 36% s-hybridised and 64% p-hybridised, with Si(8) 22% s-hybridised and 78%p-hybridised. 56% of the electron density is on the Si(6) atom with the bonding orbital having 1.95 electrons in it.
Both of the Si atoms in the disilalene ring have the majority of the electron density on them which concurs with the electron density distribution predicted by the MO calculations.
Conclusions
The findings of this mini-project ahve been summarised below:
- The theorised isomeric form 3, cannot exist due to high steric repulsions between the methyl groups on the SiMe3 substituents. To form a compound with a form similar to this it would be necessary to make the substituent groups on the Si atoms small enough to reduce destabilising steric effects.
- The disilalene ring in the molecule has aromatic character, this is shown by the Si=Si being shorter than standard values but longer than reported Si-Si bond lengths. Also the hybridisation of the atoms within the ring suggests a high degree of π-character in the bonding within the ring.
- The Si isomer 1 is the most energetically stable isomer making it the thermodynamic product, this could account for it being the product with the highest yield within the literature reaction.
- The Ge isomers of the literature compounds share similarities in vibrational frequencies, molecular orbital predictions and are close in energy to the Si isomers.
- In the IR spectra of all the isomers the peaks with the highest intensity are a result of the large number of hydrogen atoms in the molecule all undergoing the same vibrational motion.
- From the predicted molecular orbital calculations it can be predicted that the isomers 1 of Si and Ge would undergo electrophilic addition around their Si=Si/Ge=Ge bonds respectively. For the isomers 2 of Si and Ge it was not so easy to determine the location of potential electrophilic attack.
References
1. Kinjo. R, Ichinohe. M, Sekiguchi. A, Takagi. N, Sumimoto. M, Nagase. S, J. Am. Chem. Soc, 2007, 129, 25, pp7766 DOI

