InorgLab:andresmartinlab
Andres Martin Inorganic Lab Coursework
BH3
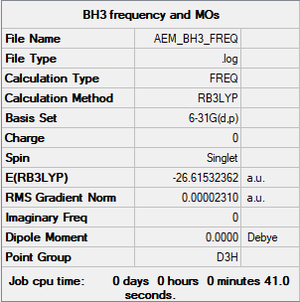
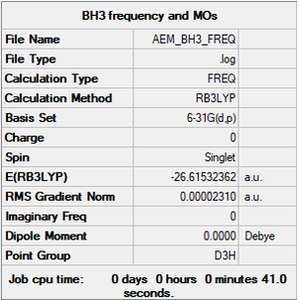
B3LYP/6-31G(d,p)
         Item               Value     Threshold  Converged?
 Maximum Force            0.000046     0.000450     YES
 RMS     Force            0.000023     0.000300     YES
 Maximum Displacement     0.000182     0.001800     YES
 RMS     Displacement     0.000091     0.001200     YES
Frequency file: aem_bh3_frequency.log
 Low frequencies ---   -0.4072   -0.1962   -0.0054   25.2514   27.2430   27.2460
 Low frequencies --- 1163.1897 1213.3128 1213.3155
Optimised BH3 Molecule |
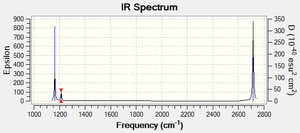
Vibrational Spectrum for BH3
| wavenumber (cm-1) | Intensity (arbitrary units) | symmetry | IR active? | type |
| 1163 | 93 | A"2 | yes | Out-of-plane Bend |
| 1213 | 14 | E' | very slight | In-plane Bend |
| 1213 | 14 | E' | very slight | In-plane Bend |
| 2582 | 0 | A'1 | no | Totally Symmetric Stretch |
| 2714 | 126 | E' | yes | Asymmetric Stretch |
| 2714 | 126 | E' | yes | Asymmetric Stretch |
The IR Spectrum only shows 3 peaks. As can be seen from the table above, the two asymmetric stretches are degenerate (at a frequency of 2714 cm-1). The Bend and Rocking are also degenerate (at a frequency of 1213 cm-1). The symmetric stretch has no change of dipole and so is IR inactive.
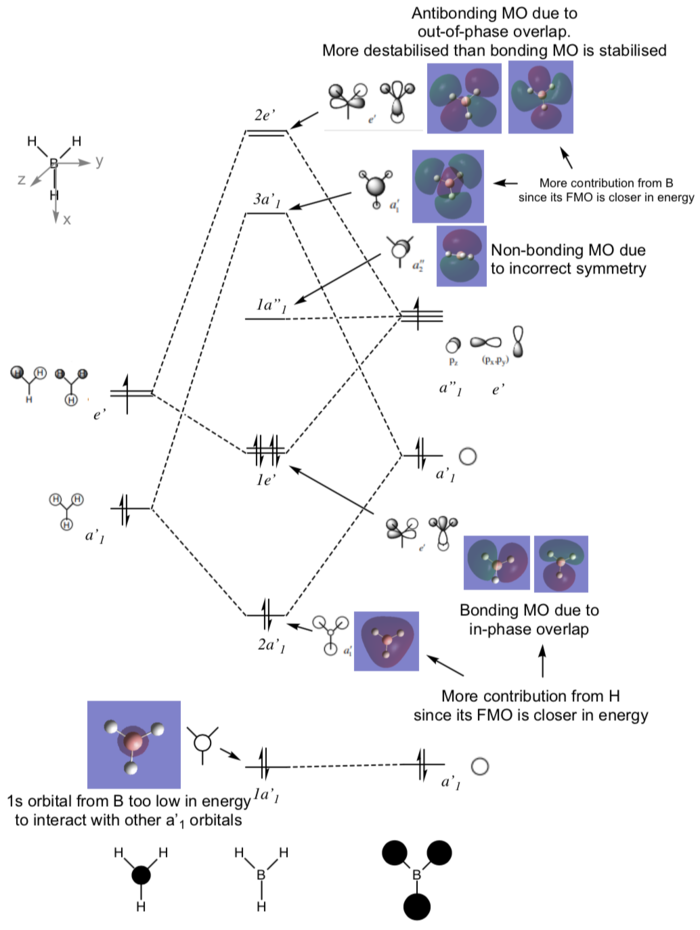
MO DIAGRAM
There are no significant differences between the LCAOs and the real MOs, except that in the real MO the in-phase orbitals are merged. Therefore qualitative MO theory is accurate an useful
Ng611 (talk) 14:54, 13 May 2019 (BST) What about discrepancies in orbital contributions predicted from qualitative MO theory?
NH3
B3LYP/6-31G(d,p)
        Item               Value     Threshold  Converged?
 Maximum Force            0.000006     0.000450     YES
 RMS     Force            0.000003     0.000300     YES
 Maximum Displacement     0.000013     0.001800     YES
 RMS     Displacement     0.000007     0.001200     YES
Ng611 (talk) 14:56, 13 May 2019 (BST) Looks like your NH3 summary is actually from BH3
Frequency file: aem_nh3_frequency.log
 Low frequencies ---   -0.0138   -0.0032   -0.0015    7.0783    8.0932    8.0937
 Low frequencies --- 1089.3840 1693.9368 1693.9368
Optimised NH3 Molecule |
NH3BH3
B3LYP/6-31G(d,p)
        Item               Value     Threshold  Converged?
 Maximum Force            0.000115     0.000450     YES
 RMS     Force            0.000060     0.000300     YES
 Maximum Displacement     0.000581     0.001800     YES
 RMS     Displacement     0.000345     0.001200     YES
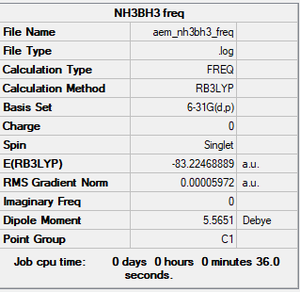
Frequency file: aem_nh3bh3_frequency.log
  Low frequencies ---   -0.0007    0.0004    0.0005   16.1826   17.3444   37.1736
 Low frequencies ---  265.8334  632.2043  639.2681
Optimised NH3BH3 Molecule |
Energies
E(BH3)= -26.61532 a.u.
E(NH3)= -56.55777 a.u.
E(NH3BH3)= -83.22469 a.u.
ΔE=E(NH3BH3)-[E(NH3)+E(BH3)]= -0.05160 a.u. = -135 kJ/mol
Compared to C-C bond (around 350 kJ/mol) the dative bond is relatively weak.
Ng611 (talk) 14:59, 13 May 2019 (BST) You need to cite the source you obtained this bond energy value from.
NI3
B3LYP/6-31G(d,p)LANL2DZ
      Item               Value     Threshold  Converged?
 Maximum Force            0.000102     0.000450     YES
 RMS     Force            0.000075     0.000300     YES
 Maximum Displacement     0.000858     0.001800     YES
 RMS     Displacement     0.000629     0.001200     YES
Frequency file: aem_ni3_frequency.log
 Low frequencies ---  -12.3845  -12.3781   -5.6129   -0.0040    0.0194    0.0711
 Low frequencies ---  100.9307  100.9314  147.2333
Optimised NI3 Molecule |
Optimised N-I distance= 2.184 Å
Mini Project
In this project we aim to investigate the charge distribution of [N(CH3)4]+ and [P(CH3)4]+. Additionally, the MOs of [N(CH3)4]+ were calculated and three were chosen to portray bonding and antibonding.
[N(CH3)4]+
B3LYP/6-31G(d,p)
   Item               Value     Threshold  Converged?
 Maximum Force            0.000073     0.000450     YES
 RMS     Force            0.000018     0.000300     YES
 Maximum Displacement     0.000276     0.001800     YES
 RMS     Displacement     0.000087     0.001200     YES
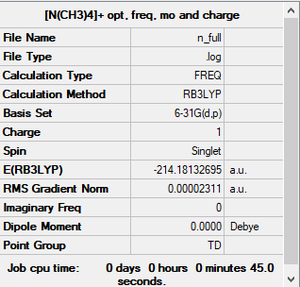
Frequency file: aem_[N(CH3)4]+_frequency.log
Low frequencies ---    0.0005    0.0006    0.0008   35.6278   35.6278   35.6278
 Low frequencies ---  215.5224  315.1219  315.1219
Optimised [N(CH3)4]+ Ion |
[P(CH3)4]+
B3LYP/6-31G(d,p)
           Item               Value     Threshold  Converged?
 Maximum Force            0.000138     0.000450     YES
 RMS     Force            0.000035     0.000300     YES
 Maximum Displacement     0.000788     0.001800     YES
 RMS     Displacement     0.000330     0.001200     YES
Frequency file: aem_[P(CH3)4]+_frequency.log
 Low frequencies ---   -0.0019   -0.0004    0.0014   51.6343   51.6343   51.6343
 Low frequencies ---  188.7456  213.5999  213.5999
Optimised [P(CH3)4]+ Ion |
Charge Comparison
Ng611 (talk) 15:05, 13 May 2019 (BST) Remember to scale the colour range for both molecules so that they're the same!
| Atom | Electronegativity |
|---|---|
| Carbon | 2.55 |
| Nitrogen | 3.04 |
| Phosphorus | 2.19 |
Helmenstine, T. (2019). Electronegativity Chart PDF. [online] Science Notes and Projects. Available at: https://sciencenotes.org/electronegativity-chart-pdf/ [Accessed 3 May 2019].
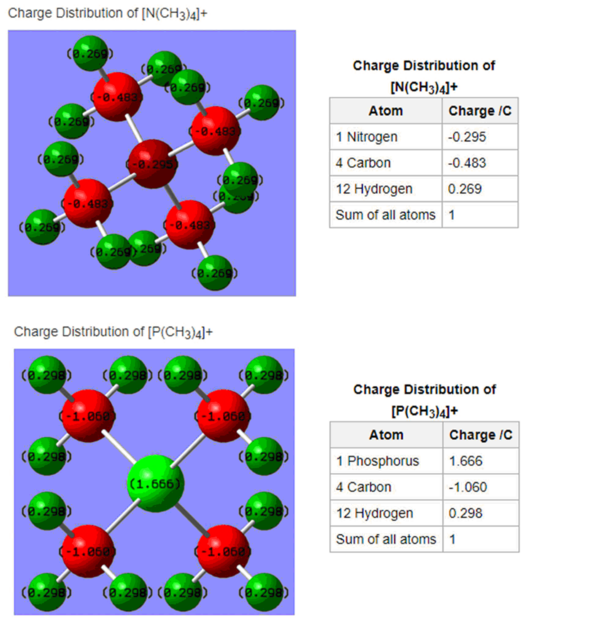
In both ions, the carbon atoms have partial negative charges of -0.483 C ([N(CH3)4]+) and -1.060 C ([P(CH3)4]+). The hydrogen atoms have similar partial positive charges of 0.269 ([N(CH3)4]+) and 0.298 ([P(CH3)4]+). For [P(CH3)4]+, the positive charge is centred on the P atom, as we would expect. For [N(CH3)4]+ however, the positive charge is delocalised around the H atoms. The N atom in this case has a slightly negative charge. This goes against the traditional model (see diagram below). Nitrogen is more electronegative than phosphorus, so it draws electron density to itself. Methyl groups can act as electron donors and so the nitrogen draws in electron density from them. Phosphorus is more electropositive and so it is able to donate electron density to the methyl groups (carbon is more electronegative than P).
Ng611 (talk) 15:08, 13 May 2019 (BST) You should also discuss the effect of symmetry on charge distribution.
Nitrogen has 5 valence electrons. The formal charge represents the N atom not having 5 valence electrons anymore, since it has 8 but they are shared between it and the carbons, so it is as if it had 4 valence electrons, hence the positive formal charge.
[N(CH3)4]+ MO
Ng611 (talk) 15:14, 13 May 2019 (BST) A good attempt at some tricky orbitals. In MO18, the p-orbitals on your FOs are pointing in the wrong direction (because of the symmetries of Me and BH3, you can use your BH3 orbitals as a guide). Finally, discussing some of the key orbital interactions would have also improved this section.
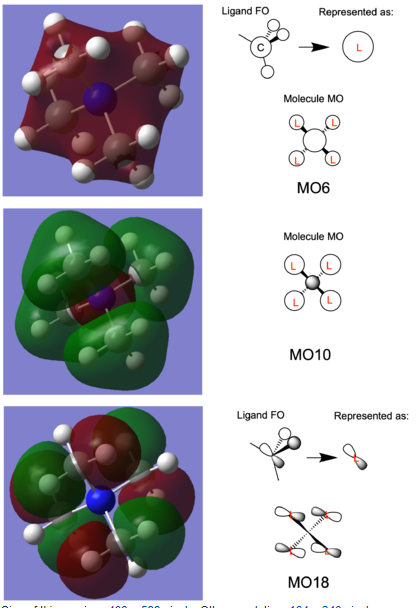
MO6 and 10 represent a pair of bonding and antibonding orbitals. MO 18 represents an antibonding orbital.
I found interesting how for MO10, the N s orbital pushes away the ligand FO into separate, distinct "lobes". However for MO6 since all the orbitals are in-phase, they merge. Because the nitrogen is electronegative then the MO is contracted towards the centre.

