Inorg:y2 tyoember
Borane (BH3)
RB3LYP/6-31G(d,p) Level

Item                      Value       Threshold   Converged?
 Maximum Force            0.000009     0.000450     YES
 RMS     Force            0.000005     0.000300     YES
 Maximum Displacement     0.000036     0.001800     YES
 RMS     Displacement     0.000018     0.001200     YES
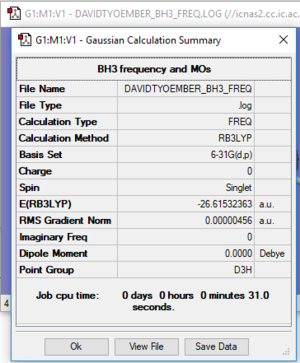
Frequency Analysis Log File: DAVIDTYOEMBER_BH3_FREQ.LOG
 Low frequencies --- -2.9884   -1.1079   -0.0054    1.6554    9.9523   10.0137
 Low frequencies --- 1162.9840 1213.1744 1213.1770
---
optimised BH3 molecule (FREQ) |
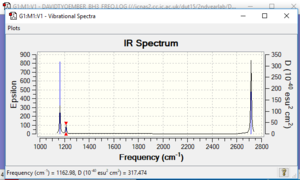
Vibrational spectrum for BH3
| wavenumber (cm-1 | Intensity (arbitrary units) | symmetry | IR active? | type |
| 1162.98 | 92.5 | A1 | yes | out-of-plane bend |
| 1213.17 | 14.1 | E | very slight | bend |
| 1213.18 | 14.1 | E | very slight | bend |
| 2582.32 | 0 | A1 | no | symmetric stretch |
| 2715.49 | 126.3 | E | yes | asymmetric stretch |
| 2715.49 | 126.3 | E | yes | asymmetric stretch |

There are less than 6 peaks because there are 2 pairs of vibrations with the values in each pair having similar wavenumber values. The result is that on the spectra, the peaks one would expect for these pairs superposition and result in there being only 2 peaks. The remaining 2 vibrations result on only 1 peak as one is not IR active (namely that at wavenumber of 2582.32cm-1) - this results in it not producing a peak - leading to a total of 3 peaks.
Good identification of both reasons which lead to only 3 visible peaks. To improve, you can use the word 'degenerate' to describe ones which occur at the same freqeuncy. The symmetries in your table are also slightly wrong and not that both IR intensities and vibrational frequencies should be left as the nearest whole number. Smf115 (talk) 15:17, 2 June 2019 (BST)
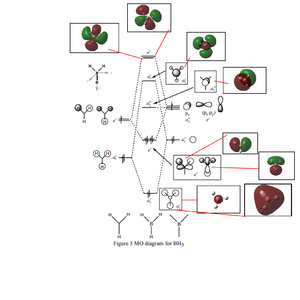
Occupied/Unoccupied Orbital Comparison

Are there any significant differences between the real and LCAO MOs?
• For the 2nd lowest energy occupied orbital, which encapsulates the whole molecule, the encapsulation is far better represented in the GaussView Generated MO orbital compared to the LCAO version.
What does this say about the accuracy and usefulness of qualitative MO theory?
• It shows that Qualitative MO theory does fall short of delivering a more complete picture of the shapes of orbitals. However practically speaking the representation is still very useful for constructing a rough picture of the arrangement of the MOs.
Good inclusion of the calculated MOs on to the MO diagram, however, you have also included the core orbital labelled as the 1a1' one too while it should have not appeared on the diagram because it is too low in energy. Good attempt at trying to highlight the similarities and differences. To improve you could have been clearer and used more technical language, your comment is also incorrect I think as you are discussing the core orbital? Smf115 (talk) 15:30, 2 June 2019 (BST)
NH3 FREQ+OPT LOG FILE
E(NH3)= -56.55776873 a.u.
BH3 FREQ+OPT LOG FILE
E(BH3)= -26.61532363 a.u.
NH3BH3 FREQ+OPT LOG FILE
E(NH3BH3)= -83.22468889 a.u.
(Basis Set+Method used for all: B3LYP/6-31G(d,p))
ΔE=E(NH3BH3)-[E(NH3)+E(BH3)]
ΔE(a.u.) = (-83.22468889)-[(-56.55776873)+(-26.61532363)] = -0.05159653 a.u.
ΔE(kJ/mol) = -135.46 kJ/mol = -135 kJ/mol (rounded to 0 d.p/nearest 1 kJ/mol)
NI3 File(Pre-edit): TYOEMBER_I3_OPT_SAVE1.gjf
Correct energy calculation above. It is a shame that the structure information for NH3 and NH3BH3 are missing as you had obviously done the calculations and the report is obviously unfinished. Smf115 (talk) 15:31, 2 June 2019 (BST)
