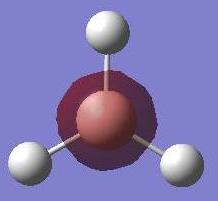
Inorg:sb807
Inorganic Computational Module
Introduction
In this module I will graduate onto using Gausview for studying reactions and molecules in Inorganic chemistry. The initial section will be a tutorial detailing the techniques required to study and Inorganic system in depth using Gausview 5.0.8c. The example systems used will be BH3 and, BCl3 units.
Once the concepts involved in optimising and analysing these systems have been grasped, they will then be applied to a larger more interesting organometallic complex. The complex in question will be a Bistrichlorophosphinetetracarbonyl Molybdenum species. This ties in nicely with the practical experiment from second year synthesis labs, where complexes of a triphenylphosphine analogue were prepared and studied via IR spectroscopy.
The final part of this module will be an indepth analysis of a mini project.
The aims of this lab are: 1. Learn to use Gaussview 5.0.8c to optimise and analyse Inorganic species in chemistry. 2. Consolidate concepts learnt from Module 1: Organic.
Creating a BH3 Molecule
For the first task a molecule was created using Gausview 5.0.8c. This molecule (as instructed by the tutorial) was a BH3 molecule. The program functions were familiarised i.e moving the molecule (translation), turning it on either xyz axis (roatation, Inquiry button, using the palette to add/remove different atoms to/from my molecule.
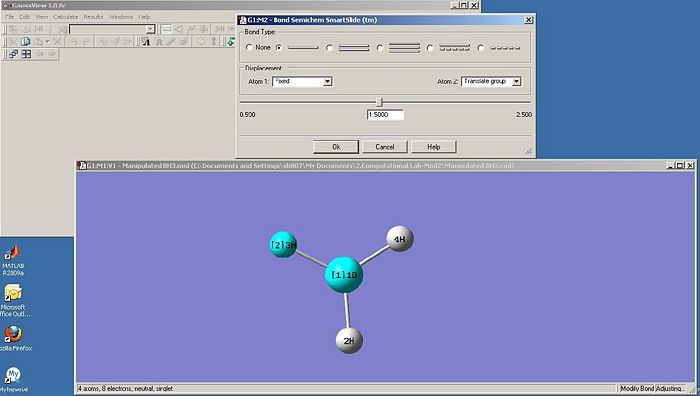
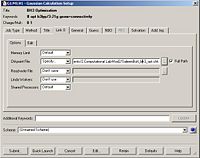
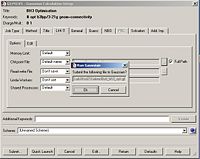
The final task was to change the H-B bond lengths in the BH3 unit to 1.5 Angstroms. This is shown below:
Optimising the BH3 Molecule
 |
 |
 |
 |
 |
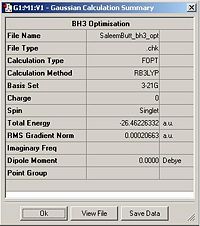
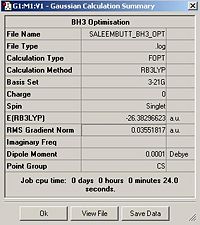
Analysing the Input
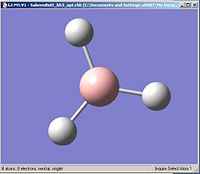
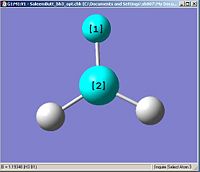
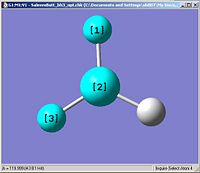
Using the inquiry button I analysed all the properties of the BH3 molecule and tabulated them below. Here are a few diagrams of measurements being taken:
 |
 |
 |
 |
 |
 |
| Property | 1 | 2 | 3 |
|---|---|---|---|
| H-B-H Angle(•) | 119.999 | 120.001 | 120.000 |
| B-H bond length (Å) | 1.19348 | 1.19349 | 1.19350 |
Understanding optimisations
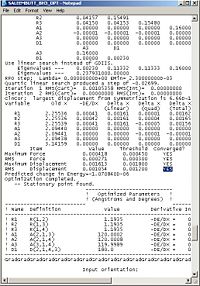
Once the optimisation process is completed we can then view specific data about the entire process on Gausview. Below is a printscreen of some of the observable quantities explained.

Shown above are the two graphs produced during the optimisation process. The top one shows the energy at every step of the optimisation process, and the second one shows the gradient (Root Mean Square) of the energy at every step of the process. The gradient of the energy represents the difference in energy between each successive optimisation step. As the gradient approaches zero, the optimisation is becoming smaller and smaller. A large gradient would therefore be present if each optimisation step produced a large difference in the energy of the molecule.
Molecular orbitals
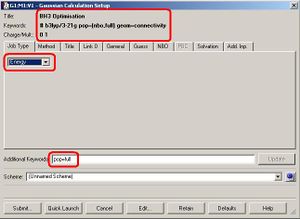
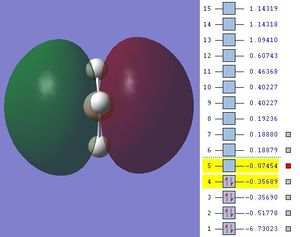
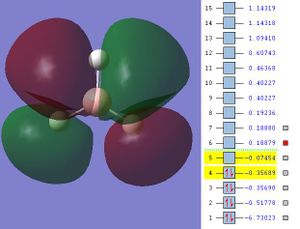
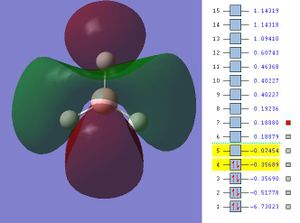
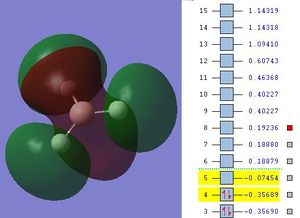
The next step was to use Gausview to obtain the MOs for the BH3 molecule. Below is the operation required with all the key fields circled in red (click to enlarge): A 3-21G Basis Set, Full NBO, Energy optimisiation.
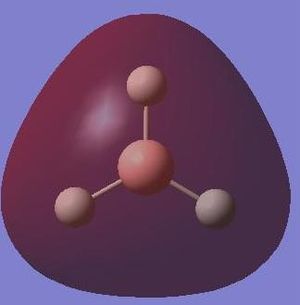
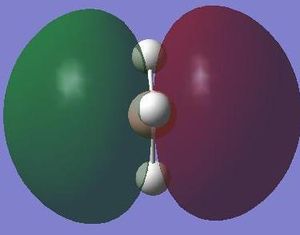
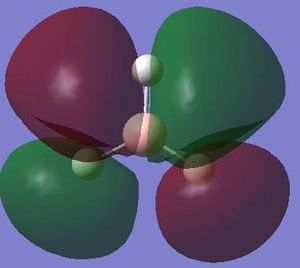
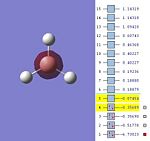
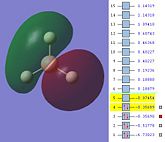
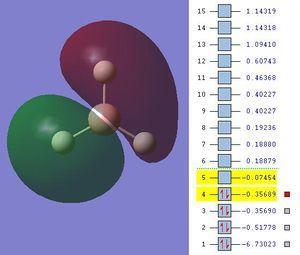
The MOs are shown below (click to enlarge and see their energies):
 |
 |
 |
 |
 |
 |
 |
 |
NBO analysis
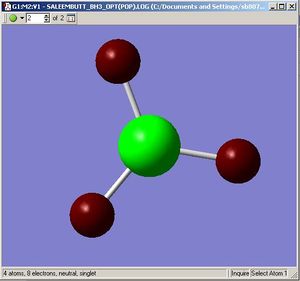
We will now carry out a "Natural Bond Orbital Analysis". Before we do this though we can look at the charge distribution on the molecule. This is done by opening the log file (instead of the checkpoint) and clicking on "Results" --> "charge distribution" --> "colour atoms by charge". We can also look at the charges numerically by replacing the final step and checking the "show numbers" box instead. Below are the results for the BH3 molecule.
 |
 |
The NBO analysis can give us even more important information. This is shown and explained below:

In the picture above a print screen of the "Summary of Natural Population Analysis" is taken. The numbers shown under 'Natural Charge' are what we have just examined in the Gausview program.

The print screen above (click to enlarge if necessary) shows the orbital contribution to each bond from the Boron and each respective hydrogen. It details in depth the hybridisation character of each orbital that is contributing to a bond.
 |
 |
The files above are print screens of the 'NBO summary' and 'Second order perturbation theory analysis of the Fock matric in NBO basis'.
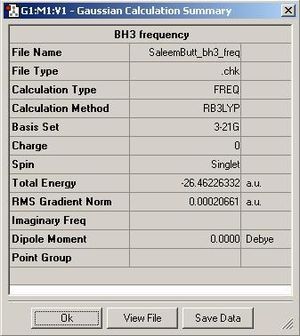
Vibrational analysis
 |
 |
 |
Animating molecular vibrations
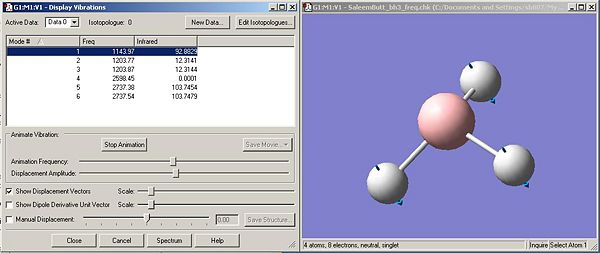
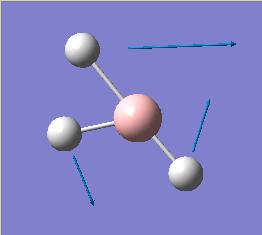
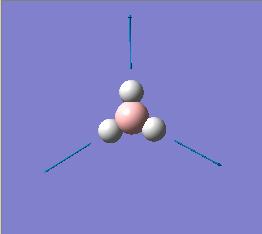
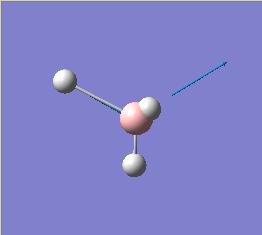
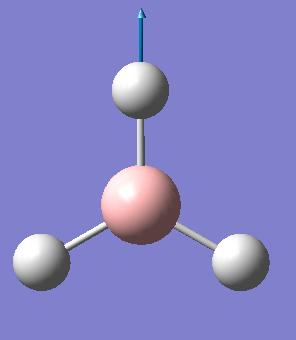
The symmetry point groups for each vibration were calculated by checking each vibration against the D3h character table. The intensity and freqeuncy values were obtained from the log file
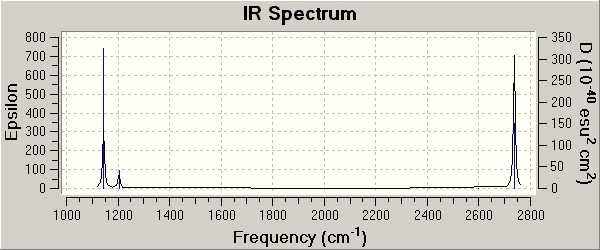
Shown below is the IR spectrum for the BH3 molecule. The main significant point we can take from this is that there are 3 main peaks at around abouts ~1143cm-1, ~1203cm-1, and ~2737cm-1. These three peaks represent the vibrations that are 'visible'(i.e an intensity of >0, or IR allowed) in the IR spectrum. Now that we have analysed the vibrations and collated all the data (table above) we can see that the one vibration that is invisible (i.e not IR allowed and Intensity = 0.0) is vibration number 4. This has the symmetry label A1', and if we examine the vibration carefully we notice that it is completely symmetric. Therefore there is no change in the dipole, and for a vibration to be IR active it must have a change in the dipole.
BCl3 Analysis
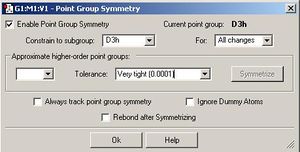
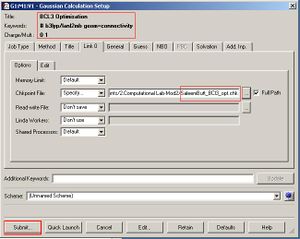
Below is a summary (in images) of a BCl3 molecule having its geometry optimized with a very tight tolerance to the D3h point group (i.e its optimization was constrained to prevent problems with further analysis). The optimization method (as shown in the diagrams below) was DFT-B3LYP/LanL2MB (method/basis set).
 |
 |
 |
 |
 |
 |
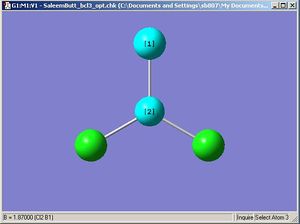
After the optimisation is complete we can measure the bond lengths and angles in the molecule (shown above). The default B-Cl bond length was 1.87Å when the molecule was built in Gausview, and the optimum B-Cl bond length was 1.86592Å and the optimum Cl-B-Cl angle 120 degrees (as would be expected if the symmetry was restricted. The accuracy of the bond length here is stated to a far greater degree than is actually possible to calculate on Gausview (about 0.01Å). The real optimised bond length can only be expressed to about 2 d.p. i.e 1.86Å. To confirm that the energy of the BCl3 molecule was at a minimum a BCl3 Frequency analysis was run (image shown below). The 6 vibration frequencies are reported in the log file (the link in the previous sentence). Below is an image of the Gaussian calculation.
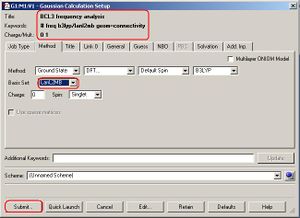
The basis set for both calculations used was Lanl2MB. The reason the choice for both calculations is the same is to maintain consistency in our calculations. The basis set determines the accuracy and approach of the calculation. Using different basis sets would leave the entire exercise redundant as our results would be to different accuracies and would have been calculated using different approaches.
The reason why Gausview doesn't draw the bonds in some optimized structures is because the bond lengths do not fall within parameters that Gaussview defines as the limits for bond lengths. This doesn't mean that the bond is not experimentally there, but that Gaussview sometimes does not always believe a bond should be present even though we know that it is experimentally proven to be there. For this reason the bonds sometimes dissappear after optimization processes (as seen for the optimization 'initial steps' of BH3 earlier in the exercise, when the bond lengths were higher than the 'actual' length.)
Simplistically a bond is just a net attractive force holding two atoms together. The parameters that define this force are determined via coulombs law. If the attractive forces outweigh the repulsive forces a bond will form. If they don't then simply it won't. The strength of a bond can vary depending on the conditions to which it is exposed. If enough energy is given to a bond in the correct form, the atoms will be forced apart, as for some reason the attractive force is now outweighed by a repulsive force.
The symmetry of the ground state structure is the same as that for the BH3 molecule i.e. trigonal planar and D3h. It's reported in the log file of the frequency analysis that Gausview uses the D3h point group: 'Framework group D3H[O(B),3C2(Cl)]'.
The calculation for the optimization took 15.0 seconds, and the frequency analysis took 20.0 seconds (both run on the laptop). This is extremely fast making the overall method very time effective.
BH3 MO analysis
Shown below is the MO diagram for a BH3 molecule. This consists of combining a H3 fragment with a Boron atoms AOs. The actual linear combination of the atoms is not pictorially shown, but will instead be included in the table below.
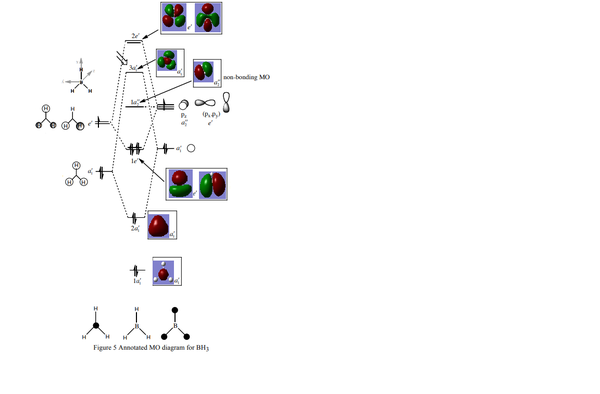
In conclusion, the table above (in my opinion) shows how qualtitative MO theory is a stronger approach when estimating the size and shape of the overall MO. Although the LCAO is still affect, in particular when dealing with bond interactions, the qualitative approach is far superior.
An organometallic complex
Energy optimisation
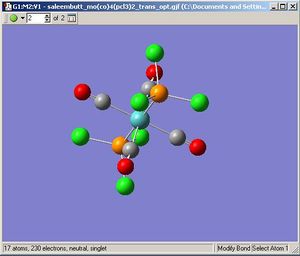
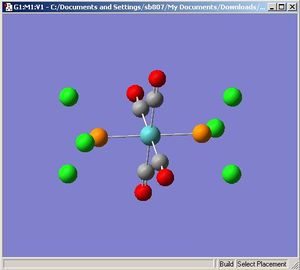
Below are galleries showing the operations performed in this part of the exercise. They show the optimization processes employed followed by what the structure looks like. As instructucted the optimized structures were manually configured before resubmitting for a second optimization using a more detailed basis set. Once the structures had been finally optimised, they were submitted for a frequency analysis using the same basis set as the optimization.
Trans-Molybdenum Tetracarbonyl Trichlorophospine
 |
 |
 |
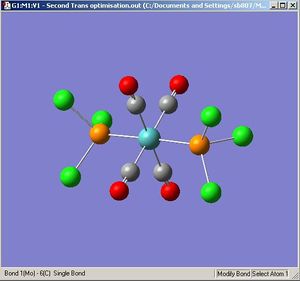 |
The optimisation [1] and frequency[2] results are deposited on D-Space.
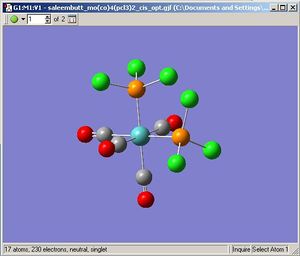
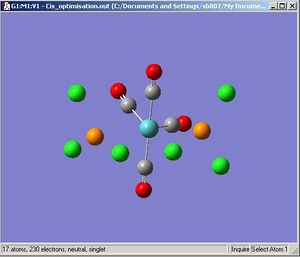
Cis Molybdenum Tetracarbonyl Trichlorophospine
 |
 |
 |
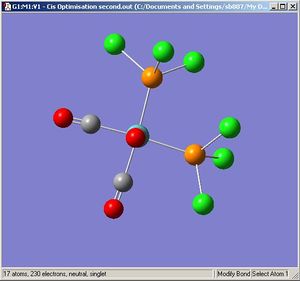 |
The optimisation [3] and frequency[4] results are deposited on the D-Space.
Energy discussion
1. Which Isomer is more stable, and why?
2. What is the energy difference between the two isomers?
All the required energy data for questions 1 and 2 are tabulated below:
| Property | Cis | Trans |
|---|---|---|
| Energy after final optimisation (Hartrees) | -623.57707195 | -623.57603102 |
| Energy difference (hartrees) | 0.00104093 |
The energy difference between the two isomers is 0.00104093 Hartrees. Since 1 Hartree is 2625.50 KJ/mol, this corresponds to an energy difference of 2.73 KJ/mol between the optimised structures. Since the calculations on Gaussian for energy are only accurate to about 10 KJ/mol, the difference falls outside the error limit. From this we can conclude that my Gaussian calculations can not differentiate between which isomer is more stable.
However if we were to assume that the values were more accurate than they actually are then the Cis is the more stable isomer. The reason for this? We need to consider that we are using chlorines to model phenyl groups and are therefore less sterically demanding. In the experimental set up, the trans is actually more stable because the phenyls sterically hinder each other. The reason why cis is more stable in this computational exercise is probably because the chlorines don't hinder each other (i.e no steric penalty) and there is more back bonding (i.e they are not trans and therefore don't backbond into the same p orbital).
3. What changes can we make to the ligand L=PR3 that could potentially alter the relative ordering of the cis and trans isomers?
If we modified the L groups to be larger there would be more steric repulsion. (the reason that we didn't in this exercise was to avoid laborious time-consuming calculations). This would cause the trans isomer to be significantly lower in energy. If we maybe put more electronegative groups on the phosphine instead that would lower the energies of the ligand MOs making backbonding more favourable. This would potentially make the cis-isomer more stable.
Structural discussion
The geometric bond lengths are listed in the table below
| Property | Cis | Trans |
|---|---|---|
| Mo - C (Å) | 2.01 | 2.06 |
| C = O (Å) | 1.17 | 1.17 |
| Mo - P (Å) | 2.51 | 2.45 |
| P - Cl (Å) | 2.24 | 2.24 |
For the trans isomer there is a slight increase in the Mo-C bond length. This implies there is less backbonding in the trans isomer. The Mo-P bond length is longer in the Cis isomer which again implies that the interaction is weaker in the cis isomer. Both these facts support each other in that the cis isomer has stronger backbonding.
The P-Cl bond length doesn't change across the structures (as we would expect.)
IR discussion
 |
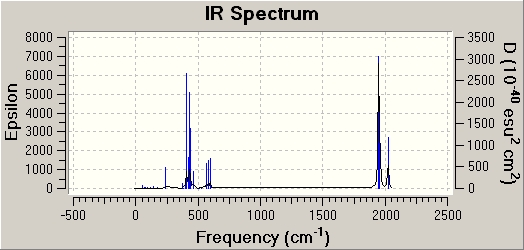 |
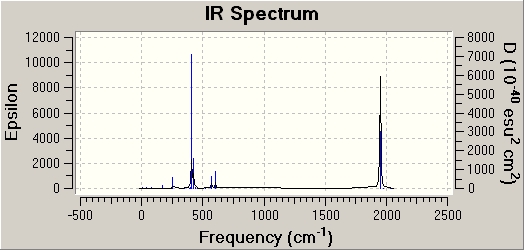
Both spectrums have regions of intensity at similar wavenumbers (400 & 1900 cm-1). However the cis isomer has generally more stretches. This is what I would predict as it is a less symmetrical molecule. There are no frequencies in the negative range with any intensity.
Mini-Project: Fuels for the future
Introduction
In this mini-project I will examine the structural properties of Ammonia borane (NH3BH3) and study its various confomers. Using computational chemistry I will try and find the most stable conformer it can possess (i.e. is the staggered or eclipsed isomer more stable), and compare it to the equivalent confomers of its organic analogue (ethane). I will proceed to examine its bonding properties, and the stability of its products (after certain reactions have been performed.)
Building and optimising the molecules
Since the molecule being computationally studied here is relatively simple (only 8 atoms) we can employ a more powerful basis set. I will begin by optimising the geometry of an ammonia borane molecule using an initial DFT-BL3YP/3-21G method and basis set. This will be proceeded by using the more powerfull 6-31G basis set. Since (at this point in my education) I don't know how to use any more powerful basis sets, this level will have to suffice.
Once the ammonia borane has been optimised (in both confomers), the same will be done for the organic analogue, and the products. To confirm all properties have converged the log file will be checked and then a frequency analysis run (using the same basis set - the question 'why the same basis set?' is explained earlier in the report.) When I move onto the MP2(6-31G,d) basis set and method, my results are no longer comparable to what I've done before as the method has changed and so there is no more consistency in the process. The uses of doing the MP2 calculations in the first place are:
1.They are more accurate (a more powerful basis set)
2.The new (more accurate) energies can be used to examine the barriers of rotation between the ammonia borane staggered/eclipsed and the ethane staggered/eclipsed more accurately.
For smaller molecules such as H2 there is no need to start of with such a low basis set and work your way up. As the molecules are so small I will start (and finish!) with the MP2 calculation. Therefore anything in the table below which has only had its geometry optimised by MP2 has been deemed too small to require using a gradual increase in basis set.
| Molecule | 3-21G | 6-31G | Freq. Ana.(6-31G) | 6-31G(d) | MP2 |
|---|---|---|---|---|---|
| Ammonia Borane (Staggered) | 43 seconds | 31 Seconds | 44 Seconds | 49 Seconds | 30 Seconds |
| Ammonia Borane (Eclipsed) | 38 Seconds | 26 Seconds | 28 Seconds | 42 seconds | 16 Seconds |
| Ethane (Staggered) | 18 Seconds | 19 Seconds | 20 Seconds | 13 seconds | 14 Seconds |
| Ethane (Eclipsed) | 13 Seconds | 11 Seconds | 17 Seconds | 11 Seconds | 14 seconds |
| NH4BH4 | / | / | / | / | 131 Seconds |
| H2 | / | / | / | / | 5 Seconds |
| NaBH4 | / | / | / | / | 66 Seconds |
| NH4Cl | / | / | / | / | 75 Seconds |
| NaCl | / | / | / | / | 22 Seconds |
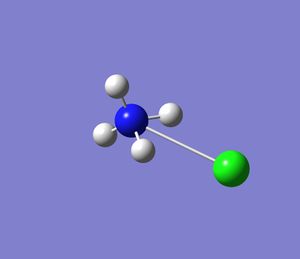
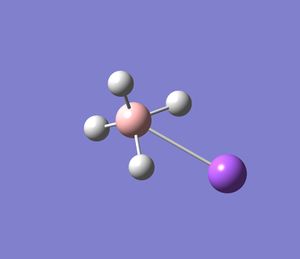
Below are is a gallery of some of the structures in Gaussview:
 |
 |
MO analysis (as an aside: Looking at the reactivity)
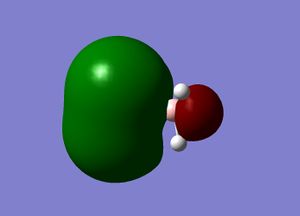
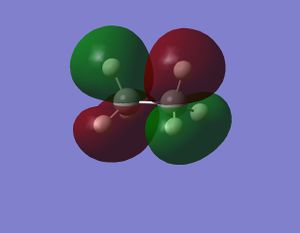
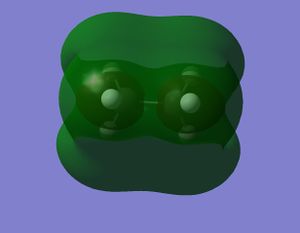
In the table below are image captures of all the LUMOs and HOMOs of the molecules in question. In the third column are simple notes about how the Molecular orbitals vary (if at all!) between rotamers. I anticipate that will be very little change but we shall find out once the computational analysis is complete.
Disscusion
The reason the LUMOs and HOMOs are being examined in particular is because these are the key orbitals involved in any kind of reactivity (be it nucleophillic or electrophillic attack.) From the results above we can conclude that although there is no preference (for a site of attack) for either a nucleophile or electrophile attacking an ethane molecule, this is not the case for an ammonia borane. In the ammonia borane there is a clear disparity in a species attacking either the nitrogen of boron. This would seem intuitively correct as there is a difference in electronegativity between the nitrogen and borane (which is not present in ethane as both centres are carbons).
Energy Analysis
In the table below are all the energies computed from the optimization processes (log files in first part of mini project). The important energies which I will used for my calculations i.e the MP2 ones are recorded to 4 d.p.
| Molecule | E:B3YLP(3-21G) | E:B3YLP(6-21G) | E:B3YLP(6-31G,d) | E:MP2(6-31G,d) |
|---|---|---|---|---|
| Ammonia Borane (staggered) | -82.867 | -83.194 | -83.210 | -82.8733 |
| Ammonia Borane (eclipsed | -82.763 | -83.191 | -83.209 | -82.8689 |
| Ethane (staggered) | -79.401 | -79.813 | -79.830 | -79.4955 |
| Ethane (eclipsed) | -79.396 | -79.808 | -79.826 | -79.4897 |
| NH4BH4 | / | / | / | -83.9603 |
| H2 | / | / | / | -1.1441 |
| NaBH4 | / | / | / | -188.9398 |
| NH4Cl | / | / | / | -516.5402 |
| NaCl | / | / | / | -621.5344 |
Ammonia Borane v.s Ethane
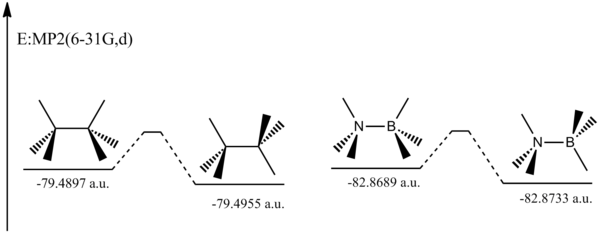
In the reaction profile below we can see that the rotational barrier for ammonia borane is 0.0044 a.u., and for ethane the corresponding barrier is 0.0058 a.u. The reason why the barrier is higher for ethane is probably due to steric reasons. If we look at the ammonia borane compound the N-H bond length is 1.02Å and the B-H bond length 1.21Å. Due to this they are directly opposite each other in the eclipsed version of the compound therefore there is less steric repulsion.
Another reason could be is that the N-C bond length (1.69Å) is longer than the C-C bond length (1.53Å) so the centres to which the hydrogen are bonded are therefore further apart.
Below is a reaction profile showing the main two reactions. The first reaction is where the ammonium chloride and the sodium borohydride come together to form the sodium chloride salt and the ammonium borohydride. The next reaction is where the ammonium borohydride breaks down to form the ammonia borane and the hydrogen molecule.
Overall reaction As shown in the reaction profile below, both processes are exothermic. The first reaction releases 0.0147 a.u., and the second reaction releases 0.0571 a.u.
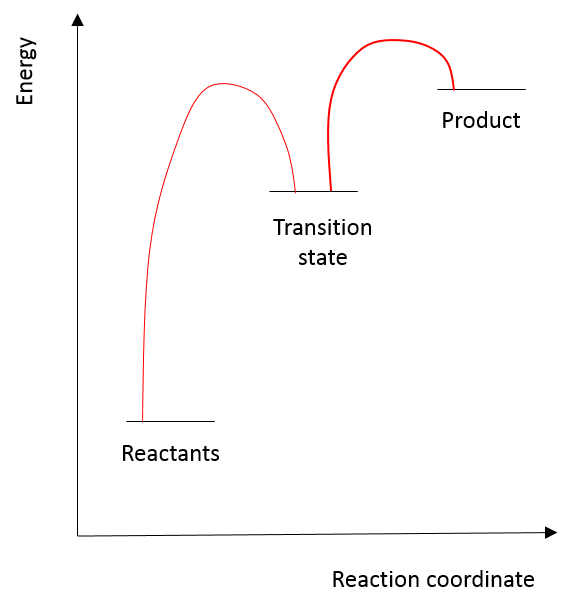
If we consider the E:(reactants) - E(products) of the 'overall' process there is a huge energy penalty as ammonia borane is significantly less stable than the initial reactions (NH4Cl, and NaBH4). But where does all this energy go? The answer (my calculation suggests) is that is consumed by the Sodium and Chloride which has an incredibly low lattice energy.
But what can we vary?
Naturally to see if NH3BH3 is a good system for storing hydrogen we should compare it to something which is relatively similar and see if it performs better or worse. But where can we look to find something which would have analogous reactivity and properties?
Naturally, moving directly down the periodic table would be a good start, as we will be staying with elements in the same group and therefore the same valency. The element below Boron is Aluminium, and the element below nitrogen is phosphorous. Therefore to see how good ammonia borane is, we will compare it to AlH3PH3. In the table below are the log files and energies of the new compound I'll be studying. For simplicity I will only be studying the staggered conformation (as my chemical intuition tells me that the eclipsed compound can only be higher in energy), and I will gradually increase my basis set till I get to the final MP2 method.
So what am I looking for?
The aim of this exercise is to examine the stability of AlH3PH3 relative to Ammonia Borane. If the Aluminium phosphorous species has a lower energy than ammonia borane then it must be a better source for storing hydrogen. This is becuase the overall hydrogen releasing reaction would produce more stable products and therefore me more thermodynamically driven.
| Basis Set/Method | B3YLP(3-21G) | B3YLP(6-31G) | B3YLP(6-31G,d) | MP2(6-31G,d) |
|---|---|---|---|---|
| Log File | 149 Seconds | 36 Seconds | 63 Seconds | 50 Seconds |
| Energy (a.u.) | -584.2821 | -587.3117 | -587.3667 | -586.2458 |
NOTE: After the B3LYP(6-31G) optimisation the Al-P and the P-H bonds all dissapeared, but after the MP2 optimisation the P-H bonds reappeared.
Conclusion
There is a significant difference in energy between the ammonia borane and the aluminium phosphorous analogue. Below is a summary of all the different bonds on the molecule, after the MP2 optimisation. We will examine the properties to see what could cause such a strong disparity.
| Property | Value |
|---|---|
| N-B Bond length (Å) | 1.69 |
| Al - P Bond Length (Å) | 2.55 |
| Al-H bond length(Å) | 1.60 |
| P-H bond length (Å) | 1.41 |
| N-H bond length (Å) | 1.01 |
| B-H bond length (Å) | 1.21 |
There is almost an entire angstrom in length difference between the Al-P bond and the N-B bond. This would significantly reduce any steric repulsions that could occur between any hydrogens on each center. This must definitely account for some reduction in steric strain, but to account for where the other 500 a.u. of stabilisation requires a more substantial answer. To conclude, I'm unable to explain such a large disparity in energy (with my limited knowledge) but what I can confirm is that the aluminium phosphorous structure must be a much better store for hydrogen (at least theoretically!).
Conclusion
In this lab I have learnt many new techniques for computational chemistry in Inorganic chemistry. These include (but are not limited to!):
1.Building and optimising a molecule in Gaussview 5.0.8c.
2.Analysing the data produced by the Gaussian optimisation process.
3.Using multiple different basis sets and methods
3.1. DFT:B3YLP(3-21G)
3.2. DFT:B3YLP(6-31G)
3.3. DFT:B3YLP(6-31G,d) (where d represents a polarising function on heavy atoms such as N, or B see miniproject)#
3.4. MP2:(6-31G,d) (probably the most advanced basis set I used in this lab. (NOTE: The list above is not exhaustive!)
4.Computing qualitative MOs for molecules such as BH3
In conclusion, I have learnt that Inorganic systems can be modelled very efficiently and accurately using computational chemistry, in processes that are very quick and informative. The main advantage of this is that computational resources are a lot less expensive than real time experiments (especially if something goes wrong!), and will most probably eclipse a large portion of experimental chemistry in the near future. This makes the techniques learnt in this lab even more important and useful.


