
IO:jh3416
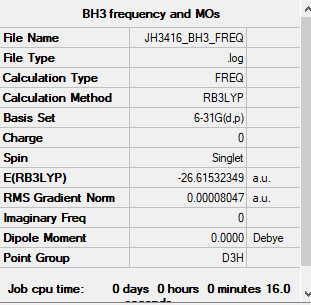
BH3
BH3 |
Optimisation
B3LYP/6-31G(d,p) level

Item Table
         Item               Value     Threshold  Converged?
 Maximum Force            0.000203     0.000450     YES
 RMS     Force            0.000098     0.000300     YES
 Maximum Displacement     0.000653     0.001800     YES
 RMS     Displacement     0.000415     0.001200     YES
Frequency Analysis
File:JH3416 BH3 FREQ.LOG
Low frequencies ---   -0.1187   -0.0049    0.0005   42.2482   42.2484   43.3387
Low frequencies --- 1163.5889 1213.5519 1213.5521
Additional BH3
BH3 Vibrational Modes
| No. | wavenumber (cm⁻¹) | Intensity (arbitrary units) | Symmetry | IR Active? | Type |
|---|---|---|---|---|---|
| 1 | 1164 | 92.5 | A2 | YES | Out of Plane Bend |
| 2 | 1214 | 14.1 | E' | YES | Antisymmetric Bend |
| 3 | 1214 | 14.1 | E' | YES | Antisymmetric Bend |
| 4 | 2580 | 0.0 | A1' | NO | Symmetric Stretch |
| 5 | 2580 | 126.4 | E' | YES | Symmetric Stretch |
| 6 | 2713 | 126.4 | E' | YES | Symmetric Stretch |
Ng611 (talk) 17:39, 29 May 2019 (BST) You've incorrectly labelled entries 5 and 6 as symmetric stretches, when they are in fact asymmetric.

There are 6 vibrational modes in total, satisfying the 3N-6 rule for a non-linear molecule. The IR spectrum however only contains 3 peaks, and this can be explained by looking at the vibrational modes. 2 and 3 are degenerate vibrations, as are 5 and 6, and so will appear under the same peak. Vibration (4) has a very low intensity and so will not be experimentally observable.
Ng611 (talk) 17:40, 29 May 2019 (BST) Not just a low intensity, an intensity of 0 (i.e. it is totally IR inactive). Try to think about why that would be.
BH3 Molecular Orbitals
The Molecular Orbitals for BH3 were then computed and compared with a qualitative LCAO MO Diagram, shown below.[1]

Ng611 (talk) 17:41, 29 May 2019 (BST) Your bottom two orbitals are not assigned correctly. You bottom most orbital (which you assign to a1') doesn't appear in the MO diagram at all (it's too low in energy). You second to bottom orbital is actually the one that corresponds to a1'
From the diagram it can be seen that the molecular orbitals in the qualitative MO Diagram for BH3 bears a resemblance to the computed orbitals, as it can be seen the nodes are displayed in the same regions. The computed MO's show a more accurate picture in that the in-phase MO's are merged and the gaps present in the LCAO representation are not observed. Another notable difference can be seen in the 3a1' orbital, where the orbital coefficients are notably larger on the central atom in the LCAO representation. Hence the LCAO description is insufficient to accurately describe orbital coefficients and energy ordering, however it is useful for depicting the general shape and rough energy ordering of MO's.
Ng611 (talk) 17:45, 29 May 2019 (BST) You've got the right idea (qualitative MO theory does sometimes predict different orbital contributions). However, this is not the case with the orbitals you provide.
Association Energies
NH3
NH3 |
B3LYP/6-31G(d,p) level

        Item               Value     Threshold  Converged?
Maximum Force            0.000006     0.000450     YES
RMS     Force            0.000004     0.000300     YES
Maximum Displacement     0.000014     0.001800     YES
RMS     Displacement     0.000009     0.001200     YES
File:JH3416 NH3 FREQ.LOG
Low frequencies ---   -0.0138   -0.0032   -0.0015    7.0783    8.0932    8.0937
Low frequencies --- 1089.3840 1693.9368 1693.9368
NH3BH3
BH3NH3 |
B3LYP/6-31G(d,p) level

        Item               Value     Threshold  Converged?
Maximum Force            0.000122     0.000450     YES
RMS     Force            0.000058     0.000300     YES
Maximum Displacement     0.000513     0.001800     YES
RMS     Displacement     0.000296     0.001200     YES
 Low frequencies ---   -0.0007   -0.0005   -0.0003   17.2958   17.6386   37.4385
 Low frequencies ---  265.8400  632.2182  639.3651
Calculating the B-N Association Energy
E(NH3)= -56.55776873 a.u.
E(BH3)= -26.61532349 a.u.
E(NH3BH3)= -83.22468891 a.u.
ΔE (a.u.) =E(NH3BH3)-[E(NH3)+E(BH3)] = -0.0516 a.u.
 ΔE (kj/mol) = (-0.0516 x 6.022x10²³ x 4.3597 x 10⁻¹⁸)/1000
 = -135 kj/mol.
The B-N dative bond is weaker than Diborane B-B (146kj/mol)and Hydrazine N-N (297kj/mol)[2], but stronger than intermolecular Hydrogen bonding (approx 7kj/mol)[3]; it is therefore reasonable to describe the bond as being of medium strength.
Ng611 (talk) 17:47, 29 May 2019 (BST) Interesting choice of comparative bonds. Why these ones?
Basis Sets and Pseudo-Potentials
NI3
NI3 |
Optimised N-I Bond Distanceː 2.18936 Angstrom
Ng611 (talk) 17:48, 29 May 2019 (BST) Way too many d.p. here. 3 d.p. is all that's needed.
Optimisation
Nitrogen atom: 6-31G(d,p) basis set
2 x Iodine atoms: LanL2DZ psuedo potential


Ng611 (talk) 17:49, 29 May 2019 (BST) Your output energy is incorrect, did you correctly apply the mixed basis set?
Item Table
     Item               Value     Threshold  Converged?
 Maximum Force            0.000122     0.000450     YES
 RMS     Force            0.000067     0.000300     YES
 Maximum Displacement     0.000552     0.001800     YES
 RMS     Displacement     0.000477     0.001200     YES
Frequency Analysis
File:JH3416 NI3 OPTV3.LOG
Low frequencies ---  -63.3725  -63.3698  -61.9250   -0.0012    0.0005    0.0042
 Low frequencies ---  133.9842  133.9844  195.0370
Part 2ː Ionic Liquids
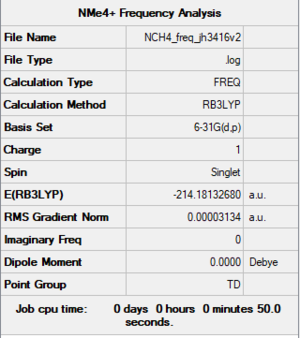
[N(CH3)4]+
Optimised molecule |
Optimisation
B3LYP/6-31G(d,p) level

Item Table
         Item               Value     Threshold  Converged?
 Maximum Force            0.000249     0.000450     YES
 RMS     Force            0.000036     0.000300     YES
 Maximum Displacement     0.000850     0.001800     YES
 RMS     Displacement     0.000252     0.001200     YES
Frequency Analysis
File:NCH4 FREQ JH3416V2.LOG
Low frequencies ---   -0.0010   -0.0009   -0.0007   34.7114   34.7114   34.7114
Low frequencies ---  216.3615  315.7960  315.7960
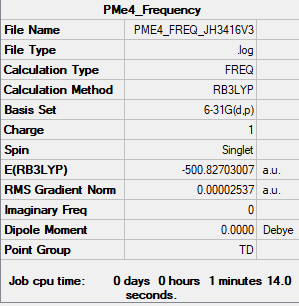
[P(CH3)4]+
Optimised PMe4 |
Optimisation
B3LYP/6-31G(d,p) level

Item Table
         Item               Value     Threshold  Converged?
 Maximum Force            0.000175     0.000450     YES
 RMS     Force            0.000038     0.000300     YES
 Maximum Displacement     0.001028     0.001800     YES
 RMS     Displacement     0.000372     0.001200     YES
Frequency Analysis
File:PME4 FREQ JH3416V3.LOG
Low frequencies ---   -0.0026   -0.0016   -0.0010   22.8333   22.8333   22.8333
Low frequencies ---  159.9394  194.7757  194.7757
Discussion
Charge Distribution


Phosphorus has a positive charge, indicating electron density is being drawn from the central phosphorous atom by the surrounding carbon atoms. In contrast, Nitrogen has a negative value of -0.295 indicating it is drawing electron density from the carbons. This can be explained by referring to their relative electronegativities; N = 3.04 > C = 2.55 > P = 2.15[4]. The more electronegative atom draws electron density towards itself, so nitrogen has a negative charge relative to carbon, as it has a greater electronegativity, whereas phosphorus has a positive charge relative to carbon because in this case the carbon atom is drawing most of the electron density.
Notably the Hydrogen charge distribution in [P(CH3)4]++ and [N(CH3)4]++, 0.298 and 0.269 respectively, contradicts the typical valence bond treatment which would predict the hydrogens attached to the more electron deficient carbon atom would themselves be more electron deficient. The opposite is seen to be true in this case.
Ng611 (talk) 17:56, 29 May 2019 (BST) Good, you also need to mention those identical atoms related by symmetry will have identical charges for full credit.
According to Valence Bond Theory, [NR4][+] is conventionally displayed with a formal positive charge of +1 on the nitrogen atom to achieve a stable octet. This is calculated according to the following formula:
Formal charge = no. of valence e- - [ no. of e- in lone pairs + 1/2{no. of bonding e-}]
= 5 - (0 + ½(8)) = +1

This contradicts the data above, which shows nitrogen bearing a non-integer negative value for its relative charge. This highlights the limitations of valence bond theory in comparison to Molecular Orbital Theory in describing bonding in molecules.
Ng611 (talk) 17:56, 29 May 2019 (BST) Good! A little more explanation here would be helpful but a good answer nevertheless.
[N(CH3)4]+ MO Analysis
The Molecular Orbitals for [N(CH3)4]+ were then computed. Of these, three occupied MO's were analysed further and a corresponding LCAO MO depiction was formed.
Ng611 (talk) 17:57, 29 May 2019 (BST) Which p-type FO are you using for each MO? It's unclear from your LCAO analysis.

MO 21 (HOMO)


MO 16


MO 7


Ng611 (talk) 18:00, 29 May 2019 (BST) Good LCAO!
<references>
- ↑ Hunt, P (2018) Lecture 4: Advanced Molecular Orbital Diagrams, from CHEM5001 Molecular Orbitals in Inorganic Chemistry, Imperial College London, Sherfield Building on 9th November. Available from Blackboard [Accessed 07/06/2019].
- ↑ Stevenson, D. P. The Strengths of Chemical Bonds. J. Am. Chem. Soc. 77, 2350 (1955).
- ↑ Markovitch, O. & Agmon, N. Structure and Energetics of the Hydronium Hydration Shells. J. Phys. Chem. A 111, 2253–2256 (2007).
- ↑ Murphy, L. R., Meek, T. L., Allred, A. L. & Allen, L. C. Evaluation and Test of Pauling’s Electronegativity Scale. J. Phys. Chem. A 104, 5867–5871 (2000).