IMM2 Hans Chan 01196664
Background
This investigation focuses on finding the optimised structure of molecules using quantum mechanical simulations. Optimisation was achieved by using the software Gaussian. In this workbook the results from optimisation of various molecules are reported. The following are included for each molecule;
- Key information about the calculation,
- Results.
- Item Table,
- Rotatable 3D jmol file and image of the optimised structure,
- Link to the final file of the optimisation or frequency.
Non-interactive images of relevant molecules were generated using Gaussview.
Molecular Modelling
Ammonia NH3
Ammonia |
Optimisation
The following settings were used for the optimisation of this molecule(click link for the .log file);
| Calculation Type | Calculation Method | Basis Set |
|---|---|---|
| FREQ | RB3LYP | 6-31G(d,p) |
The following results were generated;
| Final Energy
E(RB3LYP) /a.u. |
RMS
Gradient /a.u. |
Symmetry |
|---|---|---|
| -56.55776870 | 0.00004995 | C3v |
The item table here shows that the structure has converged;
         Item               Value     Threshold  Converged?
 Maximum Force            0.000080     0.000450     YES
 RMS     Force            0.000053     0.000300     YES
 Maximum Displacement     0.000235     0.001800     YES
 RMS     Displacement     0.000117     0.001200     YES
Geometry

The molecule takes a trigonal pyramidal geometry. As the hydrogen atoms are in an identical chemical environment, they have identical bond angles and bond lengths. The bond angle and bond length are shown in the table below;
| Geometry | |
|---|---|
| N-H Length /Å | H-N-H Angle /° |
| 1.01808 | 105.736 |
Vibrational Modes
The vibrational modes of the molecule are shown in the table below;
| Vibrational Modes | ||
|---|---|---|
| Mode | Freq /Hz | IR |
| 1 | 1090.18 | 145.2524 |
| 2 | 1694.09 | 13.5417 |
| 3 | 1694.09 | 13.5417 |
| 4 | 3460.20 | 1.0662 |
| 5 | 3588.67 | 0.2753 |
| 6 | 3588.67 | 0.2753 |
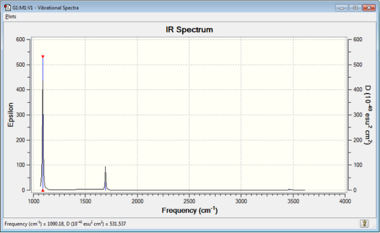
The above information was extracted from Gaussian's 'Vibrations' function (Figure 1).
- From the 3N-6 rule 6 modes of vibration are expected in ammonia (N=4). This is consistent with what was calculated.
- Modes 2 and 3 (scissoring bends) and 5 and 6 (asymmetric stretches) are degenerate pairs as they have the same energy associated to them.
- Modes 1 to 3 corresponds to bends, and modes 4 to 6 corresponds to stretches.
- Mode 4 is highly symmetric.
- Mode 1 is a symmetric bend and is otherwise known as the 'umbrella' mode.
- In an experimental spectra of gaseous ammonia, 4 bands should be expected. All the vibrational modes are associated with a change in dipole moment of the molecule , hence these oscillations are all IR active.[1] However the degenerate pairs of vibrational modes correspond to the same frequency as given by , where is the frequency and is the Planck's constant.
Note that Gaussian predicts a spectra with apparently two bands instead of four (Figure 2). This is because modes 4 and 5-6 are significantly weaker in comparison with the other three modes. Close observation shows that Gaussian displays them as a very weak peak around 3500cm-1.
Charges
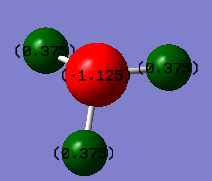
The relative charge distributions on the atoms as calculated by Gaussain are shown below;
| Relative Charge | |
|---|---|
| N | H |
| -1.125 | 0.375 |
The charges on the atoms computed by Gaussian are as expected; Due to the relative electronegativity of nitrogen in comparison with hydrogen (nitrogen 3.04 and hydrogen 2.20 on the Pauling Scale),[2] the assigned relative charge on nitrogen is negative (Figure 3). The sum of the charges on all atoms give zero, which is consistent physically as the molecule has no overall charge.
Hydrogen H2
Hydrogen |
Optimisation
The following settings were used for the optimisation of this molecule(click link for the .log file);
| Calculation Type | Calculation Method | Basis Set |
|---|---|---|
| FREQ | RB3LYP | 6-31G(d,p) |
The following results were generated;
| Final Energy
E(RB3LYP) /a.u. |
RMS
Gradient /a.u. |
Symmetry |
|---|---|---|
| -1.17853936 | 0.00000017 | D∞h |
The item table here shows that the structure has converged;
         Item               Value     Threshold  Converged?
 Maximum Force            0.000000     0.000450     YES
 RMS     Force            0.000000     0.000300     YES
 Maximum Displacement     0.000000     0.001800     YES
 RMS     Displacement     0.000001     0.001200     YES
Geometry
The molecule is linear. The bond angle and bond length are shown in the table below;
| Geometry | |
|---|---|
| H-H Length /Å | H-H Angle /° |
| 0.60000 | 180 |
Vibrational Modes
The vibrational mode of the molecule is shown below;
| Vibrational Modes | ||
|---|---|---|
| Mode | Freq /Hz | IR |
| 1 | 4465.58 | 0.0000 |
As it is a diatomic molecule the only vibrational mode is a stretch. No overall change in dipole moment renders the molecule IR inactive, as predicted by Gaussian.
Nitrogen N2
Nitrogen |
Optimisation
The following settings were used for the optimisation of this molecule(click link for the .log file);
| Calculation Type | Calculation Method | Basis Set |
|---|---|---|
| FREQ | RB3LYP | 6-31G(d,p) |
The following results were generated;
| Final Energy
E(RB3LYP) /a.u. |
RMS
Gradient /a.u. |
Symmetry |
|---|---|---|
| -109.52412868 | 0.00000079 | D∞h |
The item table here shows that the structure has converged;
         Item               Value     Threshold  Converged?
 Maximum Force            0.000001     0.000450     YES
 RMS     Force            0.000001     0.000300     YES
 Maximum Displacement     0.000000     0.001800     YES
 RMS     Displacement     0.000001     0.001200     YES
Geometry
The molecule is linear. The bond angle and bond length are shown in the table below;
| Geometry | |
|---|---|
| N-N Length /Å | N-N Angle /° |
| 1.10550 | 180 |
Vibrational Modes
The vibrational mode of the molecule is shown below;
| Vibrational Modes | ||
|---|---|---|
| Mode | Freq /Hz | IR |
| 1 | 2457.33 | 0.0000 |
As it is a diatomic molecule the only vibrational mode is a stretch. No overall change in dipole moment renders the molecule IR inactive, as predicted by Gaussian. Note that the vibration frequency of the nitrogen molecule is lower. The vibrational angular frequency is given by , where is the bond spring constant and is the system's reduced mass. Although nitrogen has a stronger bond (a larger ), the much lighter hydrogen molecule give an appreciably smaller reduced mass, resulting in a higher vibrational frequency.
Reaction Energy Consideration - Bosch-Haber Process
The Bosch-Haber Process converts nitrogen and hydrogen gas into ammonia;
N2 + 3 H2 → 2 NH3
The energy change of the reaction can be predicted using the energies of the molecules as calculated by Gaussian. The following table summarises the energies of the molecules computed above.
| Energy /a.u. | ||
|---|---|---|
| E(NH3) | E(N2) | E(H2) |
| -56.55776870 | -109.52412868 | -1.17853936 |
The total energy change of the process is thus;
ΔE = 2 × E(NH3) - [ E(N2) + 3 × E(H2) ]
= 2 × -56.55776870 - [ -109.52412868 + 3 × -1.17853936 ]
= -113.1155374 - [ -109.52412868 + -3.53561808 ]
= -0.05579064 a.u. = -146.478 kJ·mol−1.
A negative solution shows that the reaction is exothermic, and the sum of energies of the product is lower than the sum of energies of the reactants. This products are hence more stable than the reactants. The solution is by no means accurate compared to an empirical value of −91.88kJ·mol-1 under standard conditions. [3] This can be attributed to the fact that computational calculations do not take reaction conditions into account.
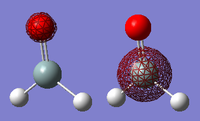
Silanone H2SiO
Silanone |
Note that silanone is also the general name assigned to the silicon analogues of ketones. Here the silicon equivalent of formaldehyde is concerned.
Optimisation
The following settings were used for the optimisation of this molecule(click link for the .log file);
| Calculation Type | Calculation Method | Basis Set |
|---|---|---|
| FREQ | RB3LYP | 6-31G(d,p) |
The following results were generated;
| Final Energy
E(RB3LYP) /a.u. |
RMS
Gradient /a.u. |
Symmetry |
|---|---|---|
| -365.90001403 | 0.00000941 | C2v |
The item table here shows that the structure has converged;
         Item               Value     Threshold  Converged?
 Maximum Force            0.000023     0.000450     YES
 RMS     Force            0.000009     0.000300     YES
 Maximum Displacement     0.000023     0.001800     YES
 RMS     Displacement     0.000017     0.001200     YES
Geometry
The molecule is roughly trigonal planar around the central silicon. The bond angles and bond lengths are shown in the table below;
| Geometry | |||
|---|---|---|---|
| Si=O Length /Å | Si-H Length /Å | H-Si=O Angles /° | H-Si-H Angle /° |
| 1.53172 | 1.48652 | 124.156 | 111.686 |
It can be seen that the H-Si=O angle and the H-Si-H angle are not exactly 120°, which would be the case if the molecule was indeed trigonal planar. This is a result of the higher electron density in the Si=O double bond repelling the Si-H single bonds.
Vibrational Modes
The vibrational modes of the molecule is shown below;
| Vibrational Modes | |||
|---|---|---|---|
| Mode | Freq /Hz | IR | Type |
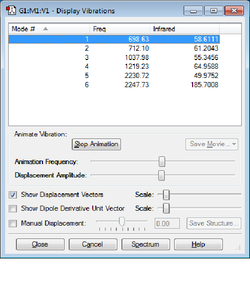
| 1 | 698.63 | 58.6111 | Bending (Wagging) |
| 2 | 712.10 | 61.2043 | Bending (Rocking) |
| 3 | 1037.98 | 55.3456 | Bending (Scissoring) |
| 4 | 1219.23 | 64.9588 | Scissoring Bend and Stretch |
| 5 | 2230.72 | 49.9752 | Symmetric Stretch |
| 6 | 2247.73 | 185.7008 | Asymmetric Stretch |
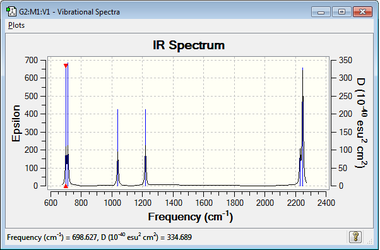
All of the above are associated with a change in dipole moment in silanone and are therefore IR active. None of the modes are degenerate so six distinct vibrational frequencies are expected (Figure 5). The wide peaks at both ends of the spectrum are two unresolved peaks - the low frequency 'doublet' corresponds to Modes 1 and 2 and the peak at around 2200cm-1 are Modes 5 and 6.
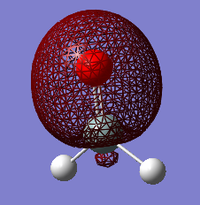
Charges
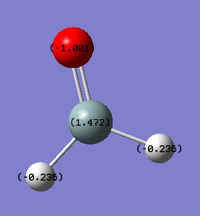
The relative charge distributions on the atoms as calculated by Gaussain are shown below;
| Relative Charge | ||
|---|---|---|
| Si | H | O |
| 1.472 | -1.001 | -0.236 |
The sum of the charges is again zero, which is consistent theoretically as the molecule has no overall charge (Figure 6). Oxygen is, relative to the other atoms, the most electronegative (3.44 on the Pauling Scale) and is thus assigned the most negative charge value. Silicon has the lowest electronegativity (1.9 on the Pauling Scale)[2] and has a positive charge distribution. The hydrogen atoms have an electronegativity between the two, accounting for the charge distribution.
Molecular Orbitals
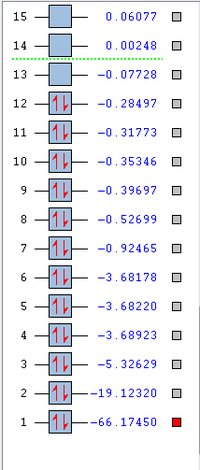
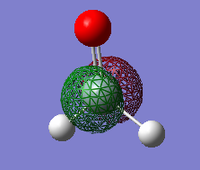
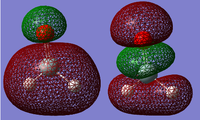
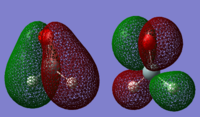
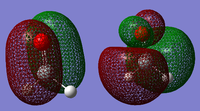
The electronic energy levels of the molecule is shown in Figure 7. The following are some of the molecular orbitals of silanone;
Detailed knowledge of fragment point groups should allow better analysis.
Reaction Energy Consideration - Silanone Synthesis
The following process converts ethylene oxide and silylene into silanone and ethene in SF6 bath gas;[4]
H4C2O + H2Si → H2SiO + H4C2
The energy change of the reaction can be predicted using the energies of the molecules as calculated by Gaussian. The following table summarises the energies of the molecules computed in Gaussian.
| Energy /a.u. | |||
|---|---|---|---|
| E(H4C2O) | E(H2Si) | E(H2SiO) | E(H4C2) |
| -153.79194941 | -290.61526271 | -365.90001403 | -78.59380796 |
Relevant .log files:
The total energy change of the process is thus;
ΔE = [ E(H4C2) + E(H2SiO) ] - [ E(H2Si) + E(H4C2O) ]
= ( -78.59380796 - 365.90001403 ) - ( -290.61526271 - 153.79194941 )
= -0.08660987 a.u. = -227.394 kJ·mol−1
The first calculations used to predict this reaction, executed at the MP2 and QCISD levels of theory using 6-31G basis, gave a value of -61.8kcal·mol−1, or -258.57kJ·mol−1.[5] Both suggest a highly exothermic reaction, however without an experimental value for comparison no conclusions can be drawn.
References
- ↑ P. Atkins and J. de Paula, Atkins' Physical Chemistry, Tenth Edition, 2014, 416.
- ↑ 2.0 2.1 J.E. Huheey, E.A. Keiter, and R.L. Keiter, Inorganic Chemistry : Principles of Structure and Reactivity, 4th edition, HarperCollins,1993.
- ↑ K. T. Klemola, Chem. Eng. Ed., 48 (2), 2014, 115–120.
- ↑ R. Becerra, J. P. Cannady, O. Goulder, R. Walsh, J. Phys. Chem. A, 114 (2), 2010, 784–793.
- ↑ Y. Apeloig, S. Sklenak, Can. J. Chem., (78), 2000, 1496–1510.

