ICL:zl4817
BH3 Molecule
Link: LZY_BH3_OPT_FREQ.LOG
Summary Table
B3LYP/6-31G(d.p) level
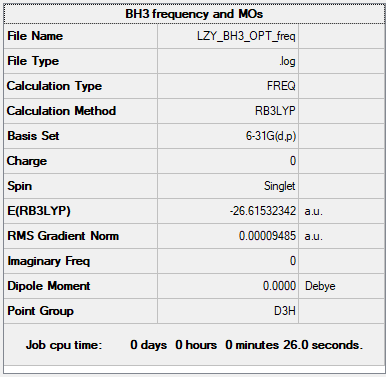
Figure 1: Summary Table of BH3
Item Table
 Item                     Value     Threshold  Converged?
 Maximum Force            0.000190     0.000450     YES
 RMS     Force            0.000095     0.000300     YES
 Maximum Displacement     0.000747     0.001800     YES
 RMS     Displacement     0.000374     0.001200     YES
Frequency Analysis
Low frequencies ---   -0.2260   -0.1035   -0.0054   48.0331   49.0927   49.0932
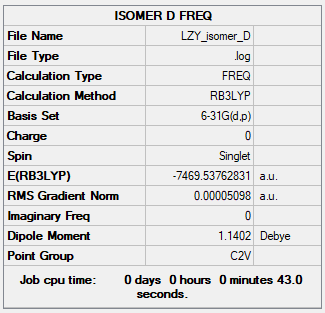
Low frequencies --- 1163.7226 1213.6716 1213.6743
Jmol Dynamic Image
BH3 |
Table of Vibrational Modes
| Wavenumber (cm-1 | Intensity (a.u.) | Symmetry Point Group | IR active? | Vibrational Mode |
| 1163 | 92 | A2'' | yes | out-of-plane bend |
| 1213 | 14 | E' | yes | bend |
| 1213 | 14 | E' | yes | bend |
| 2580 | 0 | A1' | no | symmetric stretch |
| 2713 | 126 | E' | yes | asymmetric stretch |
| 2713 | 126 | E' | yes | asymmetric stretch |
IR Spectrum
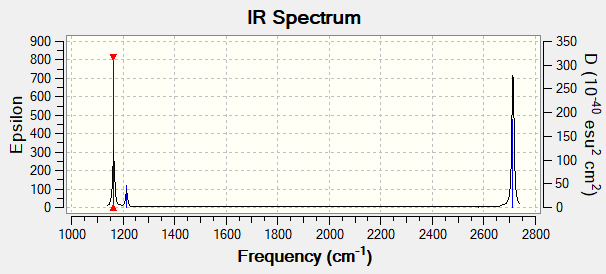
Figure 2: BH3 Proposed IR Spectrum by Gaussian
Explanation for Number of Peaks in Spectrum
There are two sets of degenerate vibrations at 1213 cm-1 (bend) and 2713 cm-1 (asymmetric stretch). A maximum of 4 signals will appear on the spectrum.
Moreover, the vibration mode at 2580 cm-1 is a symmetric stretch, which is IR inactive.
Hence only three signals are found in the IR spectrum.
MO Diagram of BH3
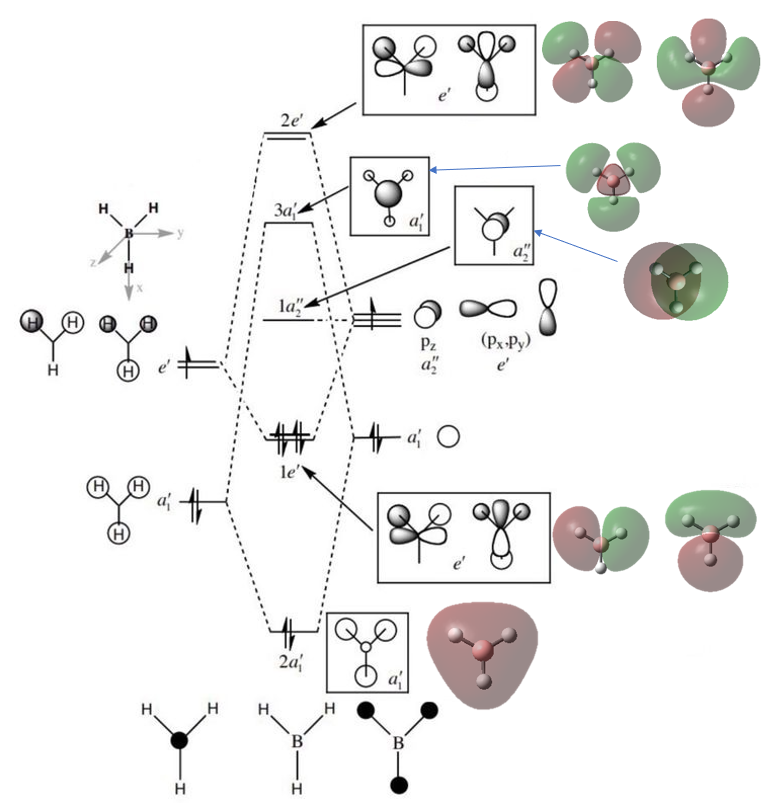
Figure 3: BH3 LCAO and 'Real' MO Diagram
The MOs of BH3 produced by LCAO (black and white) and MOs produced by Gaussian Calculation (coloured) are shown in the above diagram.[1]
There are some small differences between the LCAO MO diagram and the 'real' diagrams performed by Gaussian.
- In-phase orbitals in 'real' MOs merge together to form a joint orbital. However, individual orbitals in the LCAO diagram remain separate.
Ng611 (talk) 21:12, 5 June 2019 (BST) How significant do you think this is?
- The 'real' MOs accounts for repulsion between orbital, which are shown by slightly bent p orbitals.
Ng611 (talk) 21:12, 5 June 2019 (BST) Yes although we sometimes mark orbitals as being 'polarised' off atomic centres.
Comparing the results, we may conclude that the LCAO diagram shows the 'real' spatial electron density distribution in a relatively accurate manner.
NH3 Molecule
Link: LZY_NH3_FREQ_2.LOG
Ng611 (talk) 21:13, 5 June 2019 (BST) This is your opt+freq file, not your freq .log file.
Summary Table
B3LYP/6-31G(d.p) level
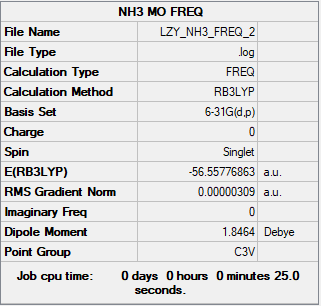
Figure 4: NH3 Summary Table
Item Table
 Item                     Value     Threshold  Converged?
 Maximum Force            0.000006     0.000450     YES
 RMS     Force            0.000004     0.000300     YES
 Maximum Displacement     0.000013     0.001800     YES
 RMS     Displacement     0.000008     0.001200     YES
Frequency Analysis
Low frequencies ---  -11.3135  -11.2772   -0.0036    0.0250    0.1442   25.7141
Low frequencies --- 1089.6627 1694.1740 1694.1743
Jmol Dynamic Image
NH3 |
NH3BH3 Molecule
Link: LZY_NH3BH3_FREQ.LOG
Summary Table
B3LYP/6-31G(d.p) level
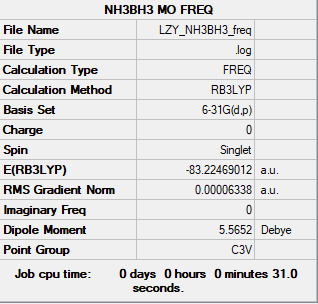
Figure 5: NH3BH3 Summary Table
Item Table
Item                     Value     Threshold  Converged?
Maximum Force            0.000113     0.000450     YES
RMS     Force            0.000063     0.000300     YES
Maximum Displacement     0.000616     0.001800     YES
RMS     Displacement     0.000354     0.001200     YES
Frequency Analysis
Low frequencies ---   -0.0615   -0.0457   -0.0066   21.6949   21.7008   40.5895
Low frequencies ---  266.0361  632.3691  640.1428
Jmol Dynamic Image
NH3BH3 |
Association Energy Analysis
E(NH3)= -56.55777 au
E(BH3)= -26.61532 au
E(NH3BH3)= -83.22469 au
ΔE=E(NH3BH3)-[E(NH3)+E(BH3)] = -0.05160 au = -0.05160 ÷ 0.0004 kJ/mol = -129 kJ/mol (1 kJ/mol = 0.0004 au) [2]
Ng611 (talk) 21:14, 5 June 2019 (BST) You've used the wrong conversion factor (1 kJ/mol = 0.00038 a.u.) and your final answer is off by a few kJ/mol. Otherwise, great calculation.
Hence, N-B dative bond energy is -129 kJ/mol.
It is much weaker than a normal N-B sigma bond (-377.9 kJ/mol).[3]
NI3 Molecule
Link: LZY_NI3_FREQ.LOG
Summary Table
B3LYP/Gen level
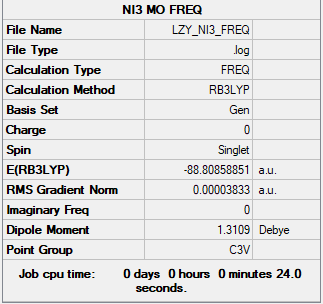
Figure 6: NI3 Summary Table
Item Table
 Item                     Value     Threshold  Converged?
 Maximum Force            0.000064     0.000450     YES
 RMS     Force            0.000038     0.000300     YES
 Maximum Displacement     0.000486     0.001800     YES
 RMS     Displacement     0.000277     0.001200     YES
Frequency Analysis
Low frequencies ---  -12.7375  -12.7314   -6.2899   -0.0039    0.0188    0.0633
Low frequencies ---  101.0325  101.0332  147.4122
Jmol Dynamic Image
NI3 |
- N-I bond distance: 2.184 Å
Project: Lewis Acids and Bases
Different Al2Cl4Br2 Isomers
Isomer A
Ng611 (talk) 21:17, 5 June 2019 (BST) You've forgotten to use pseudopotentials in all of you calculations in this section.
Link: LZY_ISOMER_A_2.LOG
Molecular Diagram
Figure 7: Isomer A
Summary Table
B3LYP/6-31G(d.p)
Figure 8: Isomer A Summary Table
Item Table
Item                     Value        Threshold  Converged?
Maximum Force            0.000200     0.000450     YES
RMS     Force            0.000094     0.000300     YES
Maximum Displacement     0.000826     0.001800     YES
RMS     Displacement     0.000375     0.001200     YES
Frequency Analysis
Low frequencies ---   -2.7897   -2.7222   -0.0167    0.0065    0.0076    3.3444
Low frequencies ---   11.5302   65.3796   88.6180
Jmol Dynamic Image
ISOMER A |
Isomer B
Link: LZY_ISOMER_B.LOG
Molecular Diagram
Figure 9: Isomer B
Summary Table
B3LYP/6-31G(d.p)
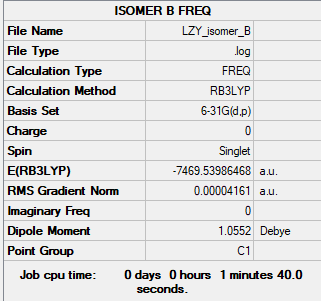
Figure 10: Isomer B Summary Table
Item Table
Item                        Value     Threshold  Converged?
 Maximum Force            0.000080     0.000450     YES
 RMS     Force            0.000031     0.000300     YES
 Maximum Displacement     0.000744     0.001800     YES
 RMS     Displacement     0.000314     0.001200     YES
Frequency Analysis
Low frequencies ---   -3.7545   -0.0084   -0.0076    0.0055    2.9743    5.3976
Low frequencies ---   15.0735   58.8033   81.4340
Jmol Dynamic Image
ISOMER B |
Isomer C
Link: LZY_ISOMER_C_1.LOG
Molecular Diagram
Figure 11: Isomer C
Summary Table
B3LYP/6-31G(d.p)
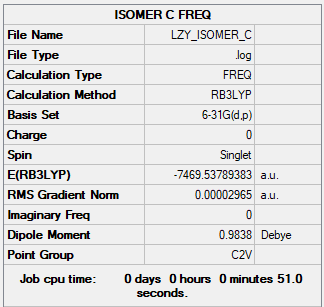
Figure 12: Isomer C Summary Table
Item Table
Item                     Value       Threshold  Converged?
Maximum Force            0.000085     0.000450     YES
RMS     Force            0.000030     0.000300     YES
Maximum Displacement     0.000753     0.001800     YES
RMS     Displacement     0.000244     0.001200     YES
Frequency Analysis
Low frequencies ---   -1.8103   -0.0157   -0.0134   -0.0124    3.1304    3.1724
Low frequencies ---   13.1236   54.3351   73.8370
Jmol Dynamic Image
ISOMER C |
Isomer D
Link: LZY_ISOMER_D.LOG
Molecular Diagram
Figure 13: Isomer D
Summary Table
B3LYP/6-31G(d.p)
Figure 14: Isomer D Summary Table
Item Table
Item                     Value        Threshold  Converged?
Maximum Force            0.000096     0.000450     YES
RMS     Force            0.000029     0.000300     YES
Maximum Displacement     0.001637     0.001800     YES
RMS     Displacement     0.000724     0.001200     YES
Frequency Analysis
Low frequencies ---   -8.9580   -3.9751   -3.5921   -0.0122   -0.0093   -0.0075
Low frequencies ---   16.2873   53.6939   79.7829
Jmol Dynamic Image
ISOMER D |
Isomer E
Link: LZY_ISOMER_E.LOG
Molecular Diagram
Figure 15: Isomer E
Summary Table
B3LYP/6-31G(d.p)
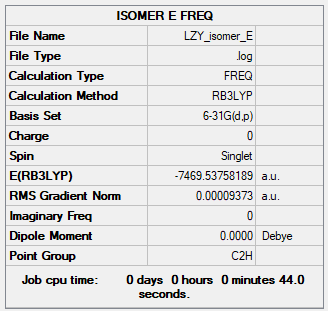
Figure 16: Isomer E Summary Table
Item Table
Item                     Value        Threshold  Converged?
Maximum Force            0.000208     0.000450     YES
RMS     Force            0.000056     0.000300     YES
Maximum Displacement     0.000699     0.001800     YES
RMS     Displacement     0.000265     0.001200     YES
Frequency Analysis
Low frequencies ---   -4.5056   -2.1615    0.0048    0.0063    0.0067    3.1231
Low frequencies ---   15.1154   52.1657   73.8402
Jmol Dynamic Image
ISOMER E |
Symmetry and Energy of Al2Cl4Br2 Isomers
Observations
When both bridging ions are Br, the molecule has highest stability.
The stability decreases when one of the bridging ions is replaced by Cl, and is lowest when both of the bridging ions are Cl.
Explanations
The Al-X-Al bridging bond (X = Br or Cl) consists of a σ-type bond, and a dative bond with X as the electron donor (as shown in the figure below).
The strength of the Al-X-Al bond is proportional to the orbital overlap efficiency between Al and X, and the bond strength is in turn proportional to the relative stability of the complex molecule. [4]
Br is lower in Group 17, hence it has larger and more diffuse orbitals, making the orbital overlap with Al more efficient. In contrast, Cl is higher in Group 17 and it is very electronegative. Hence, it has a smaller radius and its nucleus holds its electrons tightly.
Therefore, we may conclude the Al-Br-Al bonding provides greater stability than the Al-Cl-Al one.
Ng611 (talk) 21:22, 5 June 2019 (BST) Because of your incorrect pseudopotential input, you've (incorrectly) calculated that the D2h (bridging Br) structure is more stable. In fact, the opposite is true.
Figure 17: A General Structure of Dimer Complex
Dissociation of the Lowest-Energy Conformer into 2 AlCl2Br
Link: LZY_ISOMER_HALF_1.LOG
Summary Table
B3LYP/6-31G(d.p)
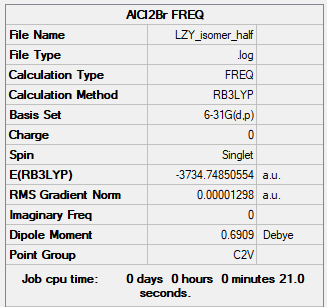
Figure 18: AlCl2Br Summary Table
Item Table
Item                     Value        Threshold  Converged?
Maximum Force            0.000028     0.000450     YES
RMS     Force            0.000013     0.000300     YES
Maximum Displacement     0.000083     0.001800     YES
RMS     Displacement     0.000048     0.001200     YES
Frequency Analysis
Low frequencies ---   -3.3374   -1.9339    0.0130    0.0138    0.0142    4.7835
Low frequencies ---  125.0015  137.4966  194.8482
Jmol Dynamic Image
AlCl2Br |
Comparison of Energy
Isomer A is the conformer with the lowest energy.

When the dimer dissociates into two molecules of AlCl2Br, 2 Al-Br bonds are lost.
The energy of one molecule of AlCl2Br is calculated to be -9336871 kJ/mol by Gaussian.
Hence, the sum of energy of two AlCl2Br molecules is -18673743 kJ/mol which is 114 kJ/mol higher relative to the energy of Isomer A.
As breaking bonds involves absorption of energy[5], each Al-Br bond broken increases total energy by 57 kJ/mol.
This explains why the dimer is more stable than the dissociated monomers.
Ng611 (talk) 21:23, 5 June 2019 (BST) e.c.f for calculation.
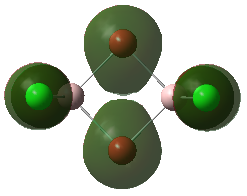
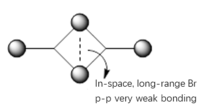
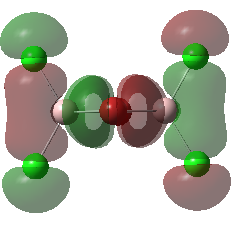
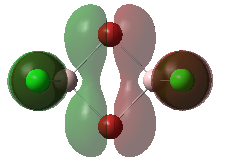
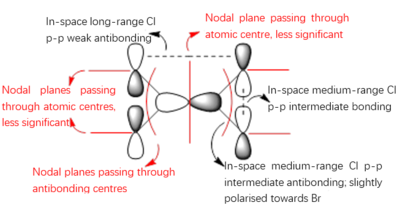
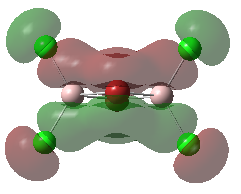
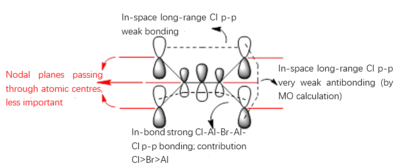
Molecular Orbitals of the Conformer with Lowest Energy
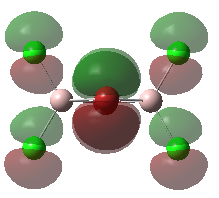
The lowest-energy conformer is Isomer A. There are 24 occupied valence molecular orbitals in total.
Three among them are selected, analysed and arranged in order by their extent of bonding/antibonding character.
Atom colour label: pink - Al, green - Cl, red - Br
Ng611 (talk) 21:25, 5 June 2019 (BST) Excellent LCAO analysis! Very neatly laid-out and well annontated. Well done!
References
- ↑ http://www.huntresearchgroup.org.uk/teaching/teaching_comp_lab_year2a/Tut_MO_diagram_BH3.pdf .
- ↑ http://www.huntresearchgroup.org.uk/teaching/teaching_comp_lab_year2a/4b_better_basis.html .
- ↑ E.R. Cohen, T. Cvitas, J.G. Frey, B. Holmström, K. Kuchitsu, R. Marquardt, I. Mills, F. Pavese, M. Quack, J. Stohner, H.L. Strauss, M. Takami, and A.J. Thor, Quantities, Units and Symbols in Physical Chemistry, IUPAC Green Book, Third Edition, Second Printing, IUPAC & RSC Publishing, Cambridge (2008)
- ↑ C. Barnes, Inorganic Chemistry (Housecroft, Catherine E.; Sharpe, Alan G.), J. Chem. Educ., 2003, 80, 747.
- ↑ Peter Atkins and Julio de Paula, Physical Chemistry (8th ed., W.H. Freeman 2006), p.809 ISBN 0-7167-8759-8

