ICL:mz5717
BH3
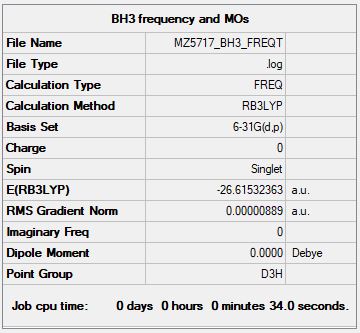
Borane BH3
B3LYP/6-31G(d.p) level
       Item                Value       Threshold  Converged?
 Maximum Force            0.000018     0.000450      YES
 RMS     Force            0.000009     0.000300      YES
 Maximum Displacement     0.000070     0.001800      YES
 RMS     Displacement     0.000035     0.001200      YES
Frequency analysis log file MZ5717_BH3_FREQ.log
Low frequencies ---  -10.3498   -3.4492   -1.2454   -0.0055    0.4779    3.2165
Low frequencies --- 1162.9519 1213.1527 1213.1554
BH3 |
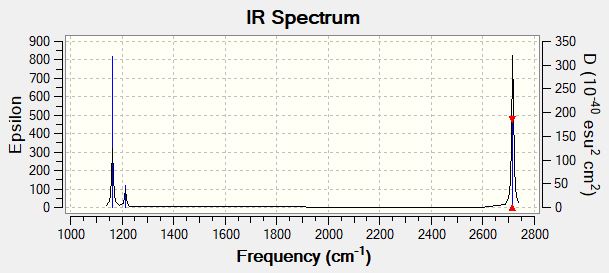
Vibrational Spectrum for BH3
| wavenumber (cm-1 | Intensity (arbitrary units) | symmetry | IR active? | type |
| 1163 | 93 | A2'' | yes | out-of-plane bend |
| 1213 | 14 | E' | yes | bend |
| 1213 | 14 | E' | yes | bend |
| 2582 | 0 | A1' | no | symmetric stretch |
| 2716 | 126 | E' | yes | asymmetric stretch |
| 2716 | 126 | E' | yes | asymmetric stretch |
First of all there are two sets of degenerate vibrations at 1213 and 2716 cm-1, therefore there should be at most 4 signals. Furthermore, the vibration mode at 2582 cm-1 is a symmetric stretch, which means that it is not IR active. Thus there are only three signals present in the IR spectrum.
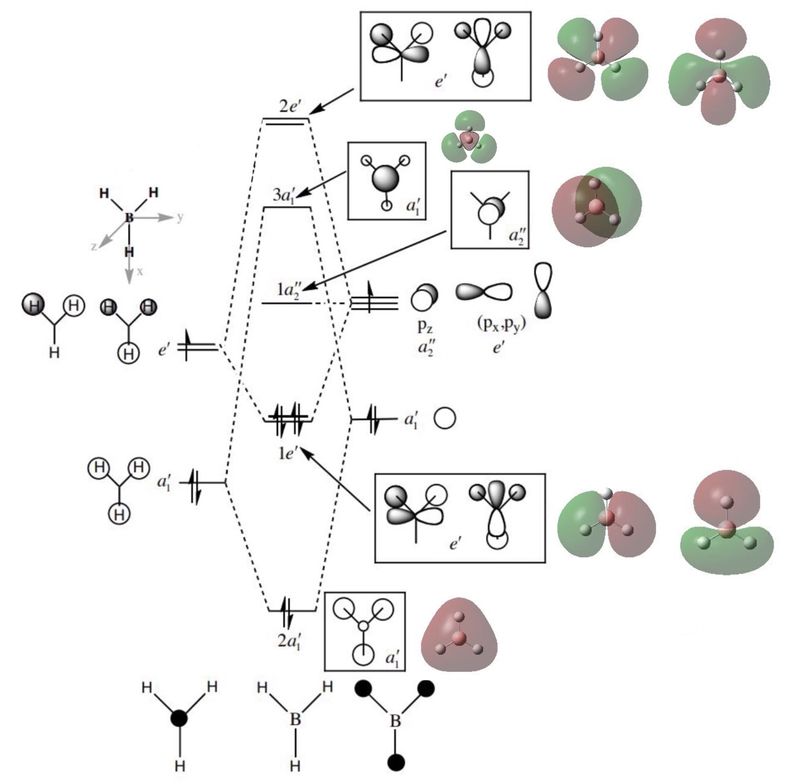
Molecular Orbital Diagram for BH3
The MO of BH3 produced by LCAO as well as the ones calculated by Gaussian. [1]
Here are some minor differences between the LCAO MO diagram and the calculated 'real' diagram:
- In-phase orbitals in the 'real' diagram merge together while all difference orbitals in the LCAO diagram are separate
- The 'real' diagram accounts for orbital repulsion (shown by certain slightly bent p orbitals)
It is reasonable to say that the LCAO diagram represents the 'real' spatial distribution of electrons to a good extent.
Really well-presented MO diagram with both the LCAO and calculated MOs. Good attempt at considering the differences, however, the separate orbitals in the LCAO are more just a convention of drawing. You correctly consider that the contributions are not predicted well by the LCAO approach but could have explained it better and considered an example e.g. the 3a1' MO. Smf115 (talk) 09:39, 30 May 2019 (BST)
Association Energy of NH3BH3
Below is the key information of NH3 and NH3BH3.
| Name | Method & Basis Set | Summary Table | 'Item' Table | Low Frequencies | Jmol Image | LOG File | |||
| NH3 | B3LYP/6-31G(d.p) | 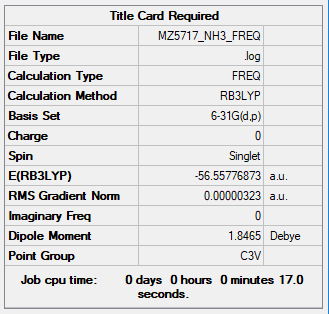
|
Item Value Threshold Converged? Maximum Force 0.000006 0.000450 YES RMS Force 0.000004 0.000300 YES Maximum Displacement 0.000014 0.001800 YES RMS Displacement 0.000009 0.001200 YES |
Low frequencies --- -0.0129 -0.0019 0.0014 7.1032 8.1046 8.1049 Low frequencies --- 1089.3834 1693.9368 1693.9368 |
|
MZ5717_NH3_FREQ.LOG | |||
| NH3BH3 | B3LYP/6-31G(d.p) | 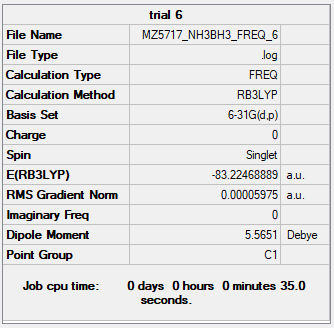
|
Item Value Threshold Converged? Maximum Force 0.000115 0.000450 YES RMS Force 0.000060 0.000300 YES Maximum Displacement 0.000579 0.001800 YES RMS Displacement 0.000345 0.001200 YES |
Low frequencies --- 0.0005 0.0009 0.0011 16.8742 17.0939 37.4795 Low frequencies --- 265.8773 632.2052 639.3279 |
|
MZ5717_NH3BH3_FREQ.LOG |
E(NH3)= -56.55777 au
E(BH3)= -26.61532 au
E(NH3BH3)= -83.22469 au
ΔE=E(NH3BH3)-[E(NH3)+E(BH3)] = -0.05160 au = -0.05160 ÷ 0.0004 kJ/mol = -129 kJ/mol [2]
Therefore, the energy of the N-B dative bond is -129 kJ/mol. Compared to a normal N-B sigma bond (-377.9 kJ/mol) [3], it is rather weak.
Correct calculation and a relevant (and referenced) comparison, good! However, you shouldn't have converted the truncated a.u. value to kJmol-1, the raw value should be converted and then rounded. Excellent consideration of the accuracy of the final reported values though. Smf115 (talk) 09:43, 30 May 2019 (BST)
NI3
Nitrogen Triiodide NI3
B3LYP/Gen level
         Item              Value      Threshold  Converged?
 Maximum Force            0.000088     0.000450     YES
 RMS     Force            0.000044     0.000300     YES
 Maximum Displacement     0.000858     0.001800     YES
 RMS     Displacement     0.000481     0.001200     YES
Frequency log file MZ5717_NI3_FREQ.log
Low frequencies ---  -12.3847  -12.3783   -5.6131   -0.0040    0.0194    0.0711
Low frequencies ---  100.9307  100.9314  147.2333
NI3 |
N-I bond distance: 2.184 Å
Project: Lewis Acids and Bases
Key Information of Isomers of Al2Cl4Br2
| Isomer | Method & Basis Set | Summary Table | 'Item' Table | Low Frequencies | Jmol Image | LOG File | |||
| Isomer A | B3LYP/6-31G(d.p) | 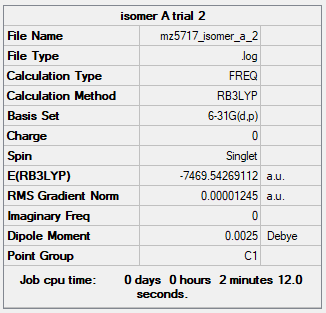
|
Item Value Threshold Converged? Maximum Force 0.000023 0.000450 YES RMS Force 0.000010 0.000300 YES Maximum Displacement 0.001018 0.001800 YES RMS Displacement 0.000411 0.001200 YES |
Low frequencies --- -2.3637 -2.2675 -0.9862 -0.0060 0.0068 0.0107 Low frequencies --- 11.7171 65.3709 88.4194 |
|
MZ5717_ISOMER_A_OPTFREQ.LOG | |||
| Isomer B | B3LYP/6-31G(d.p) | 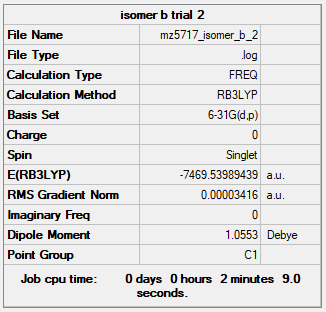
|
Item Value Threshold Converged? Maximum Force 0.000057 0.000450 YES RMS Force 0.000026 0.000300 YES Maximum Displacement 0.001712 0.001800 YES RMS Displacement 0.000699 0.001200 YES |
Low frequencies --- -0.0099 -0.0086 -0.0074 1.5771 1.8810 2.5290 Low frequencies --- 14.5085 58.5774 81.4258 |
|
MZ5717_ISOMER_B_OPTFREQ.LOG | |||
| Isomer C | B3LYP/6-31G(d.p) | 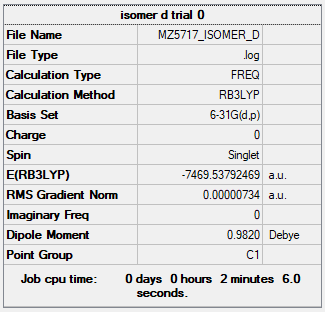
|
Item Value Threshold Converged? Maximum Force 0.000013 0.000450 YES RMS Force 0.000005 0.000300 YES Maximum Displacement 0.000452 0.001800 YES RMS Displacement 0.000186 0.001200 YES |
Low frequencies --- -0.0083 -0.0073 0.0107 0.8196 1.4180 1.6409 Low frequencies --- 13.4390 54.4089 73.7274 |
|
MZ5717_ISOMER_C_OPTFREQ.LOG | |||
| Isomer D | B3LYP/6-31G(d.p) | 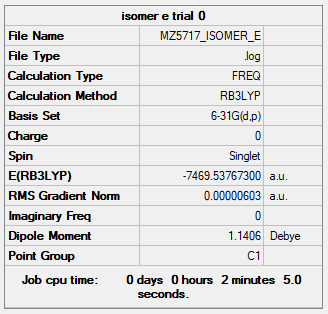
|
Item Value Threshold Converged? Maximum Force 0.000008 0.000450 YES RMS Force 0.000004 0.000300 YES Maximum Displacement 0.001743 0.001800 YES RMS Displacement 0.000677 0.001200 YES |
Low frequencies --- -2.1170 -1.5946 -1.4299 -0.0050 0.0035 0.0086 Low frequencies --- 17.7661 54.4445 79.9169 |
|
MZ5717_ISOMER_D_OPTFREQ.LOG | |||
| Isomer E | B3LYP/6-31G(d.p) | 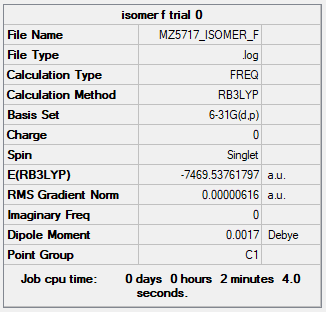
|
Item Value Threshold Converged? Maximum Force 0.000017 0.000450 YES RMS Force 0.000007 0.000300 YES Maximum Displacement 0.001743 0.001800 YES RMS Displacement 0.000637 0.001200 YES |
Low frequencies --- -2.1765 -1.5548 -0.0043 0.0027 0.0110 0.3832 Low frequencies --- 14.8169 52.4385 73.7073 |
|
MZ5717_ISOMER_E_OPTFREQ.LOG |
Geometry and Energy of Isomers of Al2Cl4Br2
When the bridging ions are both Br, the stability of the molecule is highest. The stability decreases if one of the bridging ions is replaced with Cl, and is lowest when both the bridging ions are Cl. Let the bridging ion be X, then the Al-X-Al bond consists of a normal sigma bond, and a dative bond with X as the donor (as shown in the figure below). The strength of the Al-X-Al bond, therefore the stability of the molecule, depends on the extent of orbital overlap between Al and X. Br has larger and more diffuse orbitals, making the overlap more efficient. On the other hand, Cl is highly electronegative, having a smaller radius and holding its electrons tightly towards the core. Thus the Al-Br-Al bonding provides greater stability than the Al-Cl-Al one.
Impressive analysis of all the conformers and your justification of the relative stabilities is well considered and clear! However, the only issue with the structures is that the Pseudopotential should have been used on the Br, resulting in the incorrect energies for all the structures. Also note that you should have also submitted frequency log files only and not opt freq, as this is best practice, and the symmetries of the conformers aren't correct. Smf115 (talk) 22:50, 30 May 2019 (BST)
Dissociation of the Lowest-Energy Conformer into 2AlCl2Br
| Name | Method & Basis Set | Summary Table | 'Item' Table | Low Frequencies | Jmol Image | LOG File | |||
| AlCl2Br | B3LYP/6-31G(d.p) | 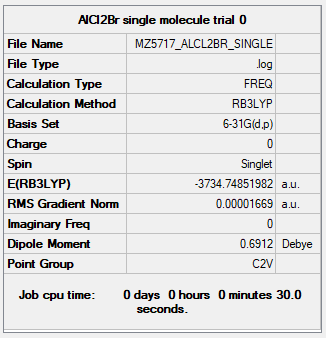
|
Item Value Threshold Converged? Maximum Force 0.000021 0.000450 YES RMS Force 0.000014 0.000300 YES Maximum Displacement 0.000166 0.001800 YES RMS Displacement 0.000104 0.001200 YES |
Low frequencies --- -0.0103 0.0079 0.0095 1.9597 1.9884 2.9284 Low frequencies --- 125.3109 137.4204 194.7945 |
|
MZ5717_ALCL2BR_FREQ.LOG |
When  dissociates into two molecules of AlCl2Br, we lose two Al-Br bonds.
The energy of one molecule of AlCl2Br is calculated to be -9336871 kJ/mol.
Therefore, the total energy of two such molecules is -18673743 kJ/mol, which is +114 kJ/mol relative to the energy of Isomer A, the lowest-energy isomer.
Each Al-Br broken means raising the total energy by 57 kJ/mol. It is evident that the dimer is considerably more stable than the separated monomers.
Molecular Orbitals of the Lowest-Energy Conformer
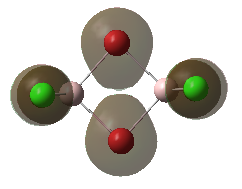
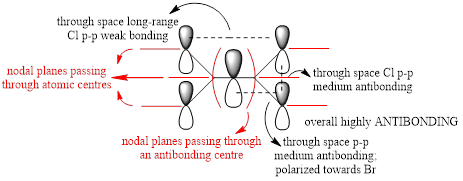
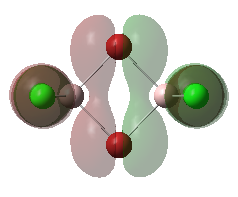
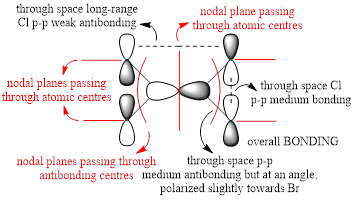
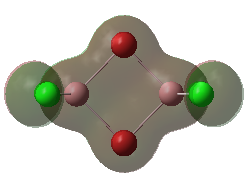
For the lowest-energy conformer,  , there are 24 filled valence molecular orbitals in total. Below are three of them, ranked by their extent of bonding/antibonding character.
Atom colour code: pink - Al, red - Br. green - Cl.
| MO | Front View | Top View | Front View | Top View | Bonding/Antibonding Nature |
| MO No.1 | 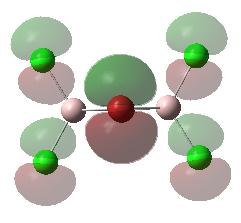
|
|
|

|
Highly ANTIBONDING |
| MO No.2 | 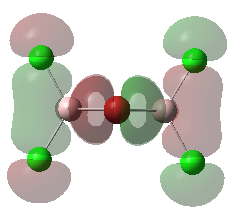
|
|
|

|
Mainly BONDING |
| MO No.3 | 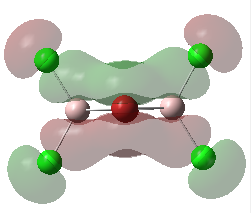
|
|

|

|
Highly BONDING |
Overall, a good MO analysis and you've highlighted the main interactions and nodal planes in the MO and the LCAOs are all correct. To improve, the two terminal ends of the dimers are probably too far apart for there to be any interactions between them. It would have also been good to see you try to use one MO diagram to display them and you should have numbered the MOs you studied. Smf115 (talk) 23:02, 30 May 2019 (BST)
Overall, a very good report with some good analysis sections throughout. Smf115 (talk) 23:02, 30 May 2019 (BST)
References
- ↑ LCAO MO diagram from http://www.huntresearchgroup.org.uk/teaching/teaching_comp_lab_year2a/Tut_MO_diagram_BH3.pdf .
- ↑ 1 kJ/mol = 0.0004 au conversion from http://www.huntresearchgroup.org.uk/teaching/teaching_comp_lab_year2a/4b_better_basis.html .
- ↑ Cite error: Invalid
<ref>tag; no text was provided for refs namedNB bond

