ICC2 01053372
EX3 Section
BH3
Method & Basis Set
RB3LYP
6-31G(d,p)
Summary Table

Item Table
        Item               Value     Threshold  Converged?
 Maximum Force            0.000006     0.000450     YES
 RMS     Force            0.000004     0.000300     YES
 Maximum Displacement     0.000022     0.001800     YES
 RMS     Displacement     0.000015     0.001200     YES
 Predicted change in Energy=-1.868217D-10
 Optimization completed.
    -- Stationary point found.
Frequency .log File
Low Frequency Analysis
Low frequencies ---   -2.2126   -1.0751   -0.0055    2.2359   10.2633   10.3194
Low frequencies --- 1162.9860 1213.1757 1213.1784
Frequency Table
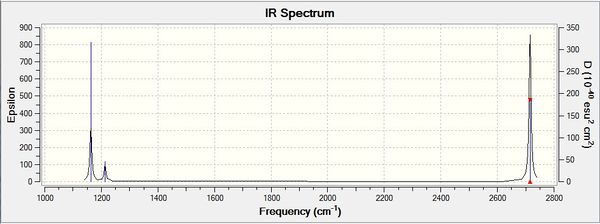
| wavenumber (cm-1 | Intensity (arbitrary units) | symmetry | IR active? | type |
| 1163 | 93 | A2 | yes | out-of-plane bend |
| 1213 | 14 | E | yes | bend |
| 1213 | 14 | E | yes | bend |
| 2582 | 0 | A1 | no | symmetric stretch |
| 2700 | 126 | E | yes | asymmetric stretch |
| 2715 | 126 | E | yes | asymmetric stretch |
IR Spectrum
There are only 3 peaks produced from 6 different vibrations. This can be explained by the fact that two pairs of degenerate vibrations (the vibrations at 2715-1, and the vibrations at 1213 -1) which will each produce only one IR peak, as they abosrb at the same energy. Also the vibration at 2582cm-1 is symmetric and therefore IR inactive, it does not absorb IR radiation. This reduces the 6 vibrations to only 3 observed peaks
MO Diagram
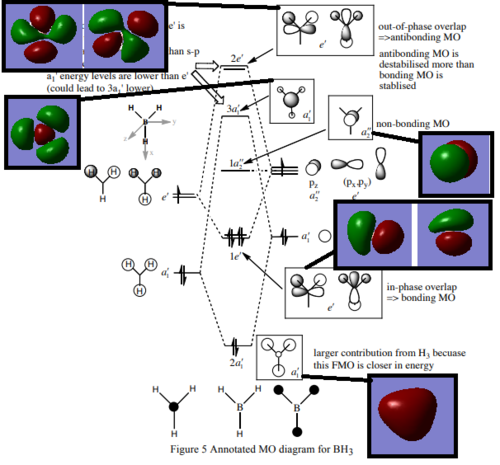
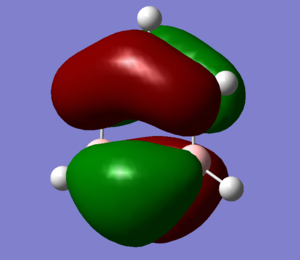
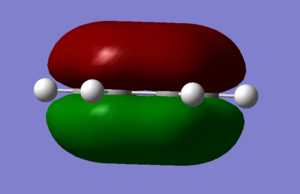
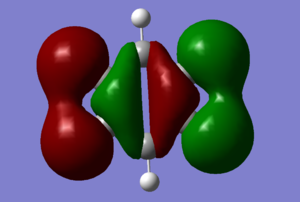
Q: Are there any significant differences between the real and LCAO MOs? What does this say about the accuracy and usefulness of qualitative MO theory?
There are no major differences between the MO we calculated and the MO's produced from LCAO. This suggests that for the basic shape and structure of MO's, LCAO is an accurate and useful method. However LCAO assumes that only neighboring orbitals contribute to a MO. In reality all AO from the system contribute to form all the MO's, which explains the small differences between the LCAO and calculated MO's
Dynamic Image
BH3 |
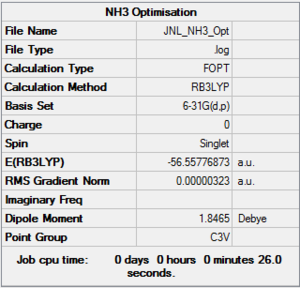
NH3
Method & Basis Set
RB3LYP
6-31G(d,p)
Summary Table
Item Table
        Item               Value     Threshold  Converged?
 Maximum Force            0.000006     0.000450     YES
 RMS     Force            0.000004     0.000300     YES
 Maximum Displacement     0.000012     0.001800     YES
 RMS     Displacement     0.000008     0.001200     YES
 Predicted change in Energy=-9.843916D-11
 Optimization completed.
    -- Stationary point found.
Frequency .log File
Low Frequency Analysis
 Low frequencies ---   -8.5646   -8.5588   -0.0044    0.0454    0.1784   26.4183
 Low frequencies --- 1089.7603 1694.1865 1694.1865
Dynamic Image
NH3 |
NH3BH3
Method & Basis Set
RB3LYP
6-31G(d,p)
Summary Table

Item Table
         Item               Value     Threshold  Converged?
 Maximum Force            0.000123     0.000450     YES
 RMS     Force            0.000058     0.000300     YES
 Maximum Displacement     0.000515     0.001800     YES
 RMS     Displacement     0.000296     0.001200     YES
 Predicted change in Energy=-1.635696D-07
 Optimization completed.
    -- Stationary point found.
Frequency .log File
Low Frequency Analysis
 Low frequencies ---   -0.0007    0.0004    0.0015   18.3844   27.7829   40.0656
 Low frequencies ---  266.4161  632.3928  639.8576
Dynamic Image
NH3BH3 |
ΔE
E(NH3)= -26.615 a.u
E(BH3)= -56.558 a.u
E(NH3BH3)= -83.225 a.u
ΔE=E(NH3BH3)-[E(NH3)+E(BH3)] = -0.052 a.u ≈ 137 kJ/mol
Q: Based on your energy calculation is the B-N dative bond weak, medium or strong? What comparison have you made to come to this conclusion?
B-N Bond dissociation energy is 377.9 ± 8.7 kJmol-1 [1] Therefore the B-N dative bond is weak compared to a diatomic B-N bond.
Ng611 (talk) 13:47, 5 June 2018 (BST) Unfortunately, you've rounded to too few decimal places (3 dp instead of 5 dp, and this has caused your final value to be off by a few kJ/mol)
BBr3
Method & Basis Set
B3LYP
B: 6-31G(d,p)
Br: LANL2DZ
Summary Table
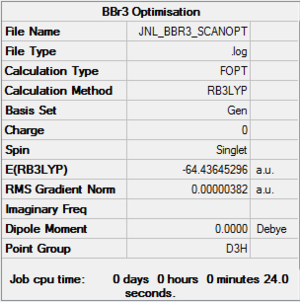
Item Table
          Item               Value     Threshold  Converged?
 Maximum Force            0.000008     0.000450     YES
 RMS     Force            0.000005     0.000300     YES
 Maximum Displacement     0.000036     0.001800     YES
 RMS     Displacement     0.000023     0.001200     YES
 Predicted change in Energy=-4.026880D-10
 Optimization completed.
    -- Stationary point found.
Frequency .log File
Low Frequencies
 Low frequencies ---   -0.0137   -0.0064   -0.0046    2.4315    2.4315    4.8421
 Low frequencies ---  155.9631  155.9651  267.7052
Dynamic Image
BBr3 |
Project
Benzene
Method & Basis Set
B3LYP 6-31G (d,p)
Summary Table
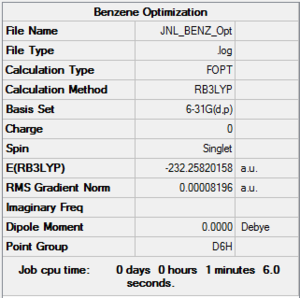
Item Table
        Item               Value     Threshold  Converged?
 Maximum Force            0.000193     0.000450     YES
 RMS     Force            0.000079     0.000300     YES
 Maximum Displacement     0.000830     0.001800     YES
 RMS     Displacement     0.000294     0.001200     YES
 Predicted change in Energy=-4.437902D-07
 Optimization completed.
    -- Stationary point found.
Frequency .log File
Low Frequencies
 Low frequencies ---  -17.2053  -14.9372  -14.9372   -0.0054   -0.0054    0.0005
 Low frequencies ---  414.1053  414.1053  620.9426
Dynamic Image
Benzene |
Borazine
Method & Basis Set
B3LYP 6-31G (d,p)
Summary Table
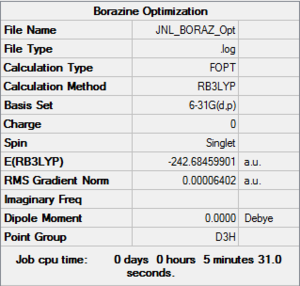
Item Table
         Item               Value     Threshold  Converged?
 Maximum Force            0.000085     0.000450     YES
 RMS     Force            0.000033     0.000300     YES
 Maximum Displacement     0.000250     0.001800     YES
 RMS     Displacement     0.000075     0.001200     YES
 Predicted change in Energy=-9.266551D-08
 Optimization completed.
    -- Stationary point found.
Frequency .log File
Low Frequencies
 Low frequencies ---    0.0004    0.0008    0.0012    3.4393    4.3291    6.8386
 Low frequencies ---  289.7037  289.7792  404.4212
Dynamic Image
Borazine |
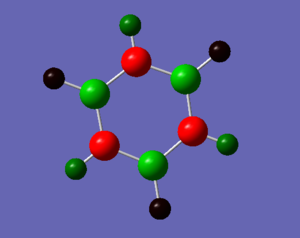
Charge Analysis

Ng611 (talk) 13:50, 5 June 2018 (BST) Good discussion of the effects of electronegativity on the overall charge distribution. What do the partial charges sum to, and is there any difference in partial charge for atoms related by symmetry?
MO Analysis
Aromaticity
The structure of Benzene, the archetypal aromatic molecule, was deduced from 3 main properties associated with it. Firstly Benzene had bond lengths which were all equal, as determined by X-Ray diffraction, and the bond length was somewhere between a double and single bond. Secondly the energy of hydrogenation was -152kJmol-1 less than would have been expected for a hexatriene, as determined by calorimetry. Finally the chemical shift for the hydrogen atoms outside of the Benzene ring were very high (7.27 ppm) compared to a typical alkene proton. Famously using this information, Kekule discovered the ring structure of alternating double and single bonds for Benzene.[3]
In this way aromaticity can be simply described as a cyclical series of pz on each atom of a system, each contributing some electron density to produce an overall delocalised cloud of electrons above and below the ring. Therefore 4 rules were empirically determined to define Aromaticity:
1) a conjugated delocalised π system (found in an alternating single-double bond pattern)
2) A flat structure
3) A Cyclical structure
4) There must be 4n + 2 π-electrons (Known as Hückel's rule) [4]
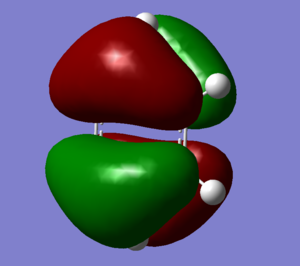
However, this description is insufficient to fully describe aromaticity. Firstly aromaticity has been observed in non-planar molecules, for example para-/meta- cyclophanes, and even 3D systems like polyhedral boranes. Additionally scientists have postulated that the σ-electron structure may have an important contribution to aromaticity, in addition to the π-electrons[5]. It can be seen from the MO's of benzene & Borazine that only 1 out of 21 corresponds directly to the overlapping pz atomic orbital description . In reality aromaticity is better understood through MO theory. For Benzene 6 pz atomic orbital combine to form 6 MO's, 3 of which are bonding orbitals and occupied. for Borazine and Benzene MO's 17, 20 & 21.
- ↑ http://staff.ustc.edu.cn/~luo971/2010-91-CRC-BDEs-Tables.pdf.
- ↑ https://en.wikipedia.org/wiki/Electronegativity
- ↑ https://www.imperial.ac.uk/media/imperial-college/research-centres-and-groups/spivey-group/teaching/org1aromatics/lecture11718.pdf
- ↑ https://en.wikipedia.org/wiki/Aromaticity
- ↑ Application of AIM Parameters at Ring Critical Points for Estimation ofp-Electron Delocalization in Six-Membered Aromatic andQuasi-Aromatic Rings, DOI: 10.1002/chem.200700250

