Hyc116
Triatomic systems
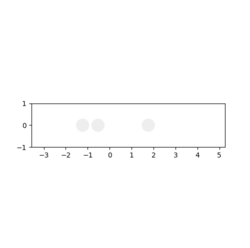
A triatomic system is used for this wiki page. In a triatomic system, an atom and a diatomic molecule collide linearly. Two example of triatomic systems are studied in this wiki page. Figure 1 illustrates the first exercise which is a H + H2 system. Figure 2 illustrates the second exercise where one of the atoms has been changed to fluorine, shown in yellow.
 |
 |
Mm10114 (talk) 16:06, 14 May 2018 (BST) It's good practice to start a report with an introduction section (I assume this section is supposed to be one, however it's not clear as it isn't called an 'Introduction'). Nevertheless, you're still lacking a more general description of what this lab is about (key objectives, methods you'll use, some expected observations or a hypothesis), with a short explanation of the key exercises (you only listed them). Adding few sentences and making it easy to follow would get you there with very little effort.
H + H2 system
Dynamics from the transition state region
Potential Energy Minimum and Transition State
What value do the different components of the gradient of the potential energy surface have at a minimum and at a transition structure? Briefly explain how minima and transition structures can be distinguished using the curvature of the potential energy surface.
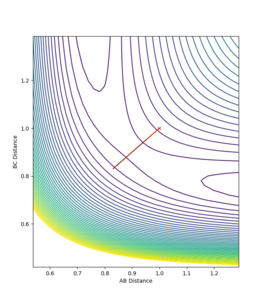
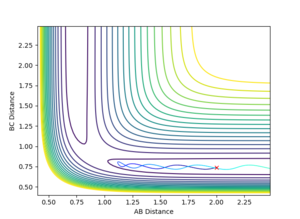
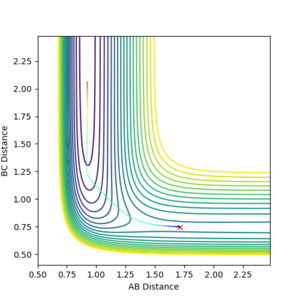
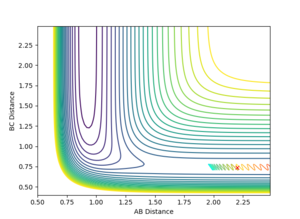
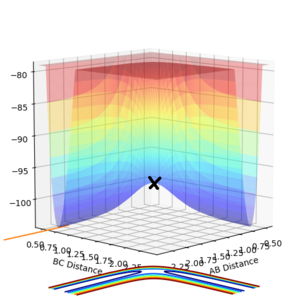
On a potential surface plot with two variables, there is a range of values where the potential energy is at a minimum in respect to a specific direction. For example, in figure 3, there is a potential minimum at about rAB = 0.8 where ∂V(rAB)/∂rAB=0. A continuous range of minima (shown in blue in figure 3) between the reactants and the products form a reaction path which is the most probable. It is worth noting how in this three-atom system, the potential energy increases when the one atom is brought closer to the other two atoms fixed in distance. A transition state is the energy maximum along the minimum energy path, positioned at the saddle point of the potential surface plot. A saddle point is a maximum with a negative curvature in one direction and a minimum with a positive curvature in all other directions.[1] On a potential surface plot of a H + H2 system shown in figure 4, the transition state is indicated with an "x". A saddle point, hence the transition state, can be identified when all three of the following requirements are fulfilled: ∂V(rAB)/∂rAB = 0, ∂V(rBC)/∂rBC = 0, and ((∂2V)/(∂rAB2))((∂2V)/(∂rBC2)) < 〖((∂2V)/∂rAB∂rBC)〗2. Whereas for a minimum, ∂V(rAB)/∂rAB = 0, ∂V(rBC)/∂rBC = 0, ∂2V/∂rAB2 > 0, and ((∂2V)/(∂rAB2))((∂2V)/(∂rBC2)) > 〖((∂2V)/∂rAB∂rBC)〗2
Minimum: ∂V(rAB)/∂rAB = 0; ∂V(rBC)/∂rBC = 0; ∂2V/∂rAB2 > 0; ((∂2V)/(∂rAB2))((∂2V)/(∂rBC2)) > 〖((∂2V)/∂rAB∂rBC)〗2
Transition state: ∂V(rAB)/∂rAB = 0; ∂V(rBC)/∂rBC = 0; ((∂2V)/(∂rAB2))((∂2V)/(∂rBC2)) < 〖((∂2V)/∂rAB∂rBC)〗2
 |
 |
Mm10114 (talk) 16:17, 14 May 2018 (BST) I think your description of the minima and transition state shows your good understanding of the potential energy surface and its topology. You provide a citation for the saddle point definition and the date you've accessed the electronic resource which is very good. I like that you provide figures to support your discussion. Few minor comments that would make this section even better: - you're lacking the unit of length for rAB when you report the value. - you could use math formatting for the partial derivatives equations you provide, it is very hard to follow without fractions formatting.
Locating the Transition State
Report your best estimate of the transition state position (rts) and explain your reasoning illustrating it with a “Internuclear Distances vs Time” plot for a relevant trajectory.
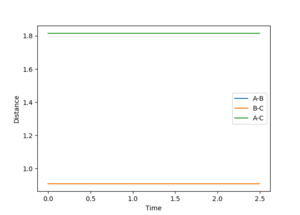
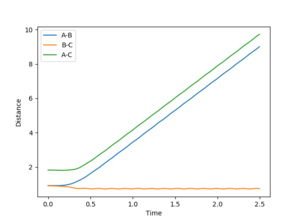
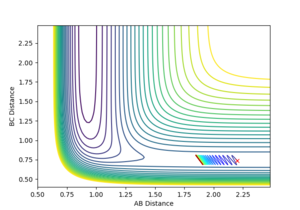
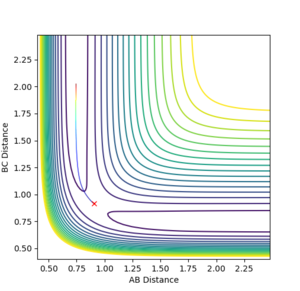
Since the H + H2 system is symmetrical, at the transition state, which can be thought as a half-formed/half-broken bond between the atoms, the distance between all three atoms should be the same so rAB = rBC. At rAB = rBC where there is no momentum in the system, the trajectory will oscillate perfectly on the ridge as shown in the contour plot in figure 3. The orange line in figure 3 represents the motion of the trajectory which oscillates about a potential minimum on the ridge. In the H + H2 system, this represents the motion where the two outer atoms come towards the middle atom, and move away again due to repulsion. The transition state is the minimum on the ridge where the system does not oscillate i.e. rts stays constant. In figure 5, the starting point where rts = 1 and momenta = 0, the rts oscillates between around 0.8 to 1; this indicates that the transition state is at a rts value between 0.8 Å and 1 Å . A number of values for the rts were tested and it was found that the transition state occurs at about rts = 0.9077425 Å. An inter-nuclear distance vs time plot shown in figure 6 confirms this by showing an equal and constant distance between Hydrogens A and B and Hydrogens B and C.
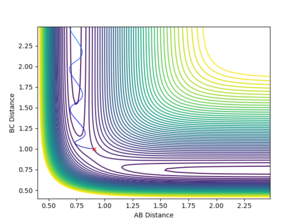
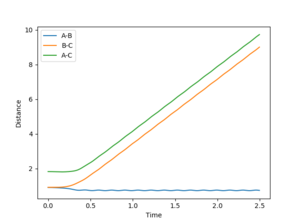
In contrast, if rAB and rBC are not equal, or if there is momentum present in the system, the trajectory will no longer be balanced on the ridge. An off-set in the starting position causes the trajectory to fall off to one of the minima, as indicated in figure 5. This can be visualised as an asymmetric oscillation of the system where eventually two neighbouring hydrogen atoms form a molecule, and the other atom moves away from the system. In figure 7, the distance between A and B oscillates whereas the distance between B and C increases, representing the formation of a bond between atoms A and B, and atom C drifts away from the system.
Mm10114 (talk) 16:28, 14 May 2018 (BST) You show a very good reasoning, shortly describe how you obtained the coordinates of the transition state and you provide all the necessary figures to support your discussion. Well done. However, you're not consistent and sometimes you provide units and sometimes you forget. Remember, it is very important to always report the unit for values you provide. I think at the beginning when you mention 'figure 3' twice, you actually mean 'figure 5'. You number figures which is very good and helps to reference them in the text. But, you have to be very careful not to mix the figures reference numbers like that.
Calculating the reaction path: Dynamics vs. MEP
Comment on how the mep and the trajectory you just calculated differ.
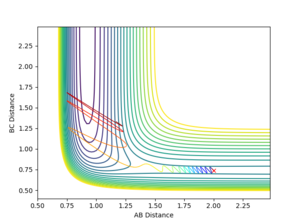
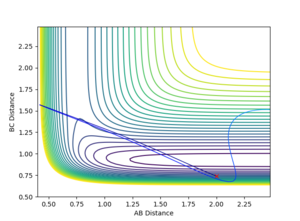
The minimum energy path (MEP) is the path between reactants and products which has the lowest energy, and hence it is the most probable reaction path. Two calculation modes can be applied to any set of initial conditions: Dynamics and MEP. To calculate the reaction path, a set of conditions where the system is displaced from the transition state with zero momenta was used initially: rBC = rts + 0.01 Å, rAB = rts, and pAB = pBC = 0 kgms-1. As mentioned in the previous session, an off-set in displacement of the system from the transition state causes the system to fall off to one of the minima which means the formation of a hydrogen molecule. The contour plot using the Dynamics calculation type is shown below in figure 8. It is shown that the system follows a natural path which is determined by the initial conditions of the system, and hence governed by inertia of the motion of the system. On the other hand, the velocity and hence inertia resets to zero in each time step in the MEP calculation type. Without the influence of inertia, the trajectory always falls off to a minimum following the steepest path, i.e. the one where there is the fastest decrease in energy. As indicated in figure 9, the system does not follow its inertia, as it is reset to zero at each time step, but a path at the lowest energy.
 |
 |
Looking at the inter-nuclear distances vs time plot in figure 10, it is observed that with the initial conditions rBC = rts + 0.01 Å and rAB = rts, at large time t, rAB oscillates about a very small, fixed distance, whereas rBC increases linearly after the initial collision. This represents the formation of a hydrogen molecule which is made up of hydrogen atoms A and B, and hydrogen atom C moves away from the hydrogen molecule after the initial encounter. It is observed from the inter-nuclear momenta vs time plot in figure 11 that pAB oscillates about a fixed momentum at large t, whereas pBC increases initially and stays constant at large t. If the initial conditions were switched so that rBC = rts and rAB = rts + 0.01 Å, the opposite would happen, with the values of inter-nuclear distances and inter-nuclear momenta staying the same, only that now the hydrogen molecule is made up of atoms B and C, and atom A moves away from the molecule after the collision. An inter-nuclear distances vs time plot and an inter-nuclear momenta vs time plot of the new conditions are shown in figure 12 and 13 for reference.
Mm10114 (talk) 16:34, 14 May 2018 (BST) Very good discussion in this section, well done. You remember to report all units here (at least in the main text), why didn't you in the previous section? You should remember to report the units in the figure captions as well.
Reactive and unreactive trajectories
Complete the table by adding a column with the total energy, and another column reporting if the trajectory is reactive or unreactive. For each set of initial conditions, provide a plot of the trajectory and a small description for what happens along the trajectory.
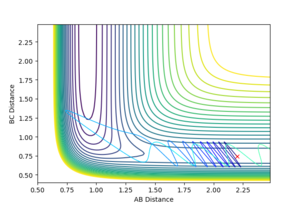
A trajectory can be identified as reaction if it starts in the region of the reactants and passes through the transition state to fall into the region of the products. On a contour plot, a reactive trajectory is indicated by the reaction path crossing the transition state. It is shown in previous calculations that a trajectory is reactive with the conditions rAB = 2 Å, rBC = 0.74 Å, pAB = -2.5 kgms-1, and -0.8 kgms-1< pBC < -1.5 kgms-1. Keeping the initial positions rAB and rBC as 2 Å and 0.74 Å respectively, a number of momenta combinations were tested to determine if those trajectories are reactive, and the results are summarised in the table below. It is worth noting that the little red cross on the contour plots indicates the starting point of the trajectory.
Mm10114 (talk) 16:49, 14 May 2018 (BST) Units, units, units. Having them in the main text doesn't exempt you from providing them in the table, for example in the first column in the square brackets when necessary. Additionally, as you don't mention the total energy in the main text I have no idea what is the unit of the energy you report here at all. Otherwise, very nice discussions and good observations. You mention re-crossing and in the two last examples you also provide the intermolecular distance vs time plots, which are very handy in showing the re-crossing events. Here the table format is really helpful in putting the results in a clear form that is easy to follow and allows one to compare the results.
Transition State Theory and its assumptions
State what are the main assumptions of Transition State Theory. Given the results you have obtained, how will Transition State Theory predictions for reaction rate values compare with experimental values?
The Transition State Theory describes how chemical reactions happen and helps chemists understand the reaction rates. It states in order for a chemical reaction to occur, the system but pass though the transition state region between the reactants and the products. The transition State Theory is based on a few assumptions:
- Transition states are distributed according to the Maxwell-Boltzman distribution
- Classical mechanics applies in the Transition State Theory
- Systems which has passed the transition state cannot go back and re-form the reactants [2]
The 3rd assumption listed above suggests that product must be formed once the system passes through the transition state. It is proven that this is not always true. For the fourth set of momenta in the session above, the system crossed the transition state but went back again to re-form the reactants via unreactive trajectory, as opposed to what the Transition State Theory suggests. For the fifth set of momenta, the trajectory was still found to be reactive despite the system passing the transition state multiple times, since there was enough momentum in the system. Although according to the Transition State Theory, it would have been a smoother trajectory.
The 2nd assumption listed above is not always the case when electrons cross energy barriers via tunnelling, such as in photochemistry.
Mm10114 (talk) 16:49, 14 May 2018 (BST) The position of the reference might be a little awkward, did you only took the third assumption from this reference? If yes, then this is fine. But, if you took all three of them from it, it would be better to put the reference after the very first sentence. You wrote "the system crossed the transition state but went back again to re-form the reactants via unreactive trajectory,". This is called 're-crossing' and you use this term in the table, then why not here as well? Be consistent and use the scientific terminology whenever possible, it would make it clearer.
F - H - H system
PES inspection
Classification of reactions
Classify the F + H2 and H + HF reactions according to their energetics (endothermic or exothermic). How does this relate to the bond strength of the chemical species involved?
The surface plot function can be used to classify reactions as endothermic or exothermic by comparing the energy of the reactants and the energy of the products. In the surface plot for a reactive trajectory of F + H2 shown in figure 21 (with the initial conditions being rFH = 2 Å, rHH = 0.74 Å, pFH = -0.5 kgms-1, and pHH = 0.5 kgms-1) it is observed that the products are lower in energy than the reactants, hence the F + H2 reaction is exothermic. In the surface plot for H + HF shown in figure 22 (with the initial conditions being rFH = 0.74 Å, rHH = 2 Å, pFH = 0.5 kgms-1, and pHH = -0.3 kgms-1), it is observed that the products are higher in energy than the reactants, hence the H + HF reaction is endothermic. These observations indicates that the F - H bond is stronger than the H - H bond, which is due to the high electronegativity of the fluorine atom.
Mm10114 (talk) 16:58, 14 May 2018 (BST) You could've mention of what type the H-F and H-H bonds are (ionic/covalent etc.).
Locating the transition state for F + H2 and H + HF
Locate the approximate position of the transition state.
The transition state is the point where the system stays on the ridge without falling of to either the reactants region or the products region. Similar to the H + H2 exercise, the transition state can be identified by using the inter-nuclear distance vs time plot on the programme: the transition state position (rts) is the point where there is no oscillation between neighbouring atoms i.e. no change in the inter-nuclear distances. The structure at the transition state, i.e. the activated complex, should be the same for F + H2 and H + HF, with one of the hydrogen atoms in the middle. At the transition state, the distance between F and H is found to be roughly rFH =1.813 Å and the distance between the two hydrogen atoms is found to be roughly rHH = 0.745 Å. This is confirmed by the inter-nuclear distance vs time plot shown in figure 23.
 |
Mm10114 (talk) 17:03, 14 May 2018 (BST) Very good. It would be nice to describe in little more detail your approach of finding the transition state coordinates. (Trial/error basis?, using dynamics or MEP?, lucky guess?)
Activation Energies
Report the activation energy for both reactions.
The activation energy of a reaction is the difference in potential energy between the reactants and the transition state. Using the energy vs time plot, the potential energy of the transition state is found to be -103.814 kcalmol-1. By adding a small distance to the transition state position, the system falls into either the reactants or the products region, as it is no longer perfectly balanced on the transition state ridge. By changing rFH to 1.913 Å (i.e. rFH = 1.913 Å, rHH = 0.745 Å), the system falls into the F + H2 region (figure 24); by changing rFH to 1.713 Å (i.e. rFH = 1.713 Å, rHH = 0.745 Å), the system falls into the H + HF region (figure 25). Here, the MEP calculation type is used as the path with minimum energy is required for calculating the activation energies. Using the last geometry function on the simulation and the energy vs time plot, the potential energy of the F + H2 region is found to be -103.91 kcalmol-1, as shown in figure 26. The potential energy for the H + HF region is found to be -133.693 kcalmol-1, as shown in figure 27.
By calculating the difference in potential energy between the reactants and the transition state, the activation energy for the F + H2 reaction is found to be 0.096 kcalmol-1 i.e. 0.402 kJmol-1, and the activation energy for the H + HF reaction is found to be 29.879 kcalmol-1 i.e. 125.014 kJmol-1.
Mm10114 (talk) 17:05, 14 May 2018 (BST) Nice.
Reaction dynamics
Mechanism of the release of reaction energy
In light of the fact that energy is conserved, discuss the mechanism of release of the reaction energy. How could this be confirmed experimentally?
In the session below, initial conditions with rFH = 2 Å, rHH = 0.74 Å, pFH = -0.5 kgms-1, and pHH = 0.5 kgms-1 were used, which result in a reactive trajectory, as shown in figure 28. These conditions show a reaction between a fluorine atom and a hydrogen molecule, which results in the formation of a HF molecule and the release of a hydrogen atom. The total energy of the reaction is conserved, so at any point of the reaction, the sum of potential and kinetic energy is equal to the total energy. An energy vs time plot is shown below in figure 29 which illustrate the change of kinetic and potential energies during the reaction. It is observed that the change in kinetic and potential energy is symmetric: potential energy is being converted into kinetic energy during the reaction. This is an exothermic reaction, and the gain of kinetic energy in a system means that the temperature raises. Hence, the change in temperature can be measured to confirm this mechanism of the release of reaction energy. Calorimetry would be an appropriate technique for this purpose.
For a reaction starting on the side of the reactants of F + H2, with the conditions rFH = 2 Å, rHH = 0.74 Å, and pFH = -0.5 kgms-1, a range of pHH values in the range -3 to 3 was explored. Contour plots of the trajectories are summarised in figure 30 to 38. It was found that for -1 kgms-1 < pHH < 1 kgms-1, there is not enough total energy to reach the translational state, and so there is no formation of the products. For systems (figures 30, 31, 37, 38) which have enough momentum (pHH = -3, -2, 2, and 3 kgms-1) to cross the transition state, re-crossing occurs due to excess vibrational energy regardless of the formation of the product.
Mm10114 (talk) 17:12, 14 May 2018 (BST) Very good discussion and observations. You've even started to add units in the figures captions.
Distribution of energy and efficiency of reaction
Discuss how the distribution of energy between different modes (translation and vibration) affect the efficiency of the reaction, and how this is influenced by the position of the transition state.
The distribution of energy is dependent on the position of the transition state. An early transition state, which is closer in energy with the reactants than the products, often results in high vibrational energy in the product; whereas a late transition state disfavours vibrational excitation of the product. Since energy is conserved, this suggests that for an exothermic reaction with an early transition state, the vibrational energy increases from reactants to products whereas the translational energy decreases from reactants to products, and vice versa for an endothermic reaction with a late transition state. For an early transition state, translational energy in the reactants affects the efficiency of the reaction; whereas for a late transition state, vibrational energy in the reactants affects the efficiency. [3]
Mm10114 (talk) 17:19, 14 May 2018 (BST) It would be good to state in the above paragraph that these are the Polanyl’s rules that you're describing. Otherwise, all good.
To demonstrate the Polanyl’s rule for an exothermic reaction, two different sets of momenta were tested and shown below in figure 39 and 40. The conditions used were rFH = 2 Å, rHH = 0.75 Å, pFH = -1.5 kgms-1, and pHH = 0.1 kgms-1 for figure 39 and rFH = 2 Å, rHH = 0.75 Å, pFH = -0.1 kgms-1, and pHH = 1.5 kgms-1 for figure 40. These two trajectories have the same total momenta, yet figure 39 shows a reactive trajectory while figure 40 shows an unreactive trajectory. It is thus demonstrated that the efficiency of an exothermic reaction is largely dependent on the translational energy of the reactants.
To demonstrate the Polanyl’s rule for an endothermic reaction, two different sets of momenta were tested and shown below in figure 41 and 42. The conditions used were rHH = 2 Å, rHF = 0.74 Å, pHH = -0.1 kgms-1, and pHF = 9 kgms-1 for figure 41 and rHH = 2 Å, rHF = 0.74 Å, pHH = -9 kgms-1, and pHF = 0.1 kgms-1 for figure 42. These two trajectories have the same total momenta, yet figure 41 shows a reactive trajectory while figure 42 shows an unreactive trajectory. It is thus demonstrated that the efficiency of an endothermic reaction is largely dependent on the vibrational energy of the reactants.
Mm10114 (talk) 17:19, 14 May 2018 (BST) You've very nicely demonstrated your understanding of the Polanyl’s rules with appropriate examples, well done.
Mm10114 (talk) 17:19, 14 May 2018 (BST) Final remark: It's always good to finish a report with conclusions, brief summary of what've been done and the most important findings. Otherwise, a very good report.
References
Template loop detected: Template:Reflist
- ↑ International Union. col (saddle point). IUPAC Gold Book - capillary condensation Available at: https://goldbook.iupac.org/html/C/C01145.html. (Accessed: 4th May 2018)
- ↑ Steinfeld, J. I., Hase, W. L. & Francisco, J. S. Chemical kinetics and dynamics, (Prentice Hall, 1999). p. 310-315
- ↑ Steinfeld, J. I., Hase, W. L. & Francisco, J. S. Chemical kinetics and dynamics. (Prentice Hall, 1999). p. 297-299

