Hw7018
Excercise 1
On a potential energy surface diagram, how is the transition state mathematically defined? A transition state mathematically defined as ∂V(ri)/∂ri=0 (the gradient of the potential enerygy=0).
How can the transition state be identified? Since a small change in geometry would shift the trajectory towards either the products or the reactants at the transition state, we can start trajectories near the transition state, follow the trajectory until a point that it no longer 'roll' towards the direction before, which is the transition state.
How can it be distinguished from a local minimum of the potential energy surface? The transition state needs both ∂V(r1)/∂r1 and ∂V(r2)/∂r2=0, while the local minimum might only have ∂V(r1)/∂r1 or ∂V(r2)/∂r2=0.
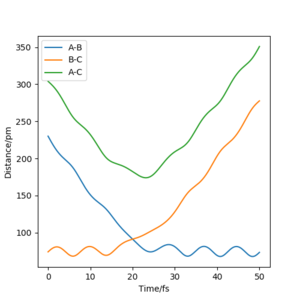
Report your best estimate of the transition state position (rts) and explain your reasoning illustrating it with a “Internuclear Distances vs Time” plot for a relevant trajectory.
rts≈90 pm This is the intersection of rAB and rBC.

