Hjc3917
BH3
Link to the BH3 log file
Method and basis set
Method: B3LYP
Basis set: 6-31G
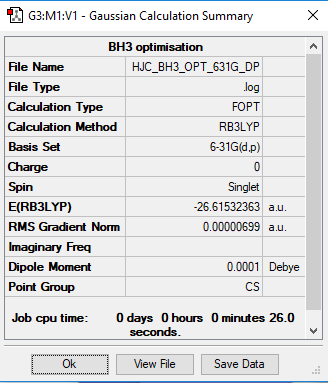
Optimisation of the BH3 Molecule
Item Value Threshold Converged?
Maximum Force            0.000014     0.000450     YES
RMS     Force            0.000007     0.000300     YES
Maximum Displacement     0.000055     0.001800     YES
RMS     Displacement     0.000027     0.001200     YES
Predicted change in Energy=-1.144138D-09
Optimization completed.
   -- Stationary point found.
Frequency Analysis of BH3
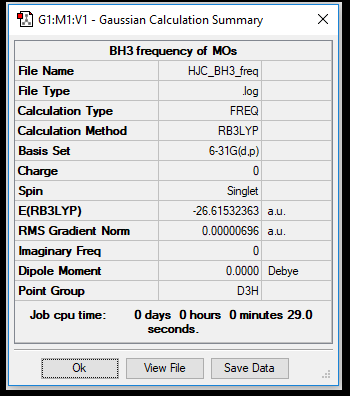
the BH3 frequency summary table from Gaussview

the vibration frequencies of the different modes of the BH3 molecule
Low frequencies --- -7.9073 -1.6385 -0.0054 0.6256 6.5697 6.7709
Low frequencies --- 1162.9662 1213.1623 1213.1650
Jmol of BH3 Molecule
BH molecule |
BH3 IR Spectrum
There are fewer than six peaks in the spectrum, despite there being six vibrations, as the two vibrations at 1213.16 cm-1 are degenerate, as are the two vibrations at 2715.56 cm-1, hence one peak is observed relative to two. Also, the symmetrical vibration mode with a frequency of vibration at 2582.38 cm-1 does not lead to a change in dipole, thus is not observed in the IR spectrum.
The Molecular Orbital Diagram of BH3
Molecular Shape: Trigonal Planar
Point Group: D3h
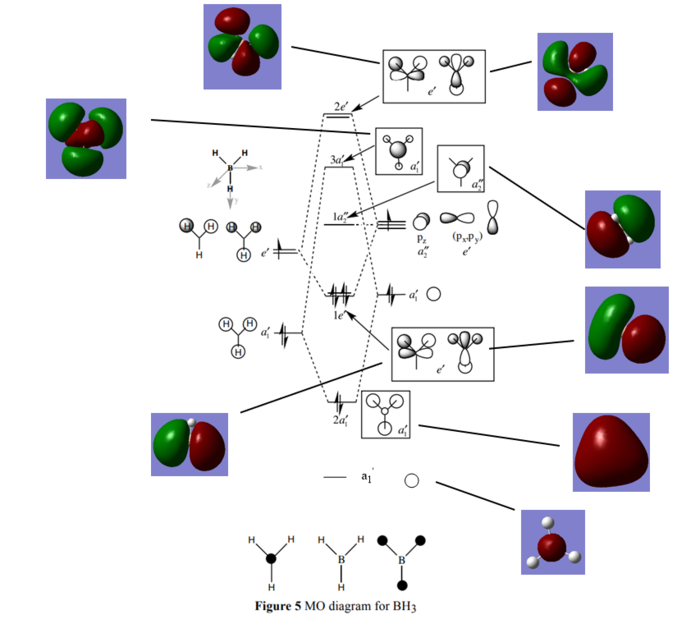
The annotated Molecular Orbital diagram of BH3
Hunt, P 2018, Molecular Orbitals Problem Class One Answers (Lecture Notes), Imperial College London, delivered 2018
Are there any significant differences between the real and LCAO MOs?
The orbitals represented in the diagram show the individual contributions from each separate orbital, however in reality the orbitals are more diffuse and give only a vague shape of what had been predicted. Thus it is difficult to determine where exactly the electron density is coming from.
What does this say about the accuracy and usefulness of qualitative MO theory?
Being a much greater alternative to valence bond theory, molecular orbital theory is a great way to predict solutions to the Schrodinger's equation. The energy levels of the molecular orbitals are predicted in the same corresponding order, hence the pictoral representations reflect the MOs accurately.
Clear inclusion of the calculated MOs on to the MO diagram with the corresponding LCAO MO. Your discussion to the questions is good and you mention the differences between the real and LCAO MOs which is great! As a note, just make sure to remember that the LCAO approximation doesn't always predict the right energy ordering (and sometimes you can't predict the ordering at all!), but nice to highlight that it is correct her, mainly due to the simplicity of the system. Smf115 (talk) 21:22, 18 May 2019 (BST)
Association Energy Calculation from Total Energies of Ammonia and Borane
Link to the NH3 log file
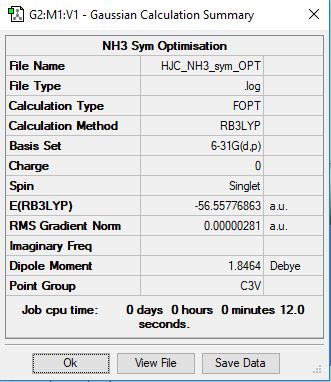
NH3 Optimisation
B3LYP/6-31G Level
The symmetry optimisation of NH3 table
        Item               Value     Threshold  Converged?
Maximum Force            0.000005     0.000450     YES
RMS     Force            0.000003     0.000300     YES
Maximum Displacement     0.000014     0.001800     YES
RMS     Displacement     0.000009     0.001200     YES
Predicted change in Energy=-9.033801D-11
Optimization completed.
   -- Stationary point found.
NH3 Frequency Analysis
Low frequencies ---  -11.5821  -11.5466   -0.0037    0.0244    0.1408   25.5787

Low frequencies --- 1089.6633 1694.1735 1694.1738
Link to the NH3BH3 log file
NH3BH3 Optimisation
B3LYP/6-31G Level
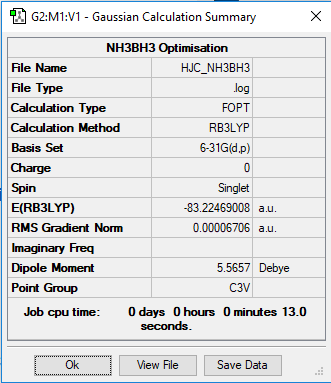
The symmetry optimisation of NH3BH3
        Item               Value     Threshold  Converged?
Maximum Force            0.000132     0.000450     YES
RMS     Force            0.000063     0.000300     YES
Maximum Displacement     0.000809     0.001800     YES
RMS     Displacement     0.000391     0.001200     YES
Predicted change in Energy=-2.116443D-07
Optimization completed.
   -- Stationary point found.
NH3BH3 Frequency Analysis
Low frequencies --- -0.2071 -0.0612 -0.0101 10.0383 16.1203 16.4495
Low frequencies --- 263.0248 631.3845 626.2411
Association Energy Calculation
From the 6-31G optimised structures:
E(BH3): -26.61532
E(NH3): -56.55776
E(NH3BH3)= -83.22469
ΔE = E(NH3BH3)-[E(NH3)+E(BH3)]
ΔE = -83.22469-(-56.55776-26.61532) AU
ΔE= -0.05106 AU
Thus ΔE = -135 kJ/mol
Is the B-N bond weak, medium or strong? What comparison have you made to come to this conclusion?
The dative covalent bond is, based on the energy difference observed, relatively small (-135 kJ/mol). This is in comparison to C-C carbon bonds, with a bond energy of -348 kJ/mol.
Correct calculation, clearly presented energy values and good consideration given to the accuracy of the final reported value! Your evaluation of the bond strength is good, to improve it would have been good to see a few more comparisons to known bond dissociation energies or explaining why the comparison made is a relevant on - also, always reference literature values! Smf115 (talk) 21:27, 18 May 2019 (BST)
Using Basis Sets and Pseudo-Potentials for NI3
Link to the NI3 log file
Optimisation and Frequency Analysis of NI3
Method: B3LYP
Basis set: GEN
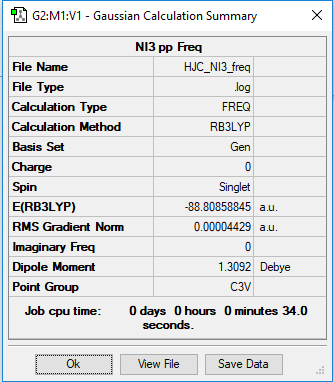
the NI3 optimisation summary table
        Item               Value     Threshold  Converged?
Maximum Force            0.000102     0.000450     YES
RMS     Force            0.000075     0.000300     YES
Maximum Displacement     0.000667     0.001800     YES
RMS     Displacement     0.000490     0.001200     YES
Predicted change in Energy=-9.239331D-08
Optimization completed.
   -- Stationary point found.
Low frequencies ---  -12.3847  -12.3783   -5.6131   -0.0040    0.0194    0.0711

Low frequencies ---  100.9307  100.9314  147.2333
NI3 Molecule |
The Optimised N-I Bond Distance
The optimised N-I distance: 2.18424 Angstroms
Correct implementation of the pseudopotential but think about the accuracy when reporting bond distances! (3 d.p.) Overall, a good section 1 with the correct log files submitted, however, you are missing the jmols for NH3 and NH3BH3, and we did want the summary tables from the frequency and not the optimisation calculations Smf115 (talk) 21:33, 18 May 2019 (BST).
Project: Ionic Liquids as Designer Solvents
Link to the NH3BH3 log file
File:HJC NCH34 SYM OPT FREQ.log
Optimisation and Frequency Analysis of [N(CH3)4]+
[N(CH3)4]+ Optimisation
Method: B3LYP
Basis Set: 6-31G
        Item               Value     Threshold  Converged?
Maximum Force            0.000102     0.000450     YES
RMS     Force            0.000078     0.000300     YES
Maximum Displacement     0.000420     0.001800     YES
RMS     Displacement     0.000221     0.001200     YES
Predicted change in Energy=-3.179137D-07
Optimization completed.
   -- Stationary point found.
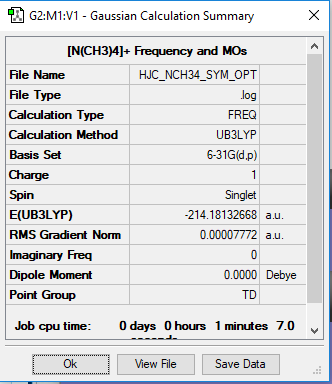
The frequency summary of the [N(CH3)4]+ molecule
Low frequencies ---   -0.0005   -0.0003    0.0006   35.7932   35.7932   35.7932

Low frequencies ---  218.6720  317.3398  317.3398
Optimisation and Frequency Analysis of [P(CH3)4]+
Link to the [P(CH3)4]+ log file
File:HJC PCH34 SYM OPT FREQ.log
Method: B3LYP
Basis Set: 6-31G
        Item               Value     Threshold  Converged?
Maximum Force            0.000098     0.000450     YES
RMS     Force            0.000027     0.000300     YES
Maximum Displacement     0.000455     0.001800     YES
RMS     Displacement     0.000114     0.001200     YES
Predicted change in Energy=-9.033801D-11
Optimization completed.
   -- Stationary point found.
Low frequencies ---    0.0020    0.0027    0.0029   50.4393   50.4393   50.4393

Low frequencies ---  188.1525  213.1446  213.1446
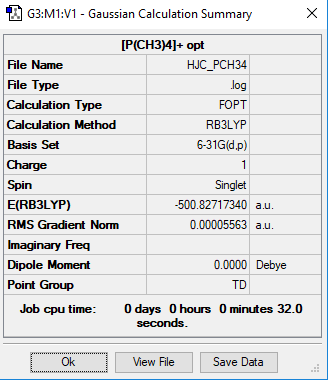
The frequency summary of the [P(CH3)4]+ molecule
Charge Distribution Comparisions

the [N(CH3)4]+ charge distribution
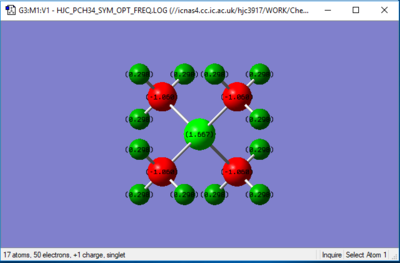
the [P(CH3)4]+ charge distribution
| Atom | [P(CH3)4]+ | [N(CH3)4]+ | Comparison |
|---|---|---|---|
| Heteroatom (P/N) | 1.667 | -0.295 | Whilst being in the same group, P is on the third row of the PTE and N is on the second row, and the electronegativities of N and P are 3.04 and 2.19 respectively. The lower electronegativity on P results in the improved stabilisation of positive charge, relative to the more electropositive N. Moreover, since P is in the third row of the periodic table, the more diffuse nature of atom leads to a lower charge density, which contributes further to the stability of the positive charge as a result. |
| C | -1.060 | -0.484 | The electronegativity of C is 2.55. Thus, C is more electronegative than P, therefore there will be more electron density on the C in a C-P bond relative to the C in a C-N bond, as a result of N being more electronegative than C. However, C will still have a negative charge in the C-N bond, this is because the N is not very able to hold onto a positive charge therefore, the unit charge has to be spread across all of the atoms. |
| H | 0.298 | 0.269 | C-H there is not a big difference in these values as a result of electronic effects seen as the electronegativity will drop rapidly with distance away from the atom. Hence, the C-H bonds will be very similar. |
Nice comparisons made between the structures and correct charges calculated. However, you should have used the same colour range to display the charge distributions and your discussion isn't clear or correct in some places. Why does a lower charge density contribute to the stability of the positive charge? What about other contributions such as symmetries? Smf115 (talk) 21:02, 20 May 2019 (BST)
The formal positive charge on the N atom is due to the Lewis Structure. In reality, due to the H atoms being the most electropositive, the positive charge will naturally distribute itself onto these atoms relative to the electronegative N and C. The first 3 bonds to the methyl groups are a covalent bond. Nevertheless, due to N only have 3 valence electrons the fourth bond to the methyl group is a dative bond. Hence, there is a positive charge to show the difference in the number of electrons that are expected to be seen as opposed to the number of electrons on the atom in the Lewis structure. The less electronegative C relative to the N means that the least proportion of the positive charge is spread around the nitrogen.
Correct statement that the traditional picture arises due to the Lewis structure, however, your explanation of this isn't very clear and could have considered formal electron counting. The final statement is also not correct, you have just seen that there isn't a positive charge on the N but a negative one and should instead be thinking in terms of electron density. Smf115 (talk) 21:02, 20 May 2019 (BST)
LCAO MO Diagrams
Nicely presented MOs, FOs and LCAOs and good highlighting of the main interactions. Really good attempt at both constructing the FOs and at analysing the overall character of the MO although there are errors. In particular, the FO for MO 12 is incorrect and considering the BH3 MO diagram may have helped. There are also antibonding interactions present between the out-of-phase ligand FOs and N p-orbital. Smf115 (talk) 22:25, 21 May 2019 (BST)
Overall, a good report and section 1 is particularly well done! Smf115 (talk) 22:25, 21 May 2019 (BST)

