Hg3117 inorganic
BH3
B3LYP/6-31G

Item               Value     Threshold  Converged?
 Maximum Force            0.000203     0.000450     YES
 RMS     Force            0.000098     0.000300     YES
 Maximum Displacement     0.000737     0.001800     YES
 RMS     Displacement     0.000395     0.001200     YES
 Predicted change in Energy=-1.354985D-07

Low frequencies ---   -0.2263   -0.1037   -0.0055   47.9770   49.0378   49.0383
 Low frequencies --- 1163.7209 1213.6704 1213.6731
BH3 |
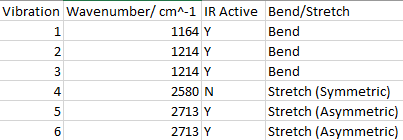
Vibrational Modes for BH3
Ng611 (talk) 16:14, 4 June 2019 (BST) Where are your IR intensities?
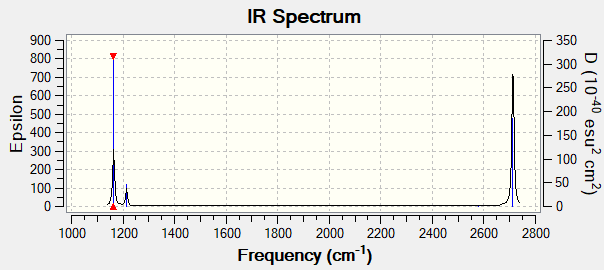
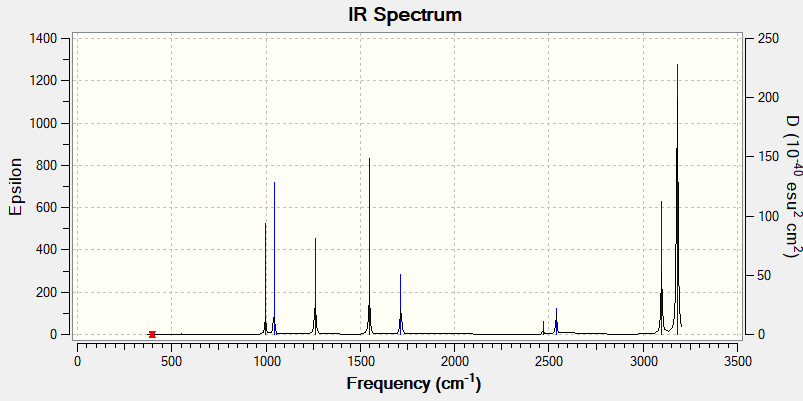
IR Spectrum of BH3
There are less than 6 peaks observable in the spectrum even though there are 6 possible vibrational modes in BH3 for several reasons.
First if the vibrational mode doesn't cause an overall change in the molecules dipole it is labelled as IR inactive and won't show up on the IR spectrum. In this case the vibrational mode with wavenumber 2580cm^-1 is Inactive as it is a symmetric stretch. All H atoms stretch away from the B atom in equal amounts so no overall change in dipole.
The second reason is that some of the modes are degenerate. These will show up as one peak on the spectrum. This applies to the peaks at 1214cm^-1 and 2713cm^-1. So due to both IR inactivity and degeneracy the predicted number of observable peaks in the spectrum would be 3 which is reflected in the spectrum shown above.
Ng611 (talk) 16:18, 4 June 2019 (BST) You need to orient your MOs so that they correspond with the orientations in your MO diagram (i.e.: along the C3 axis). Otherwise, it's impossible to check whether you've matched the correct quantitative MOs with the real MOs.
BH3 MO Diagram with LCAO's and Corresponding Computed MOs /ref. 1
The LCAO's and real MOs share the same nodes. The main differences in the MOs is that the ones by LCAO are much less diffused. This shows that qualitative MO theory is a good approximation of a molecule's MOs when they can't be computed more accurately.
Ng611 (talk) 16:19, 4 June 2019 (BST) More specificity is needed here. What do you mean by more diffuse? Does this apply to all or only some of the orbitals?
NH3]]
B3LYP/6-31G
         Item               Value     Threshold  Converged?
 Maximum Force            0.000006     0.000450     YES
 RMS     Force            0.000004     0.000300     YES
 Maximum Displacement     0.000014     0.001800     YES
 RMS     Displacement     0.000009     0.001200     YES
 Predicted change in Energy=-1.141618D-10

Low frequencies --- -426.8524 -426.8509 -385.8927   -0.0077   -0.0013    0.0080
 Low frequencies ---  790.4011 1653.0881 1653.0884
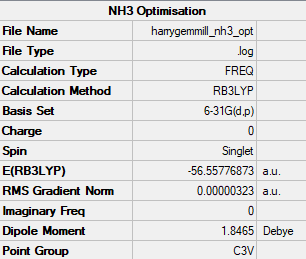
NH3 |
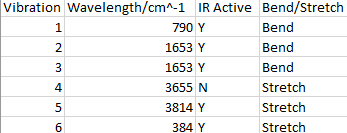
Vibrational Modes for NH3
NH3 IR Spectrum
NH3BH3
B3LYP/6-31G
         Item               Value     Threshold  Converged?
 Maximum Force            0.000122     0.000450     YES
 RMS     Force            0.000058     0.000300     YES
 Maximum Displacement     0.000513     0.001800     YES
 RMS     Displacement     0.000296     0.001200     YES
 Predicted change in Energy=-1.631175D-07

 Low frequencies --- -798.6159 -403.1874 -402.1497   -0.0007    0.0006    0.0009
 Low frequencies ---  641.0195  641.6344  912.1445
NH3BH3 |
Energy Change
au and KJ/Mol
Change in E = E(NH3BH3) - (E(NH3) + E(BH3))
= -83.22468893 - (-26.61532343 + -56.55776873) = -0.05159 au = -135.52 KJ/mol
Ng611 (talk) 16:22, 4 June 2019 (BST) Too many d.p. Your calculations are accurate to the order of ~1 kJ/mol and your calculated values should reflect this.
Ng611 (talk) 16:23, 4 June 2019 (BST) Where are your literature values?
NI3
B3LYP/6-31G
         Item               Value     Threshold  Converged?
 Maximum Force            0.000061     0.000450     YES
 RMS     Force            0.000037     0.000300     YES
 Maximum Displacement     0.000459     0.001800     YES
 RMS     Displacement     0.000285     0.001200     YES
 Predicted change in Energy=-3.108653D-08
NI3 |
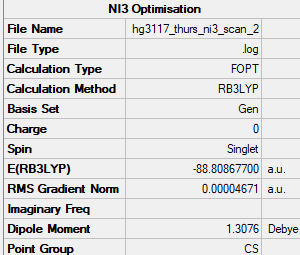
The optimised N-I bond distance is 2.10503 angstroms.
Ng611 (talk) 16:24, 4 June 2019 (BST) Slightly off the true value here. Good otherwise.
Project Molecule - Al2Br2Cl4
B3LYP/6-31G
Relative Energies of Isomers with 2 Bridging Br Atoms and 2 Cis Bromines
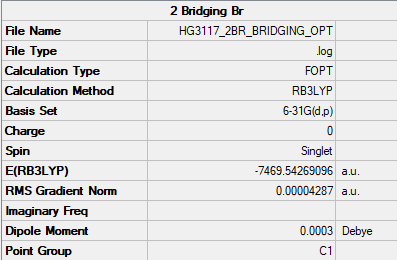
Al2Cl4Br2 - Bridging Bromine |
Al2Br2Cl4 Bridging Br Optimisation Log File Link
Al2Br2Cl4 Bridging Br Frequency Log File Link
Ng611 (talk) 16:25, 4 June 2019 (BST) You needed to use a pseudopotential on the Br here.
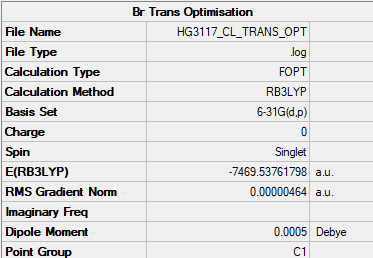
Al2Cl4Br2 - Trans Bromine |
Al2Br2Cl4 Trans Br Log File Link
Trans Br energy = -7469.53762au = -19618240.27 KJ/mol
2 Bridging Br = -7469.54269au = -19618253.59 KJ/mol
relative energy Bridging:Trans is 1:0.99999, difference in energy of 13.32KJ/mol
More stable isomer is the one with 2 bridging Br ligands. This is due to Br being a better Lewis Base than Cl as its outer electron pairs aren't held as strongly.
Dissociation Energy - lowest energy isomer
Ng611 (talk) 16:36, 4 June 2019 (BST) Where is the calculation for your AlCl2Br monomer?
The energy of the AlCl2Br dissociation product is -3734.74852au Energy change is 2E(AlCl2Br) - E(Al2Cl4Br2) = 2(-3734.74852) - (-7469.54269) = 0.04565au = 119.90KJ/mol.
The energy of the products is higher than that of the dimer, so are less stable.
Ng611 (talk) 16:36, 4 June 2019 (BST) 2 x -3734.74852 gives -7469.49704 (i.e.: higher in energy than your dimer) You've actually interpreted this incorrectly. Remember that the calculation is E(Products)-E(Reactants). As written, your products are your 2x AlCl2Br monomers which, as you (correctly, ignoring your incorrect application of the ECP on bromine) calculated, are higher in energy.
Al2Cl4Br2 Computed MO Comparison with LCAO's
MO 77 - Overall Antibonding
MO 72 - Overall Antibonding
MO 68 - Overall Bonding
Ng611 (talk) 16:38, 4 June 2019 (BST) Good LCAO analysis!
References
ref. 1 - P. Hunt, Available at https://www.huntresearchgroup.org.uk/teaching/teaching_comp_lab_year2a/Tut_MO_diagram_BH3.pdf

