Harichauhan16
H + H2 System
Transition States and Minima
On a potential surface, a transition state is defined as the maximum along the minimum energy path. It can be distinguished from a local minimum by looking at the curvature of the potential surface along both components. A minimum would have positive curvature in both components, implying they both have a positive second partial derivative. A saddle point has a positive curvature along one component and a negative curvature along the other. Good--Sw2711 (talk) 12:00, 11 May 2018 (BST)
Transition State Separation
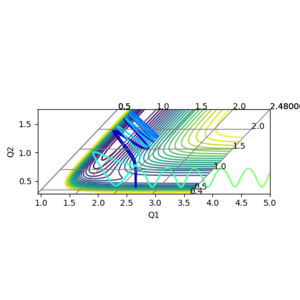
As all nuclei in the reaction are identical, the transition state has equal separation between all hydrogen atoms. Using trial and error, the separation of the hydrogen atoms that gave the most consistent nuclear separation, with the least vibrations was 0.908 Å. The nuclear displacement vs time graph is displayed below. You have clearly identified the TS. But you haven’t explained well, why you would think with the least vibrations would be the TS. That’s really what the saddle point means right? --Sw2711 (talk) 12:00, 11 May 2018 (BST)

Minimum Energy Path (MEP)
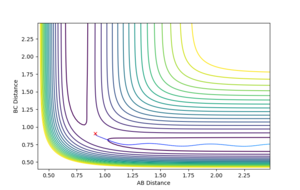
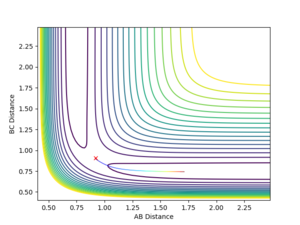
The minimum energy path is found by ignoring the momenta of the nuclei involved in the reaction. For each step, the initial velocity of the nuclei is assumed to be zero. This causes any nuclear vibrations to be dampened. The surface plot of the reaction, calculated using the dynamic calculation is shown below in figure 2 and below the plot for the MEP is shown below in figure 3. The lack of nuclear vibrations in the MEP plot is displayed by the smooth curve in figure 3.
These plots were obtained by starting the nuclei at the transition state displacements, but offsetting one by 0.01 Å. This causes the system to roll towards on set of products. Changing which nucleus is displaced determines whether the products are Ha-Hb + Hc or Ha + Hb-Hc. Good--Sw2711 (talk) 12:03, 11 May 2018 (BST)
Reactive and Unreactive Trajectories
The following initial momenta starting conditions were tested to see what their total energy was whether they lead to a successful reaction. The plots of their reaction paths is shown below in figures 4-8, along with a comment on whether the reaction is successful or not.
| p1 | p2 | Energy |
|---|---|---|
| -1.25 | -2.5 | -99.018 |
| -1.5 | -2.0 | -100.456 |
| -1.5 | -2.5 | -98.956 |
| -2.5 | -5.0 | -83.956 |
| -2.5 | -5.2 | -83.416 |
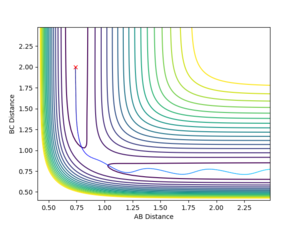
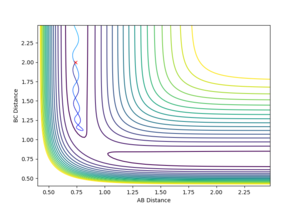
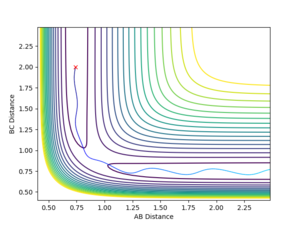
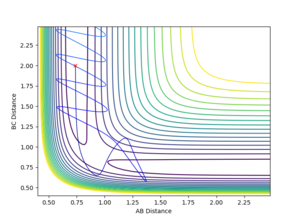
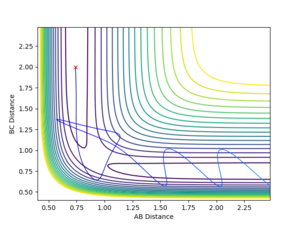
You are missing some of the explanations why in some cases it is successful, why some are not? For example, Figure 7, it clearly has enough energy to cross the TS, but why is it still not successful? --Sw2711 (talk) 12:04, 11 May 2018 (BST) Transition State Theory Transition state theory suggests that, in a system, there is an equilibrium between the reactants and the transition state species, which is a high energy chemical species in between the reactants and the products. It assumes that the molecular energies have a Botlzmann distribution and thus, examining the difference in energy between the reactants and the transition state can give some indication of the rate of the reaction.
It assumes that is a collision occurs with enough energy to cross over the transition state, it is not possible for it to return to the reactants. Figure 7 suggests this is not true as the system recrosses the transition barrier back to the reactants, showing an inaccuracy in this assumption.
Figure 8 shows that not all reactions must pass directly through the transition state, showing another weakness of TST. It is likely that the number of successful reaction that do not cross through the transition state is higher than the number of collisions going through barrier recrossing, implying that the experimental rate of reaction would be higher than that found using TST.
F - H - H System
Reaction Energetics and Bond Enthalpy
By examining the potential surface of the F-H-H system, figure 9, it was determined that the F-H bond is stronger than the H-H bond.
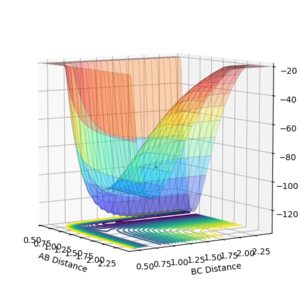
Examining the plot, it is clear that the potential energy is lower when the F-H bond is formed there is a lone H atom. This is in agreement with documented values. This makes the reaction H2 + F → HF + H exothermic.
To determine the activation energy of this reaction, the energy at the total energy at the transition state was determined to be -103.754 kcalmol-1. The transition state was then located more exactly using trial and error. Using Hammond's Postulate and the fact that the above reaction is endothermic, it was determined that the transition state would be where the H - H separation is smaller than the H-F separation. The values found were H-H = 1.81 Å and F-H = 0.745 Å. We need some evidence to find those numbers--Sw2711 (talk) 12:06, 11 May 2018 (BST)
Placing the H2 molecule and the F atom far apart, the total energy was -104.010 kcalmol-1. This makes the activation energy of this reaction 0.256 kcalmol-1. Similarly for the reaction HF + H → H2 + F, the activation energy was determined to be 29.654 kcalmol-1. Evidence again.--Sw2711 (talk) 12:06, 11 May 2018 (BST)
Reaction Dynamics
For the reaction HF + H → H2 + F, the starting conditions of rHH = 2.25 Å and rFH = 0.70 Å, with pHH = -0.75 and pFH = 0.095, gives a successful reaction. The skew plot for this reaction is shown below.
I think you are missing 2 questions here. How could the mechanism of release of the reaction energy confirmed experimentally and how the distribution of energy between different modes (translation and vibration) could affect the efficiency of the reaction. --Sw2711 (talk) 12:07, 11 May 2018 (BST)
