
HariChauhanInorganic
BH3
B3LYP/6-31G Level

  Item               Value     Threshold  Converged?
 Maximum Force            0.000014     0.000450     YES
 RMS     Force            0.000007     0.000300     YES
 Maximum Displacement     0.000053     0.001800     YES
 RMS     Displacement     0.000027     0.001200     YES
 Low frequencies ---   -7.5936   -1.5614   -0.0055    0.6514    6.9319    7.1055
 Low frequencies --- 1162.9677 1213.1634 1213.1661
BH3 |
Vibrational spectrum for BH3
| wavenumber (cm-1) | Intensity (arbitrary units) | symmetry | IR active? | type |
| 1163 | 93 | A2" | yes | out-of-plane bend |
| 1213 | 14 | E' | slightly | bend |
| 1213 | 14 | E' | slightly | bend |
| 2582 | 0 | A1' | no | symmetric stretch |
| 2716 | 126 | E' | yes | asymmetric stretch |
| 2716 | 126 | E' | yes | asymmetric stretch |

Only three peaks appear in the predicted spectrum because there are two pairs of E' vibrational modes that are degenerate, hence they appear as one signal each. Furthermore, the A1' symmetric stretch does not produce a change in the dipole moment of the molecule so is not IR active.

The a1' molecular orbital looks different from that predicted by LCAO. The s orbitals on the hydrogen atoms appear much larger in the calculated MO. This suggests that the LCAO approach to predicting molecular orbitals may have some inaccuracies.
Ng611 (talk) 19:48, 4 June 2018 (BST) I'd say the a1' MO looks pretty much like that predicted from qualitative MO theory. Are there any particular MOs in which the hydrogen s-orbitals are larger than predicted? It's important to remember that overall, differences between these real MOs and the computed ones?
NH3
B3LYP/6-31G Level

         Item               Value     Threshold  Converged?
 Maximum Force            0.000006     0.000450     YES
 RMS     Force            0.000003     0.000300     YES
 Maximum Displacement     0.000013     0.001800     YES
 RMS     Displacement     0.000007     0.001200     YES
 Low frequencies ---   -0.0138   -0.0032   -0.0015    7.0783    8.0932    8.0937
 Low frequencies --- 1089.3840 1693.9368 1693.9368
NH3 |
Vibrational spectrum for NH3
| wavenumber (cm-1) | Intensity (arbitrary units) | symmetry | IR active? | type |
| 1089 | 145 | A | yes | asymmetric strech |
| 1693 | 14 | E | slightly | bend |
| 1693 | 14 | E | slightly | bend |
| 3461 | 1 | A1' | very slightly | symmetric stretch |
| 3589 | 0 | E | no | asymmetric stretch |
| 3589 | 0 | E | no | asymmetric stretch |
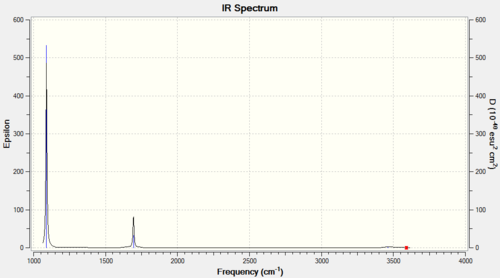
Similar to BH3, NH3 has two sets of degenerate vibrational modes. However one of these pairs is IR inactive. Therefore, only three signals are predicted in the IR spectrum.
BH3NH3
B3LYP/6-31G Level

         Item               Value     Threshold  Converged?
 Maximum Force            0.000350     0.000450     YES
 RMS     Force            0.000112     0.000300     YES
 Maximum Displacement     0.001350     0.001800     YES
 RMS     Displacement     0.000450     0.001200     YES
 Low frequencies ---   -0.0262   -0.0082   -0.0023    9.6688    9.6769   37.9651
 Low frequencies ---  265.3241  634.4274  639.1700
NH3 |
Vibrational spectrum for BH3NH3
Due to the large number of vibrational modes in BH3NH3, a screenshot of the vibrations predicted by Gaussian is provided. A total of 11 bands should be observed, although some with very low intensity. Also, some are very close in energy so may overlap.


Calculating B-N Bond Energy in BH3NH3
E(NH3)= -56.55777 a.u.
E(BH3)= -26.61532 a.u.
E(NH3BH3)= -83.22469 a.u.

ΔE=E(NH3BH3)-[E(NH3)+E(BH3)] = -83.22469 - (-56.55777 - 26.61532) = -0.05167 a.u.

-0.05167 a.u. * 2625 = -136 kJmol-1
The energy of the B-N bond in BH3NH3 is -136 kJmol-1
Ng611 (talk) 19:52, 4 June 2018 (BST) You're off by 1 Kj/mol in your final answer (copy/pasting your working into google calculator gives the right answer, so it looks like you might have mistyped a digit). Remember also to cite your bond values (ideally from a textbook, databook, or paper).
Comparing this bond with the C-C bond strength in ethane, which is isoelectronic, the B-N bond is significantly weaker. In ethane, the C-C bond is around 364 kJmol-1, over double that of the B-N bond strength. This is likely due to the large electronegativity difference between B and N.
BBr3
B3LYP/6-31G(d,p)LANL2DZ Level

  Item                Value       Threshold  Converged?
 Maximum Force            0.000010     0.000450     YES
 RMS     Force            0.000005     0.000300     YES
 Maximum Displacement     0.000045     0.001800     YES
 RMS     Displacement     0.000022     0.001200     YES
 Low frequencies ---   -0.0135   -0.0064   -0.0046    2.4669    2.4670    4.8600
 Low frequencies ---  155.9626  155.9646  267.7022
BBr3 |
Vibrational spectrum for BBr3
| wavenumber (cm-1) | Intensity (arbitrary units) | symmetry | IR active? | type |
| 156 | 0 | E' | no | bend |
| 156 | 0 | E' | no | bend |
| 268 | 0 | A1' | no | symmetric stretch |
| 378 | 4 | A2" | slightly | out-of-plane bend |
| 763 | 320 | E' | yes | asymmetric stretch |
| 763 | 320 | E' | yes | asymmetric stretch |

Only one peak is seen in this spectrum as the two stretches at 763 cm-1 have far higher intensity than the other IR active stretch at 378 cm-1.
Benzene
B3LYP/6-31G Level

         Item               Value     Threshold  Converged?
 Maximum Force            0.000194     0.000450     YES
 RMS     Force            0.000084     0.000300     YES
 Maximum Displacement     0.000767     0.001800     YES
 RMS     Displacement     0.000328     0.001200     YES
 Low frequencies ---  -16.9682  -14.6636  -14.6636   -0.0054   -0.0054    0.0004
 Low frequencies ---  414.1239  414.1239  620.9400
Benzene |
Vibrational spectrum for Benzene


Although benzene clearly has very many vibrational modes, due to its high symmetry, only a few are IR active. This explains why only 4 peaks are observed in its IR spectrum.
Borazine
B3LYP/6-31G Level

         Item               Value     Threshold  Converged?
 Maximum Force            0.000443     0.000450     YES
 RMS     Force            0.000179     0.000300     YES
 Maximum Displacement     0.000882     0.001800     YES
 RMS     Displacement     0.000400     0.001200     YES
 Low frequencies ---   -0.0045   -0.0033   -0.0031    5.3417    5.3626    5.9709
 Low frequencies ---  289.8780  289.8786  404.4105
Borazine |
Vibrational spectrum for Borazine


Borazine has the same number of vibrational modes as benzene, however, due to its lower symmetry, more of these are IR active, which is why it shows 6 active signals in the IR spectrum.
Comparison of Benzene and Borazine
Comparison of Charge
| Benzene | Borazine |

|

|
The brighter colours imply a higher magnitude of charge, with red implying a negative charge and green implying a positive charge.
Because carbon and hydrogen have very close electronegativities, the C-H bond has a large amount of covalent character. The C-C bond, being homonuclear, is completely covalent. Therefore, there is little separation of charge in benzene. Because carbon is a little more electronegative than hydrogen, a negative charge of -0.239 resides on the carbon atoms, with +0.239 on the hydrogen atoms. However, due to the D6h point group of the molecule, the sum of the C-H bond dipoles is zero, giving the benzene molecule an overall zero dipole moment.
In borazine, there is a higher separation of charge, shown by the brighter colours in the figure above. Nitrogen has a significantly higher electronegativity than boron and hydrogen, making the N-B and N-H bonds have a large dipole moment. Comparing the B-H and N-H bonds, the hydrogen atoms bonded to boron show little charge but the hydrogen atoms bonded to nitrogen have a charge of +0.432 as electrons in the N-H bond are drawn closer to the nitrogen.
In borazine, a large amount of negative charge resides on the Nitrogen atoms, with the boron and hydrogen atoms having positive charge, however due to the D3h point group of the molecule, the dipole moments of these polar bonds sums to zero, to give borazine no overall dipole moment.
Both molecules have a total charge of zero, so summing up the total charge gives zero in both cases.
Comparison of Molecular Orbitals
| Benzene | Borazine | Comparison |

|

|
MO 12 in benzene and 10 in borazine. Both of these MOs have a large amount of bonding character resulting from overlap of orbitals in the center of the ring in the plane of the molecule. They both result from in-phase overlap of the 1s orbital on hydrogen with the carbon 2p-orbitals along the C-H bonds. In borazine, the 1s on the carbon atoms bonded to boron don't contribute to this MO. This is likely because these hydrogen atoms are roughly neutral, so the 1s electrons are too high in energy to contribute. |

|

|
MO17 in benzene and borazine. In both benzene and borazine this MO has a large amount of bonding character with a nodal plane in the plane of the molecule. It results from the in phase overlap of the 2p-orbitals adjacent to the ring. In benzene, each carbon contributes equally to this MO giving the MO a C6 rotational axis. In borazine however, there is a slightly larger contribution from the p-orbitals on nitrogen than on boron. This is because the 2p on nitrogen is lower in energy so contributes more to this bonding orbital. This gives this MO a C3 rotational axis. |

|

|
MO23 in benzene and borazine. These MOs are overall antibonding and result in the out of phase overlap of four p-orbitals perpendicular to the ring. In benzene, each of these 2p-orbitals contributes equally as they are equivalent. In borazine however, the two 2p-orbitals on boron contribute a larger amount than the two 2p-orbitals on nitrogen. This is because this MO is anti-bonding and the 2p on boron are higher in energy than on nitrogen, so are closer in energy to this MO. |
Aromaticity

Hückel proposed a few criteria which a molecule must meet in order to be considered aromatic. It must be cyclic, planar, have a continuous system of p-orbitals adjacent to the ring and contain 4n+2 π-electrons in this π-system. This approach to aromaticity suggests that the aromatic stabilization of benzene comes largely from the molecular orbital shown above with an area of electron density above and below the ring of the molecule (MO 17).
However, it is now well known that planarity is not a requirement for aromaticity. At 20K, it has been shown that benzene, in a crystal structure, adopts a chair conformation.[1] This shows a flaw in Huckel's theory and suggests that there is much more to aromaticity that he originally suggested. In fact, aromaticity is a word used to describe a number of stabilizing effects with the planar π-system being only one of these.
Sigma aromaticity, for example, is displayed in the MO shown. This is caused by the in-phase overlap of p-orbitals in the plane of the ring that face along the B-N bonds. This allows electrons in these p-orbitals to also delocalise over the aromatic molecule. Sigma aromaticity also exists in molecules that don't resemble anything suggested by Huckel. For example, stabilization due to aromaticity and destabilization due to anti-aromaticity has been shown to exist in inorganic cages.

Ng611 (talk) 19:57, 4 June 2018 (BST) Some really good points made here. I would expand on this discussion somewhat, with more reference to more recent models of aromaticity, and perhaps a discussion on experimental results that demonstrate aromaticity in these molecules?