Grt07:breakyourself2
Optimsation of BH3
A BH3 molecule was created in Gaussview and the bond lengths increased to 1.5A. The molecule was then optimised using Gaussian with the following low accuracy commands:
- Method (dictates the type of approximations used)- B3LYP
- Basis Set (determines the accuracy)- 3-21G

The optimised BH3 molecule had the following properties:
- B-H bond length 1.19435
- H-B-H bond angle 120
- Calculation type: FOPT
- Calculation method RB3LYP
- basis set 3-21G
- E(RB+HF-LYP) -26.46226438 a.u.
- RMS gradient norm 0.00000285 au
- dipole moment 0
- point group D3H
- http://hdl.handle.net/10042/to-5851
The computed bond lengths and H-B-H bond angles are identical to those found in the literature. This supports the statement that low basis sets are useful in computing the properties of small molecules with small atoms. The RMS gradient norm value of 0.00000285 means that the optimisation was successful because at the end of an optimisation the gradient should be close to 0. The real output file was also evaluated to check that the optimisation was successful:
Item Value Threshold Converged?
Maximum Force            0.000006     0.000450     YES
RMS     Force            0.000004     0.000300     YES
Maximum Displacement     0.000022     0.001800     YES
RMS     Displacement     0.000015     0.001200     YES
Predicted change in Energy=-1.886451D-10
Optimization completed.
   -- Stationary point found.
The fact that everything converged and a stationary point was found means that the optimisation calculation was successful.
Optimisation plots show the stages involved in optimising the given molecule. The total energy against optimisation step number graph shows the energy of the molecule after each optimisation step. In this case we can see that over the first 2 steps in the optimisation, there was a rapid decrease in energy of the BH3 molecule. The 3rd step produced another small change in energy and the final step barely reduced the total energy (if at all) of the molecule which is where the optimisation ended. The gradient of the line in this final step is what is shown in the summary as the RMS gradient norm, in this case 0.00000285au, which is a very small number hence the almost 0 gradient line in the graph. The RMS gradient against optimisation graph shows the change in the RMS gradient at each step of the optimisation.

The Molecular Orbitals of BH3
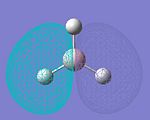
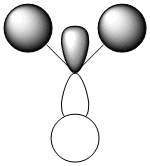
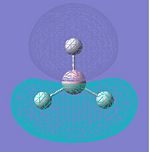
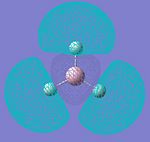
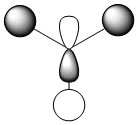
The molecular orbitals of BH3 were calculated by creating a new input file for Gaussian using the previously optimised molecule. The output file (http://hdl.handle.net/10042/to-5851) was opened and the molecular orbitals viewed; again using Gaussian. Below is a table showing the LCAO representation of BH3 along with the computed MO, the computed energy of the MO and a comparison of the two representations.
Natural Bond Orbital Analysis of BH3
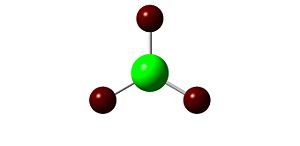
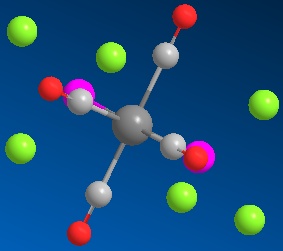
Natural Bond Orbital Analysis (NBO) can be used to determine the charge distribution over a molecule. The output file from the molecular orbital analysis of BH3 was opened and the charge distribution examined (see diagrams). The highly electropositive boron atom has a positive charge of 0.097 and hence the three hydrgogen atoms are carrying charges of -0.032 each (-0.096 in total) which means that the molecule has an overall neutral charge. In the coloured diagram, the green signifies a positive charge and the red signifies negative charge which gives a more visual representation of where electron density lies in the molecule.

Virational Analysis of BH3
A new input file for computing the frequencies of the BH3 molecule was created and submitted to Gaussian. The resulting output file (File:GEORGETURNER BH3 FREQ.LOG) was opened and examined to check whether the job completed successfully:
Low frequencies --- 1145.7148 1204.6589 1204.6599
The resulting energies confirm that the calculation has completed successfully.
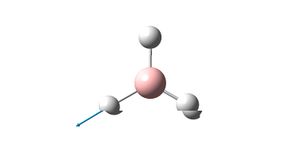
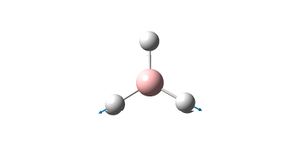
The vibrations were then analysed in the following table:
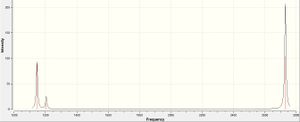
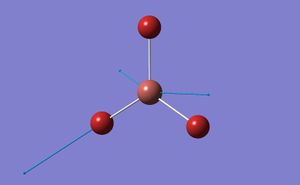
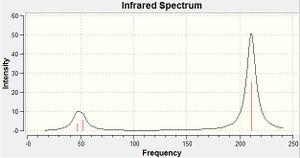
Although there are 6 vibrations in the molecule, there are only three visible peaks on the spectrum. This is due to 2 pairs of vibrations being degenerate. This should therefore lead to 4 peaks in the spectrum. However, the vibration at 2592.79 has an intensity of 0. This is due to the point group being A1' i.e. the vibration is symmetric and hence the vibrations of each bond cancel each other out which leads to the lack of this peak on the spectrum. These 2 effects lead to the spectrum containing just three peaks. The literature values for the frequencies of the BH3 molecule are 1125, 1640 and 2808 cm-1. These values do not correlate well with the computed values.
Analysis of TlBr3
A molecule of TlBr3 was created on gaussview and the symmetry limited to D3h. An input file was created for the optimisation of the molecule using the B3LYP method and the LanL2DZ basis set. The LanL2DZ basis set is a more accurate basis set than the LanL2MB basis set which was used for the BH3 molecule and also uses a pseudo-potential on the heavy Tl atom which also makes the optimisation more accurate:
- opt. Tl-Br bond length = 2.65095A
- opt. Br-Tl-Br bond angle 120
- calc. type = FOPT
- calc. method = RB3LYP
- basis set = LANL2DZ
- E(RB-HF-LYP) = -91.21812851 a.u.
- RMS gradient norm. = 0.00000088
- dipole moment 0
- point group d3h
The Tl-Br bond length of 2.65A recorded from the optimisation is close to the literature value of 2.512 which suggests that the method, basis set and pseudo-potential used were a good representation of the real molecule.
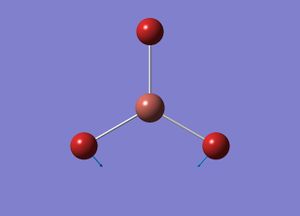
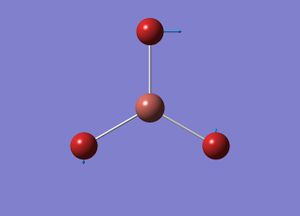
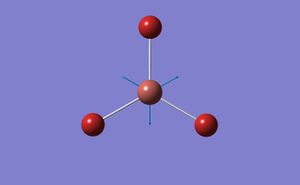
Vibrational analysis of TlBr3
| Vibration Diagram | Vibration Description | Vibration Energy / cm-1 | |
|---|---|---|---|
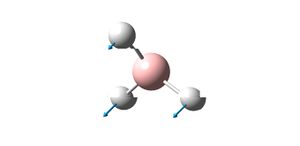 |
A2 | 1145.71 | |
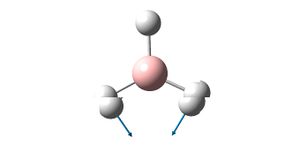 |
E' | 1204.66 | |
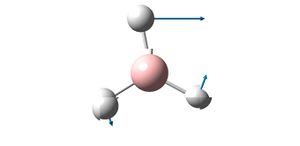 |
E' | 1204.66 | |
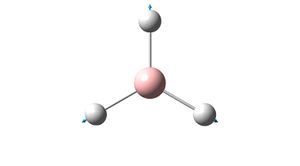 |
A1' | 2592.79 | |
 |
E' | 2731.31 | |
 |
E' | 2731.31 |
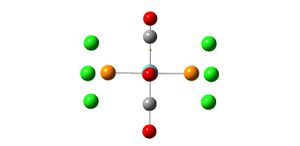
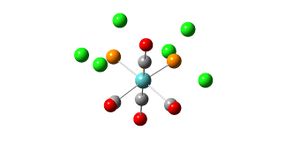
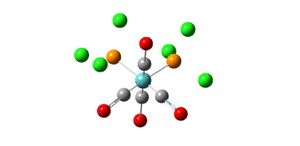
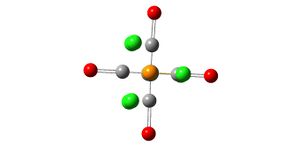
Optimisation of Mo(CO)4(PCl3)2
The structures were drawn in ChemBio3D Ultra and minimised by MM2 (Table 1) in an attempt to make the full optimisation of the isomers more rapid. they were then saved as gaussian input files
| Molecule | MM2 Energy |
|---|---|
| cis | 1.8013 kcal/mol |
| trans | 2.8829 kcal/mol |
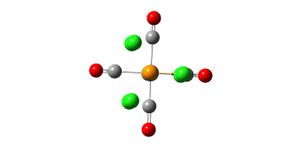
New input files were then created using gaussian for an optimisation using the B3LYP method, LANL2MB low level basis set and pseudo-potential and the convergence set as loose. These input files were submitted to SCAN and the resulting out files showed both isomers with no bonds between the P and Cl atoms. This is because Gaussview only recognises bonds that are within a certain range of lengths. Bonds in inorganic molecules tend to be longer than those in organic molecules (Gaussview's use is leaned more towards organic molecules) which is the case here and hence the P-Cl bonds are not recognised by Gaussview. The energies of the 2 isomers after this initial optimisation were noted (Table 2) and their structures manipulated in an attempt to reduce the total energy and produce a more accurate model of the isomers by running another optimisation using the LANL2DZ pseudo-potential and basis sets and a more accurate electronic convergence by adding "int=ultrafine scf=conver=9"
The out files can be found here cis: http://hdl.handle.net/10042/to-5863 and trans: http://hdl.handle.net/10042/to-5865
| Molecule | Energy/Hartrees |
|---|---|
| cis | -617.525 |
| trans | -617.522 |
 |
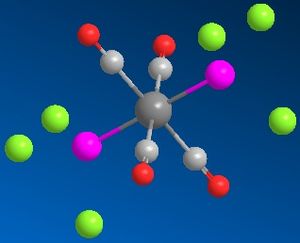 |
The resulting conformers had slightly lower energies (Table 3):
| Molecule | Energy/Hartrees |
|---|---|
| cis | -623.577 |
| trans | -623.576 |
From the resulting energies the trans isomer is reported to be very slightly lower in energy than the cis isomer. This is what would be expected as the 2 bulky PCl3 groups are further away from one another than in the cis isomer and hence there is less steric clashing in the molecule which would increase the overall energy. It may be expected that because of this the trans isomer would be much lower in energy relative to the cis isomer than what is reported. This is probably due to the inaccuracy of the basis set and hence a more accurate basis set such as 6-31G(d,p) may give a more accurate result.
Vibrational Analysis of Optimised Mo(CO)4(PCl3)2
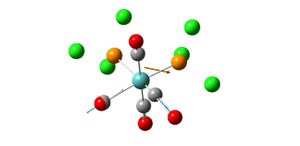
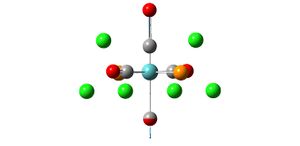
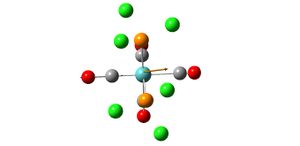
To ensure that the isomers had been optimised properly, new input files were created from the optimised structures to compute the frequencies of the 2 isomers. The following output files were analysed (cis: http://hdl.handle.net/10042/to-5866 trans: http://hdl.handle.net/10042/to-5867) and the results are discussed below. All of the obtained frequencies were positive which means that the retrieved optimised structure is the one with the lowest overall energy. Below are the low frequencies of the isomers which occur due to thermal energy at room temperature:
| Isomer | Vibration | Frequency / cm-1 |
|---|---|---|
| cis | 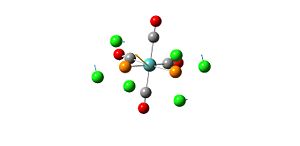 |
10.7368 |
| trans | 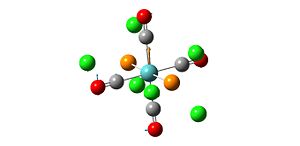 |
5.0572 |
| trans | 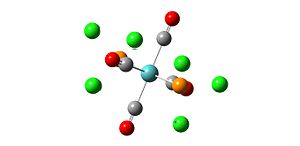 |
6.0596 |
The stretches of the C=O bonds are shown as these are the bonds which are usually used to analyse complexes with the structure Mo(L)4(L')2.
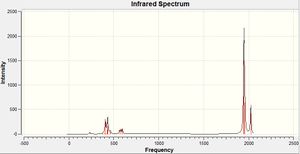

There are 4 C=O stretches calculated for each molecule however we only see all four peaks in the spectrum for the cis isomer. For the cis isomer this is the case because all the C=O ligands are in different environments and hence all 4 peaks are shown on the spectrum. For the trans isomer we see just 2 peaks on the spectrum. This is due to the low intensities of the stretches at 2030.98 and 1977.2 which arise from the symmetry of the trans isomer. If we compare these values for the C=O stretches with the literature values then we can evaluate how good a model has been used:
| Computed Value | Literature Value | ||
|---|---|---|---|
| cis | trans | cis | trans |
| 2023.54 | 2030.98 | 2072 | - |
| 1958.5 | 1977.2 | 2004 | - |
| 1948.94 | 1950.91 | 1994 | - |
| 1945.44 | 1950.28 | 1986 | 1896 |
The literature values for the C=O stretches are reasonably close to those computed by Gaussian (all about 50cm-1 out). The difference in frequencies may be attributed to the fact that the literature values were recorded in solution whereas the computed values are predicted as if the molecules were in the gas phase. Solvents can have a large stabilising effect on a molecule and hence different values are obtained when molecules are in solution rather than in the gas phase.
Below is a table displaying the computed bond lengths alongside the literature values
| Mo-P Bond Length | Mo-C Bond Length | C-O Bond Length | |
|---|---|---|---|
| Literature Value | 2.50 | 2.01 | 1.65 |
| Computed Value | 2.512 | 2.058 | 1.173 |
The computed values for the bond lengths are similar to those stated in the literature apart from the C=O bond length which is significantly smaller which suggests that this is the reason that the computed frequencies are out for the C=O stretches (shown above).
Mini-Project
Optimisation
The structures of the first isomers were taken from http://article.pubs.nrc-cnrc.gc.ca/ppv/RPViewDoc?issn=1480-3291&volume=55&issue=19&startPage=3384
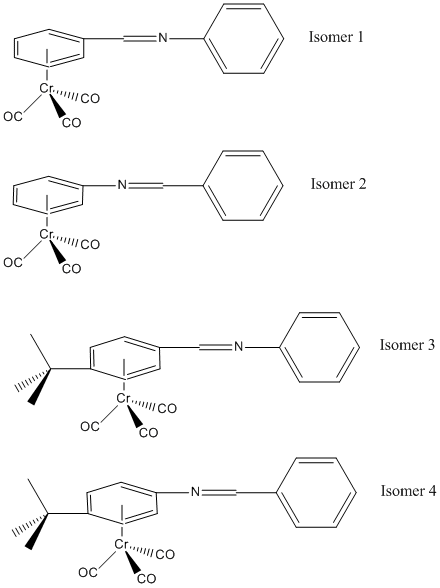
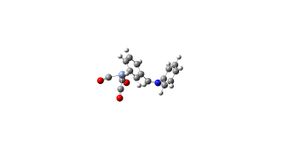
The 2 isomers (1,2,3,4,5,6-hexahapto - benzylideneaniline) tricarbonylchromium (isomer 1) and (1',2',3',4',5',6'-hexahapto-benzylideneaniline) tricarbonylchromium (isomer 2) are to be investigated. Their optimised structures will be compared and the most stable isomer determined. Two new isomers will then be created and their optimised structures compared to determine the most stable of these two isomers.
Initially, just the chromium-benzene fragment was optimised (http://hdl.handle.net/10042/to-5936) using an RB3LYP method with a 6-311G(d,p) basis set and an LanL2DZ pseudo-potential on the chromium:
- Calulation Type SP
- Calculation Method RB3LYP
- Basis Set Gen
- E(RB3LYP) -318.225 au
- RMS Gradient Norm -
- Dipole Moment 4.4912 Debye
- Point Group C1
- CPU Time 2min 48secs
This optimised fragment was then incorporated into the full structure of the molecule (excluding the CO groups)and optimised again:
- Calulation Type FOPT
- Calculation Method RB3LYP
- Basis Set Gen
- E(RB3LYP) -634.15
- RMS Gradient Norm 0.00511201
- Dipole Moment
- Point Group C1
- CPU Time 7hrs 27secs
Although the resulting output (http://hdl.handle.net/10042/to-5945) came up with the error message:
- CConnectionGLOG::Parse_GLOG()
- Gaussian error detected
- Last line read = 7069
I continued with the project as the RMS Gradient Norm was 0.00511201 which is close to 0 and hence close to being fully optimised. The partially optimised molecule was then resubmitted with the same settings. This seemed to complete the optimisation (https://spectradspace.lib.imperial.ac.uk:8443/dspace/handle/10042/to-5947) and took a very short time to complete:
- Calculation type SP
- Calculation method RB3LYP
- Basis Set Gen
- E(RB3LYP) -643.0654 a.u.
- Gradient Norm -
- Dipole moment 4.8885 Debye
- Point group C1
- Time 6 min 18secs
The frequencies (http://hdl.handle.net/10042/to-5958) and MOs (http://hdl.handle.net/10042/to-5959) were also computed but are not relevant to the rest of the project.
 |
 |
 |
| [[Image:|thumb|Isomer 3 after complete optimisation|
]] |
 |
The full structure of Isomer 1 was then created using the pre-optimised molecular fragment structure with the 3 carbonyl groups added to the chromium atom in an attempt to shorten the full optimisation time. This structure was then optimised (http://hdl.handle.net/10042/to-6108) with an RB3LYP method and a 6-311G(d,p) basis set and LanL2DZ pseudo-potential on the chromium:
- Calculation Type FOPT
- Calculation Method RB3LYP
- Basis Set GEN
- Total Energy -983.268
- RMS Gradient Norm 0.00960
- Dipole Moment 4.927 Debye
The resulting molecule showed that the carbonyl groups may not be fully optimised as they were not in a conformation that might be expected although one of the carbonyl groups looked like it may be hydrogen bonding with the hydrogen atom bonded to the carbon atom between the phenyl ring and the nitrogen atom however this does not account for the whole unexpected configuration of the carbonyl groups
A frequency analysis was undertaken on the 'optimised' Isomer 1(http://hdl.handle.net/10042/to-6109) with the same 6-311G(d,p) basis set and an LanL2DZ pseudo-potential on the chromium as was used on the optimisation. The frequency results confirmed that the molecule was not fully optimised as it showed 21 negative frequencies most of which were C=O stretches
The C=O groups on isomer 1 were then manipulated into a conformation which looked more realistic and a new input file created with the same parameters as the initial optimisation.
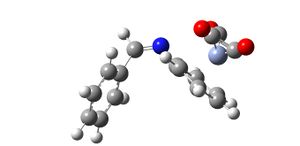
The 2nd isomer was optimised (http://hdl.handle.net/10042/to-6112) with an RB3LYP method with a 6-311G(d,p) basis set and an LanL2DZ pseudo-potential on the chromium. Although the job completed successfully it did not look as though the molecule had been optimised:
- Calculation Type FOPT
- Calculation Method RB3LYP
- Basis Set GEN
- Total Energy -831.614
- RMS Gradient Norm 0.338
- Dipole Moment 4.648
- Point Group C1
- 5hrs 33mins 52secs
The RMS Gradient Norm value of 0.338 taken from the .out file suggests that the isomer was not fully optimised and again just looking at the positioning of the C=O groups and the length of the bonds on the chromium it is easy to suspect that the molecule is not fully optimised. The bonding had also changed. Two of the carbons in two separate carbonyl group had bonded together with a double bond although the phenyl-chromium eta-6 remained.
The bond lengths and positioning of the CO groups were then manipulates and resubmitted to scan with the same parameters as before.
A frequency analysis was undertaken on isomer 2 after the initial optimisation (http://hdl.handle.net/10042/to-6118) to determine whether the optimisation had in fact worked. As suspected, there were 17 negative frequencies reported which confirms that the molecule had not been optimised fully.
Below is a table showing the Energies of Isomers 1 and 2 after the initial optimisation (Table 1):
| Isomer | Energy |
|---|---|
| 1 | -983.268 a.u. |
| 2 | -831.614 |
If we compare the energies from the initial optimisations we get the result that isomer 2 is more stable. However, these values can't really be trusted as the molecules are clearly not optimised. Looking at the structures i would indeed predict that isomer 2 would be more stable due to the nitrogen being closer to the phenyl ring involved in bonding to the chromium and hence the lone pair on the nitrogen can get involved in the aromaticity of the phenyl group and in turn may strengthen the bond between the phenyl group and the chromium.
To continue the investigation into the isomers, a bulky tertiary butyl group was added to the benzyl ring that is bonded to the chromium in the para position and the stability of the 2 new isomers examined. Isomers 3 and 4 are isomers 1 and 2 with the tertiary butyl group added respectively.
Isomer 3 was optimised () with the same boundaries as the first two isomers:
Isomer 4 was optimised (http://hdl.handle.net/10042/to-6115) with the same boundaries as the first two isomers:
- Calculation Type FOPT
- Calculation Method RB3LYP
- Basis Set GEN
- Total Energy -991.365
- RMS Gradient Norm 0.400
- Dipole Moment 2.7335 Debye
- CPU Time 10hrs 10 mins 5 secs
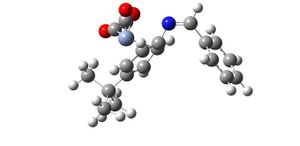
The value for the RMS Gradient Norm is too high for the molecule to be fully optimised and, again, by looking at the carbonyl ligands it is clear to see that it is not fully optimised. Some of the carbons seem to have bonded to one another and rather than an eta-6 bond between the phenyl group and the chromium as in the pre-optimisation conformation, the chromium now seems to be bonded to just one of the carbon atoms in the phenyl group. Another bonding change was that one of the carbonyl oxygens had bonded to the chromium atom. Although the molecule may not be fully optimised, this reconfiguration of the bonds may have happened because of the introduction of the tertiary butyl group on the phenyl ring. This increased steric clashing could have destabilised the original bonding so much that it had to change. However, the bond lengths and positioning of the CO groups were manipulated and resubmitted to SCAN with the same parameters as before.
The frequencies of Isomer 4 were computed (http://hdl.handle.net/10042/to-6127). The resulting .chk file showed 14 negative frequencies and hence the isomer was not optimised correctly.
Below is a table showing the Energies of Isomers 1 and 2:
| Molecule | Energy |
|---|---|
| cis | |
| trans |
Comparing the energies of isomers 3 and 4 we can see that...
Mini-Project Conclusion
Due to lengthy job times and the complexity of the molecules i was not able to find any very usable results. If i was to repeat the project i would probably use different pseudo-potentials and basis sets as the RB3LYP method with a 6-311G(d,p) basis set and an LanL2DZ pseudo-potential on the chromium that was used throughout did not end up being very effective. I would also manipulate the structures more before optimising all of the isomers in a way that would bring them closer to the expected result before starting the calculations.
Frequencies
Below is a table showing the vibrations of isomers 1 and 2:
| Vibration (cis) | Freqency / cm-1 | Intensity | Vibration (trans) | Frequency / cm-1 | Intensity |
|---|---|---|---|---|---|
| [[image:|thumb|300px]] | [[image:|thumb|300px]] | ||||
| [[image:|thumb|300px]] | [[image:|thumb|300px]] | ||||
| [[image:|thumb|300px]] | [[image:|thumb|300px]] | ||||
| [[image:|thumb|300px]] | [[image:|thumb|300px]] |
Below is a table showing the vibrations of isomers 3 and 4:
| Vibration (cis) | Freqency / cm-1 | Intensity | Vibration (trans) | Frequency / cm-1 | Intensity |
|---|---|---|---|---|---|
| [[image:|thumb|300px]] | [[image:|thumb|300px]] | ||||
| [[image:|thumb|300px]] | [[image:|thumb|300px]] | ||||
| [[image:|thumb|300px]] | [[image:|thumb|300px]] | ||||
| [[image:|thumb|300px]] | [[image:|thumb|300px]] |
References
1. http://article.pubs.nrc-cnrc.gc.ca/ppv/RPViewDoc?issn=1480-3291&volume=55&issue=19&startPage=3384


