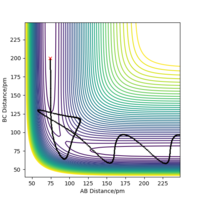
Gd1118yr2
Exercise 1
On a potential energy surface diagram, how is the transition state mathematically defined? How can the transition state be identified, and how can it be distinguished from a local minimum of the potential energy surface?
On the surface diagram, the transition state is mathematically defined as the saddle point of the diagram where f (r1) = f(r2) = f(r1r2) and f' (r1) = f' (r2) = f'(r1r2)= 0. It is not clear what these things mean. What is f (r1), f(r2) and f(r1r2)? And what is f' (r1), f' (r2) and f'(r1r2)? João (talk) 11:36, 14 June 2020 (BST)
(r1=rBC, r2=rAB)
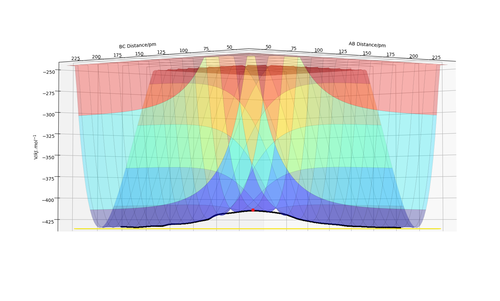
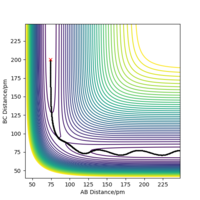
Transition state is "the maximum on the minimum energy path linking reactants and the products". The minimum energy path is the black line, and the transition state is shown as the red dot in Fig 1, the maximum of the line.
A local minimum of the potential energy surface is the minimum energy of the surface, the lowest possible energy a system can have What is the difference between a local minimum and an absolute minimum? How can you distinguish if the stationary point at a given geometry is a local minimum or a transition state? João (talk) 11:36, 14 June 2020 (BST) , while transition state is the maximum of the minimum energy path.
Report your best estimate of the transition state position (rts) and explain your reasoning illustrating it with a “Internuclear Distances vs Time” plot for a relevant trajectory.
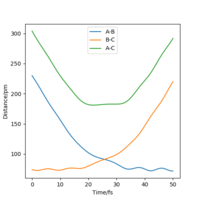
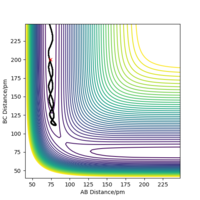
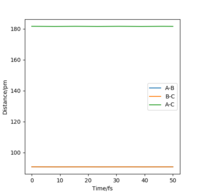
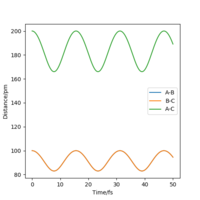
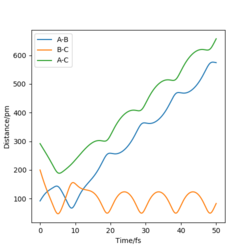
At transition state, it is expected that rAB = rBC. From Fig 2, The intersection occurs at roughly 25.5 seconds Surely this is not seconds! João (talk) 11:36, 14 June 2020 (BST)
after motion started. The bond distance at the time of transition state is about 90 pm.
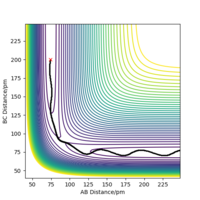
To get more precise result, p1 and p2 are set to 0.0 g.mol-1.pm.fs-1. Internuclear distances is adjusted around 90 pm (Fig 3.), and the result indicate that rts = 90.8 pm where there is no molecular vibration.
| r | 75 pm | 90.8 pm | 100 pm |
|---|---|---|---|
| Internuclear Distances vs Time | 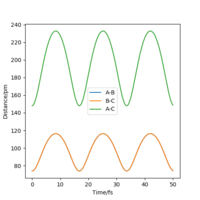 |
 |
|
Comment on how the mep and the trajectory you just calculated differ
| Plot type | Dynamics | MEP |
|---|---|---|
| Internuclear Distances vs Time | 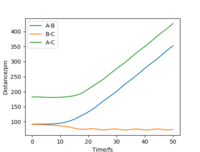 |
|
| Momenta vs Time | 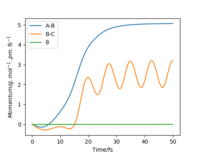 |
|
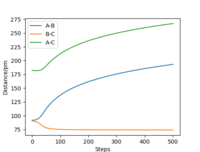
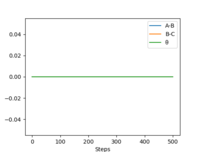
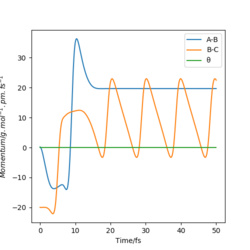
From Table 3. above, MEP ignores the vibrations of the product. In this case, the stretching of H2 molecule is ignored, indicated by the smooth line in "Internuclear Distances vs Time" plot Good. Pu12 (talk) 21:40, 11 June 2020 (BST) . The zero momenta of B-C is also the result of non-stretching. The other thing that is different is the time for complete reaction. It takes about 8 fs in MEP, while 18fs is required in Dynamics.
The thing that the two models agree is that the reaction goes to completion towards the product with the formation of A and B-C.
| Plot type | Dynamics | MEP |
|---|---|---|
| Internuclear Distances vs Time | 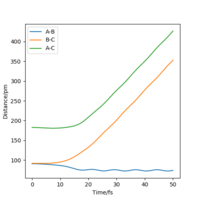 |
|
| Momenta vs Time | 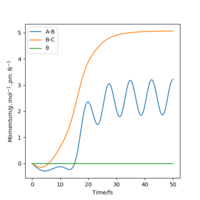 |
|
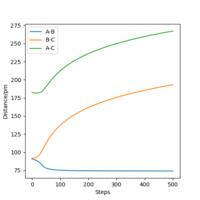
As can be seen from Table 3., after switching the initial features of r1 and r2, there is not any change in the shape of the diagrams. The only thing that differs from the previous experiment is that instead of forming A and B-C, the product now in this case is A-B and C.
Complete the table above by adding the total energy, whether the trajectory is reactive or unreactive, and provide a plot of the trajectory and a small description for what happens along the trajectory. What can you conclude from the table?
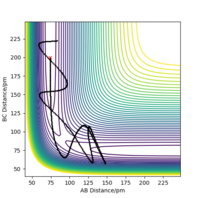
The results indicate that the hypothesis is wrong. Higher momenta and total kinetic energy not necessarily result in reaction. This can be concluded by comparing trial 1 & 2 and 4 &5. Reaction succeeded under condition 1,3 and 5. By comparing 1 & 2, 2 & 3 and 4 & 5, the difference between p1 and p2 seems to be an important factor for successful reaction. This can be further explored by keeping kinetic energy constant. Good. Pu12 (talk) 21:40, 11 June 2020 (BST)
Given the results you have obtained, how will Transition State Theory predictions for reaction rate values compare with experimental values?
Overall, Transition State Theory overestimates the rate constant because it simplifies the model by only consider the translation in the system. Besides, it does not allow re-crossing. However, as can be seen from previous simulations, there were vibrations in molecules and re-crossing can possibly happen. Under these circumstances, the reaction path will be higher in energy than the minimum values on the potential surface, while the theory assumes that transition state as a saddle point on the potential surface which is " the maximum in minimum energies". Therefore, the experimental activation energy is higher than theoretical prediction. Thus, experimental rate constant is lower the value calculated based on Transition State Theory. Furthurmore, Transition State Theory implies classical mechanics and ignores tunneling effect which is important for light particles such hydrogen. (lit.[1])
Exercise 2
By inspecting the potential energy surfaces, classify the F + H2 and H + HF reactions according to their energetics (endothermic or exothermic). How does this relate to the bond strength of the chemical species involved?
| H2+F | H+HF |
|---|---|
| A:H B:H C:F | A:F B:H C:H |
 |
|
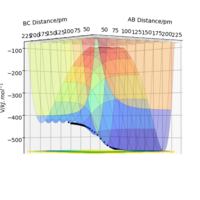
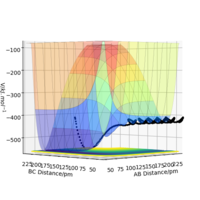
As can be seen from Table 4., the reaction between H2 and F is exothermic , while it is endothermic for H and HF. This can be identified by looking at the reaction pathway. Reactants have lies higher in energy than product in H2 and F reaction, while it is the reverse in H and HF. Good. Pu12 (talk) 21:40, 11 June 2020 (BST)
The result implies that H-H is weaker and longer than H-F. The energy change in the reaction is associated with bond breakage and formation. In this case, only H-H and H-F are either broken or formed. H-F stabilising effect override destabilising effect by H-H, hence stabilising the system in H2 + F reaction. The reaction is henceforth exothermic. It is the other way round for H+HF reaction.
Locate the approximate position of the transition state.
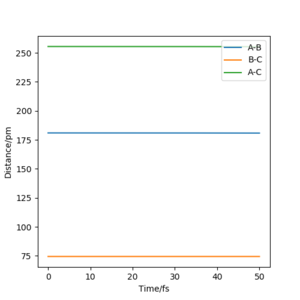
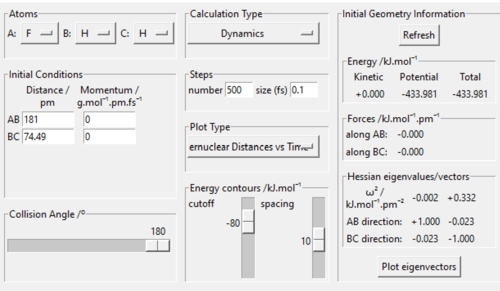
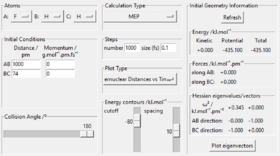
Hammond's postulate is used in the process. Since H+HF reaction is endothermic, the structure of transition state should resemble product H2. Similar to what was done to find the transition state of H-H-H, momenta were set to 0, length BC was set to 74 pm. By adjusting length AB and make minor changes to BC, transition state bond lengths F-H is found to be 181 pm, and that of H-H is 74.49 pm. By looking at "forces" section in Fig 4., both values give " 0 ", indicating that the transition state is reached.
Report the activation energy for both reactions
| H + HF | H-H-F | H2+F |
|---|---|---|
 |
 |
|
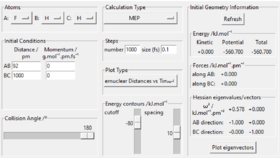
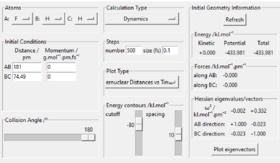
The energies of reactants and transition states were shown in Table 5., The distance between reactants in each reaction were set to 1000 pm so that they are separated apart. Activation energy is the difference in energy between transition state and reactants. The calculated activation energy for H2 + F is 1.12 kJ/mol, and for H + HF is 126.72 kJ/mol. Correct. Pu12 (talk) 21:40, 11 June 2020 (BST)
| H2+F to HF+H | HF+H to H2+F |
|---|---|
| 1.12 | 126.72 |
In light of the fact that energy is conserved, discuss the mechanism of release of the reaction energy. Explain how this could be confirmed experimentally.
| p1/g.mol-1.pm.fs-1 | Reactive? | Contour plot | Momenta vs Time |
|---|---|---|---|
| -5 | Yes | 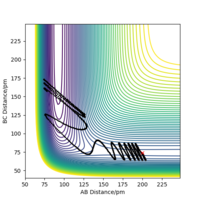 |
|
| -3 | No | 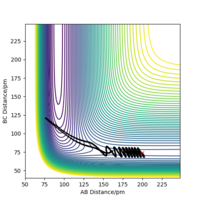 |
|
| -1 | No | 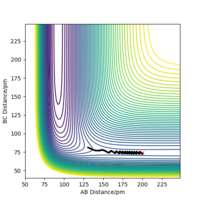 |
|
| 1 | No | 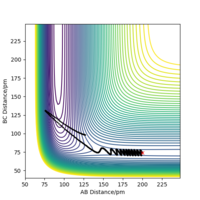 |
|
| 3 | Yes | 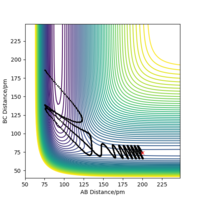 |
|
| 5 | No | 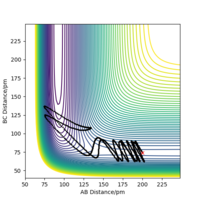 |
|
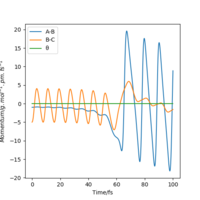
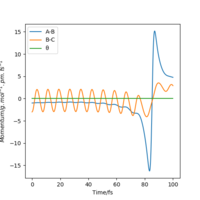
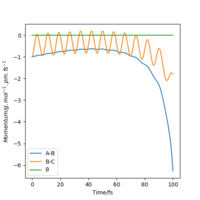
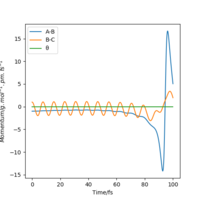
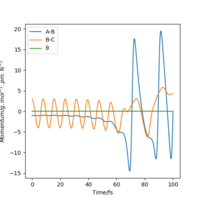
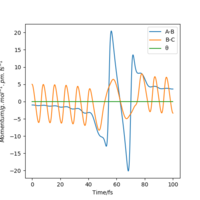
By examining six values of p2, in which the result is shown in Table 6., it can be concluded that whether a reaction will occur does not depend on the magnitude of kinetic energy It does to an extent. Pu12 (talk) 21:40, 11 June 2020 (BST) . The reaction is unlikely to happen at either small or large absolute values of p2. From momenta vs Time graphs above, it can be seen that the energy from reactants turn into H-F vibrational energy. Magnitude of vibration is crucial in successful reaction. If momentum is too small, two species cannot collide at all, while extraneous momentum result in the re-formation of reactants.
| Setup | Contour plot | Momenta vs Time | Reactive? |
|---|---|---|---|
 |
 |
 |
No |
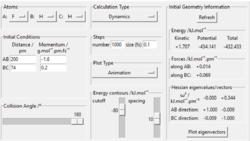
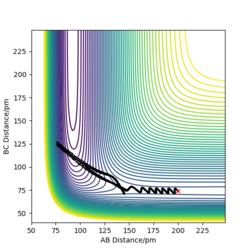
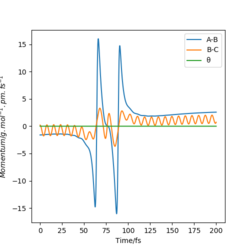
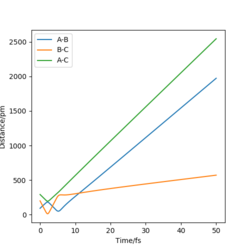
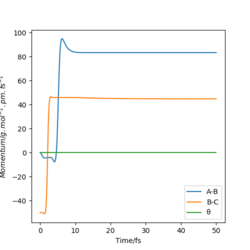
As can be seen from table above, no reaction takes place. F translational energy before and after collision are similar, this is the same for H-H translational and vibrational energy. During collision, H-F was formed but then went back to H-H due to vigorous vibration. Change in F momentum has much larger impact than H does.
| Setup | Internuclear Distances vs Time | Momenta vs Time | Reactive? |
|---|---|---|---|
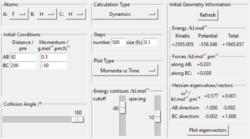 |
 |
 |
No |
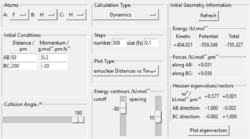 |
 |
 |
Yes |
How can you detect the increase in vibrational energy of the products?. Pu12 (talk) 21:40, 11 June 2020 (BST)
Discuss how the distribution of energy between different modes (translation and vibration) affect the efficiency of the reaction, and how this is influenced by the position of the transition state.
| Exp No. | Set-up | Skew plot |
|---|---|---|
| 1 | 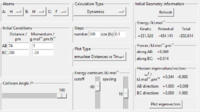 |
|
| 2 | 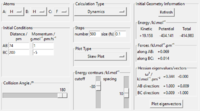 |

|
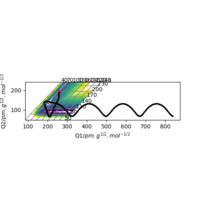
For exothermic reactions like F + H2, early transition state resemble reactants (Bell-Evans-Polanyi principle). [2]By comparing condition 5 & 6 in Table 6, it can be seen that higher weight on vibrational energy has adverse effect on efficiency. From additional experiment (Table 9.), increasing translational energy make a reaction likely to happen. Therefore, higher weight on translational energy is likely to boost the efficiency of the reaction.
For endothermic reactions like F + H2, late transition state resemble reactants (Bell-Evans-Polanyi principle). [2]By comparing the two experiments in table 8., it can be seen that increasing transitional energy of H does not increase the efficiency of reaction. By lower the translational energy, more energy is distributed to vibrational mode, the reaction succeeded. Therefore, higher weight on vibrational energy is likely to boost the efficiency of the reaction. Good. Pu12 (talk) 21:40, 11 June 2020 (BST)
The two groups of experiments agree with each other.

