Fp3917
BH3
Link to the BH3 log file
Method and Basis set
Method: B3LYP Basis Set: 6-31G
Optimisation of the BH3 molecule
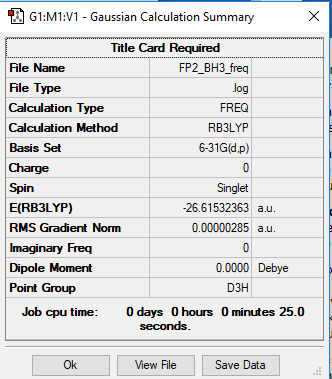
The BH3 summary file showing the optimisation of the molecule delivering D3h point group:
The Item table section of the summary file showing that the calculation has converged:
         Item               Value     Threshold  Converged?
 Maximum Force            0.000006     0.000450     YES
 RMS     Force            0.000003     0.000300     YES
 Maximum Displacement     0.000022     0.001800     YES
 RMS     Displacement     0.000011     0.001200     YES
 Predicted change in Energy=-1.914919D-10
 Optimization completed.
    -- Stationary point found.
Frequency Analysis of BH3
Low frequencies ---   -0.9385   -0.8438   -0.0054    5.8634   11.7841   11.8214

Low frequencies --- 1162.9968 1213.1829 1213.1856
A frequency table to show the vibrational frequencies of the vibrational modes of the BH3 molecule:
Jmol of BH3 Molecule
BH molecule |
BH3 IR spectrum
The IR spectrum of the optimised BH3 moleucle
In the IR spectrum there are fewer than 6 peaks, despite there being 6 vibrations. This is due to the presence of two doubly degenerate vibrations. These are the two bends at 1213.18 cm-1 and the two asymmetric stretches at 2715.44 cm-1. As a result, these four vibrational modes only manifest in 2 peaks. In addition, the symmetrical vibration mode at 2582.27 cm-1 does not lead to an overall change in dipole of the molecule and hence is also not observed in the spectrum.
Well explained with both reasons identified and good presentation. Just note that vibrational frequencies should be left to the nearest whole number. Smf115 (talk) 18:58, 1 June 2019 (BST)
The Molecular Orbital Diagram of BH3
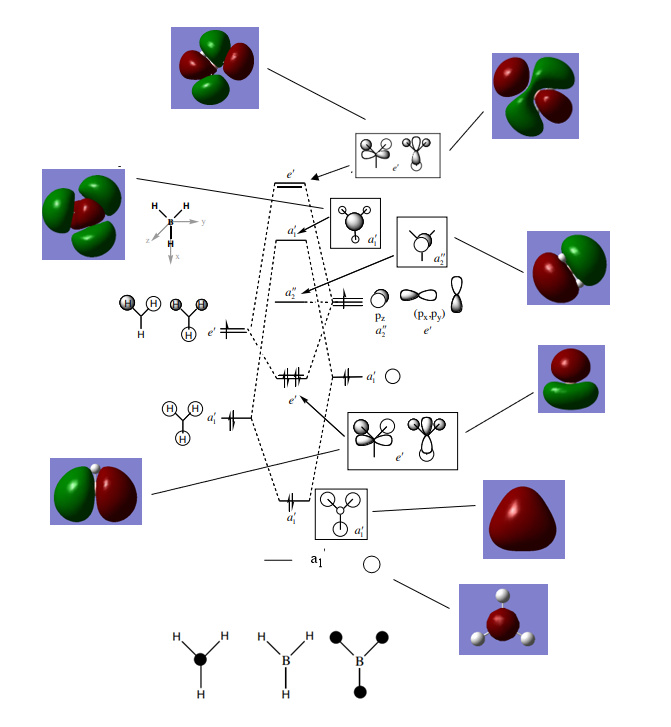
An annotated Molecular Orbital Diagram for the BH3 molecule, modified from: P.Hunt, 2018, Molecular Orbitals Problem Class One Answers Sheet, Imperial College London, delivered 2018. The diagram includes snapshots of the real MOs next to the LCAOs predicted from a qualitative combination of fragment orbitals.
Questions relating to the orbital diagram above:
1. Are there any significant differences between the real and LCAO MOs?
The LCAO orbitals qualitatively determined in the diagram result in MOs that have localised orbitals on each atom simply combined. The reality is that the orbitals are much more diffuse in nature and occupy larger regions of space, spanning multiple nuclear centres. As a result, our 'pencil and paper' method for qualitatively determining MOs through the LCAO gives a slightly misleading representation of the electron density distribution in the molecule. In addition, the LCAO can also give incorrect energy orderings of the orbitals, however, in this case the ordering appears to be correct as we are dealing with a relatively simple molecule with a few atomic orbitals.
2. What does this say about the accuracy and usefulness of qualitative MO theory?
Molecular Orbital theory is a valid simple alternative to Valence Bond Theory, which simply predicts electrons localised in a bond between two atoms, instead of the reality of more diffuse orbitals predicted by the Schrodinger Equation. As mentioned above, the energy orderings here are correct, specifically and most importantly, the positioning and orbital type of the HOMO/LUMO region, and as such qualitative MO theory appears to correctly predict energy levels in this case. However, as previously mentioned, as the complexity of the molecule increases, the usefulness of this method may be impaired.
Clear inclusion of the MOs on to the diagram and well-discussed answer. Smf115 (talk) 19:00, 1 June 2019 (BST)
Association Energy Calculation from Total Energies of Ammonia and Borane
Link to the NH3 file
NH3 optimisation
Method: B3LYP/6-31G
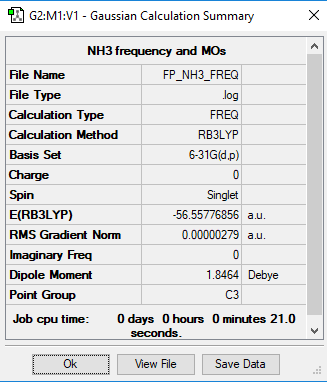
Table showing the NH3 Optimisation and confirming symmetry point group as C3v:
         Item               Value     Threshold  Converged?
 Maximum Force            0.000005     0.000450     YES
 RMS     Force            0.000003     0.000300     YES
 Maximum Displacement     0.000012     0.001800     YES
 RMS     Displacement     0.000006     0.001200     YES
 Predicted change in Energy=-8.435065D-11
 Optimization completed.
    -- Stationary point found.
NH3 Frequency Analysis
 Low frequencies ---  -11.6527  -11.6490   -0.0041    0.0333    0.1312   25.5724
 Low frequencies --- 1089.6616 1694.1736 1694.1736
NH3 Jmol file
BH molecule |
Link to the NH3BH3 Log file
NH3BH3 Optimisation
B3LYP/6-31G Level
         Item               Value     Threshold  Converged?
 Maximum Force            0.000132     0.000450     YES
 RMS     Force            0.000063     0.000300     YES
 Maximum Displacement     0.000809     0.001800     YES
 RMS     Displacement     0.000391     0.001200     YES
 Predicted change in Energy=-2.114129D-07
 Optimization completed.
    -- Stationary point found.
NH3BH3 Frequency Analysis
Low frequencies ---   -0.0570   -0.0490   -0.0073   10.1041   12.1139   14.5392

Low frequencies ---  265.8927  632.3719  640.1156
NH3BH3 Jmol file
BH molecule |
Association Energy Calculation
From the 6-31G optimised structures:
E(BH3): -26.62523
E(NH3): -56.55776
E(BH3NH3): -83.22469
ΔE = E(NH3BH3)-[E(NH3)+E(BH3)]
ΔE = -83.22469-(-56.55776-26.62523) AU
ΔE= -0.05106 AU
Thus ΔE = -135 kJ/mol
Is the B-N bond weak, medium or strong? What comparison have you made to come to this conclusion?
This dative covalent bond is relatively weak (-135 kJ/mol). The classification of bond strength can be clarified when you consider it in relation to other bonds, such as in comparison with other stronger bonds such as the C-C carbon bond. The bond energy of these bonds is -346 kJ/mol, thereofre much stronger than that of B-N. In addition, a more comparable bond strength is that of C-N (-305 kJ/mol). This again is a much stronger bond that calculated above and is an example of a non-dative covalent bond involving the same atom, N. As a result, it can be concluded that dative covalent bonds, such as that calculated for the above compound, are much weaker than non-dative bonds involving the same atoms. (All data from J. E. Huheey, E. A. Keiter, and R. L. Keiter, Inorganic Chemistry, 4th ed. (1993).
Excellent calculation and discussion with relevant, referenced bond enthalpies. Just note that when talking about the energy of the bond it is standard to use the positive values referring to bond dissociation. Smf115 (talk) 19:03, 1 June 2019 (BST)
Using Basis Sets and Pseudo-Potentials for NI3
Link to the NI3 log file
Optimisation and Frequency Analysis of NI3
Method: B3LYP Basis set: GEN
         Item               Value     Threshold  Converged?
 Maximum Force            0.000088     0.000450     YES
 RMS     Force            0.000044     0.000300     YES
 Maximum Displacement     0.000858     0.001800     YES
 RMS     Displacement     0.000481     0.001200     YES
 Predicted change in Energy=-1.193442D-07
 Optimization completed.
    -- Stationary point found.
 Low frequencies ---  -12.3844  -12.3780   -5.6127   -0.0040    0.0194    0.0711
 Low frequencies ---  100.9306  100.9314  147.2332
Jmol file
NI molecule |
The Optimised N-I Bond Distance
The optimised N-I distance: 2.184 Angstroms (3dp).
Project: Ionic Liquids as Designer Solvents
Optimisation and Frequency Analysis of [N(CH3)4]+
Link to the [N(CH3)4]+ Log file
[N(CH3)4]+ Optimisation
Method: B3LYP
Basis Set: 6-31G
Item tableː
         Item               Value     Threshold  Converged?
 Maximum Force            0.000079     0.000450     YES
 RMS     Force            0.000023     0.000300     YES
 Maximum Displacement     0.001538     0.001800     YES
 RMS     Displacement     0.000294     0.001200     YES
 Predicted change in Energy=-9.571933D-08
 Optimization completed.
    -- Stationary point found.
Low Frequenciesː
 Low frequencies ---    0.0009    0.0011    0.0011   34.9215   34.9215   34.9215
 Low frequencies ---  218.3774  317.2079  317.2079
Jmolː
NI molecule |
Optimisation and Frequency Analysis of [P(CH3)4]+
Link to the [P(CH3)4]+ Log file
[N(CH3)4]+ Optimisation
Method: B3LYP
Basis Set: 6-31G
Frequency Optimisation Summary Tableː
Item tableː
         Item               Value     Threshold  Converged?
 Maximum Force            0.000066     0.000450     YES
 RMS     Force            0.000050     0.000300     YES
 Maximum Displacement     0.001219     0.001800     YES
 RMS     Displacement     0.001065     0.001200     YES
 Predicted change in Energy=-1.200686D-06
 Optimization completed.
    -- Stationary point found.
Low Frequenciesː
 Low frequencies ---   -0.0025   -0.0020   -0.0013   52.5253   52.5253   52.5253
 Low frequencies ---  189.2279  213.8449  213.8449
Jmolː
NI molecule |
Very well presented structure information (apart from the slight error in the heading above!) with the basis-set and method for each calculation included and good consideration given to the symmetries of the molecules in the calculations. Smf115 (talk) 21:21, 3 June 2019 (BST)
Charge Distribution Comparisons
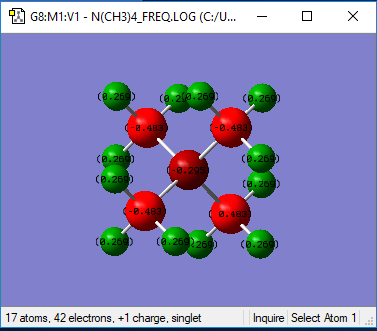
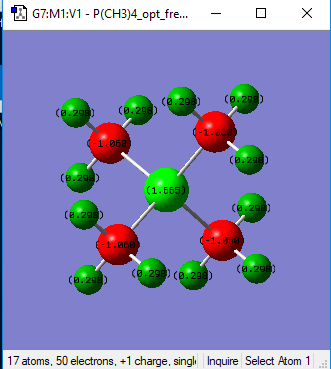
Charge Distribution analysis was conducted colouring atoms by charge within the same colour rangeː -0.470 - 0.470. This was chosen as the same range for both molecules and the largest range that allowed a clear comparison of the charge distribution without making any of the atoms too dark. This charge distribution clearly shows the difference in charge distribution between having a nitrogen atom as a central atom or a more electropositive P atom. This difference is discussed below in the table.
[N(CH3)4]+ Charge Analysis
[P(CH3)4]+ Charge analysis
Charge Comparison Analysis
Summary and Comparison Tableː
| Atom | [P(CH3)4]+ | [N(CH3)4]+ | Comparison |
|---|---|---|---|
| Heteroatom (P/N) | 1.665 | -0.295 | N and P atoms are both in the same group of the period table (group 5), however P is in the third row, whilst N is in the second row. This influences their electronegativities as N and P have electronegativity values of 3.04 and 2.19 respectively (Data from A.L. Allred, J. Inorg. Nucl. Chem., 1961, 17, 215.). The characteristic of P being a less electronegative atom is reflected in the comparison of charge distribution between the two molecules, P has a much more positive value as the atom is able to accommodate more of the positive charge in contrast to the more electronegative N, which is better at stabilising negative charge as, by definition, it has a greater tendency to attract electron density. In this case, the positive charge is mostly accommodated on the electropositive hydrogen atoms (see below). In addition, P is in the third row of the periodic table and as such is much more diffuse than N. This diffuse nature results in a lower charge density on the atom, further contributing to stabilising the positive charge. |
| C | -1.060 | -0.483 | The electronegativity of the C atom is 2.55, therefore C is more electronegative than P but not more than N. As a result, there will be more electron density on the C atom in a C-P bond in contrast to the C-N bond, where the charge distribution between C-Heteroatom is reversed due to the higher electronegativity of N, meaning the Nitrogen atom attracts a greater amount of electron density. |
| H | 0.298 | 0.269 | The H atoms are the most electropositive components of both molecules and as such, accommodate the greatest amount of positive charge. There is not a great difference between the charge on the H atom between the two structures. This is because any inductive effects are through bond effects and so fall off rapidly with distance. |
Correct NBO charges and a very good charge analysis in terms of the relative electronegativities with referenced values. You've also considered other effects such as the diffuse nature of the P orbitals, this could have also been used to rationalise the differences in the P and H charges despite very similar electronegativities. To improve, while a uniform charge distribution was used across both ILs, a larger range should have been used to highlight the differences more. Smf115 (talk) 21:34, 3 June 2019 (BST)
Discussion of the validity of the traditional Lewis Structure Representationː
The traditional Lewis structure representation, with the positive charge situated on the N atom is incorrect. The formal positive charge situated on the N atom gives the impression that the N atom is able to accommodate and stabilise positive charge and so is an electron deficient atom. We know this to be incorrect from the above analysis of charge distribution which shows there to be a large amount of negative charge on the N atom. The positive charge is actually located spread out around the electropositive H atoms on the methyl groups for this cation as these are the most electropositive atoms in this ion and hence are best able to accommodate the positive charge relative to the more electronegative N and C atoms. The two models contradict each other as in the Lewis structure model, the N atom appears to be electron deficient and stabilising a positive charge, given it is forming 4 bonds. However, this simple picture of electrons being localised in individual bonds is incorrect and instead electrons distribute themselves around the whole structure as shown by MO theory, therefore leading to increased electron density build up on the N atom due to its ability to attract electrons by definition of its high electronegativity.
Good analysis of how the real charge distribution differs from the traditional picture, however, you needed to consider why formal electron counting actually results in the +1 charge arising traditionally. Smf115 (talk) 21:37, 3 June 2019 (BST)
LCAO MO Diagrams
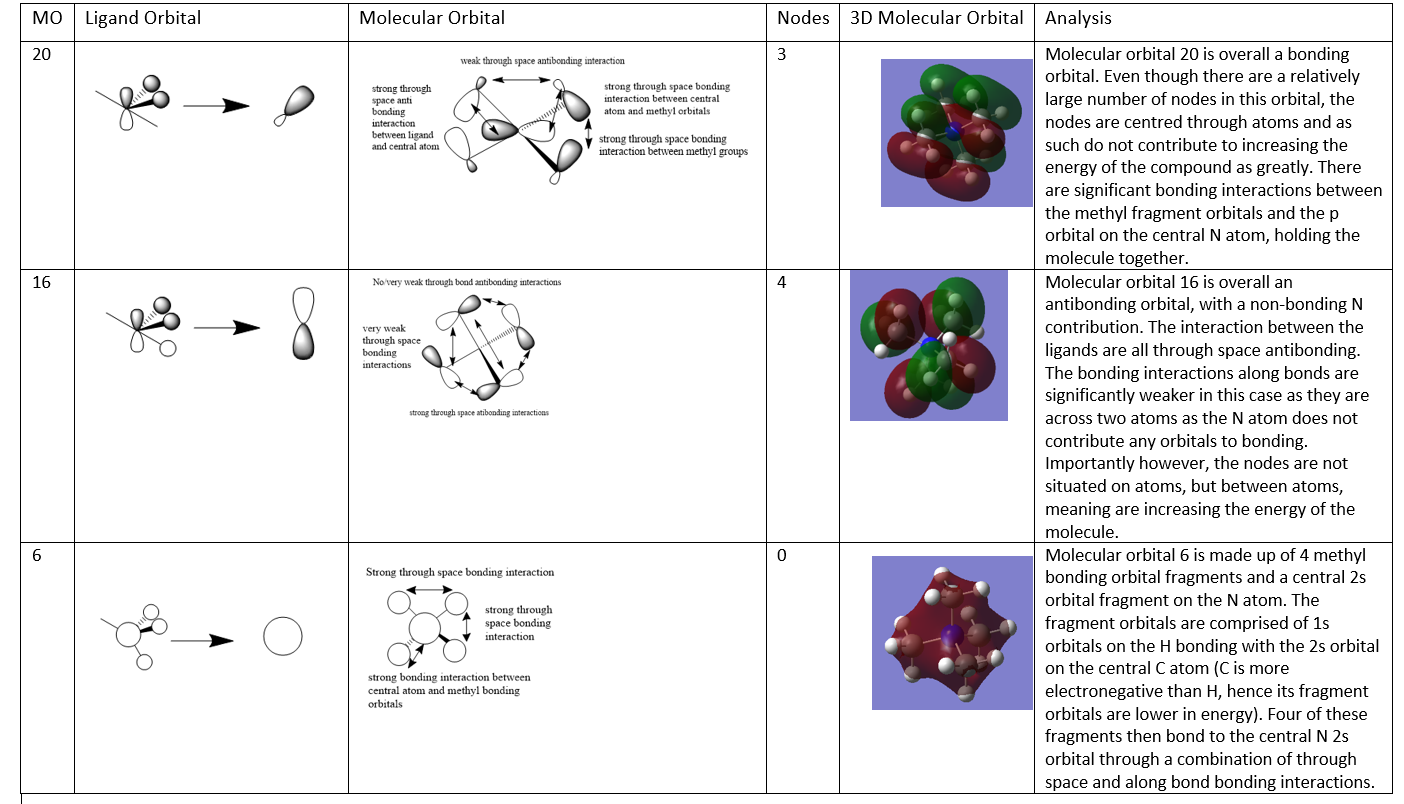
Molecular Orbital Analysis Tableː
A good range of MOs selected and a decent attempt at the analysis and evaluating the character of the MOs. Your FOs are ok but MO 16 is incorrect, it might have helped to consider the BH3 MO diagram and the lack of contribution on one of the H's of the Me groups to recognise the FO. To improve, the LCAOs could have been drawn a bit more consistently/clearly, particularly MO 20 (although it isn't an easy one to draw!) Smf115 (talk) 21:47, 3 June 2019 (BST)
Overall, a good report with a very strong first section! Smf115 (talk) 21:47, 3 June 2019 (BST)

