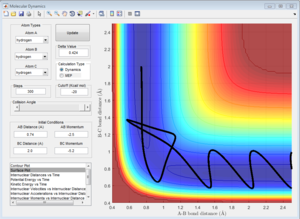
Eo00842229
H + H2 System
Question 1 - Gradients at Transition State and Minimum
The total value of the potential energy surface at the minimum and at the transition structure will both be zero.
Minima will have a positive value for the second derivative in every axial direction of the energy potential surface whereas a transition state will have a positive value for the second derivative in all axial directions apart from in the reaction pathway.
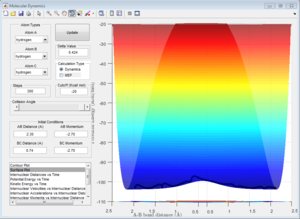
Using the reaction pathway as axis helps to tell the difference between these two points as the second derivative of the minima will indicate a minimum whereas that of that of the transition state will indicate a maximum.
Question 2 - Trajectories from r1 = r2
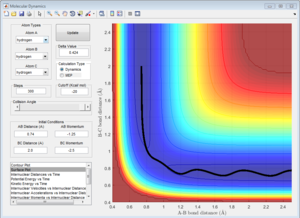
To calculate the transition state position, rts, an initial inter-nuclear distance of 1 Å was used with momentum of 0 for both distances AB and BC. Figure 2 shows a vibrating structure about local minimum of the reaction coordinate.
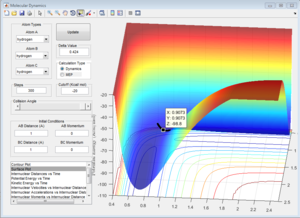
A plot Inter-nuclear Distance vs Time with a value close to the transition state position determined by moving the data cursor up and down to find a minimum inter-nuclear position showed that there was some vibration as the inter-nuclear distances slightly change over time.
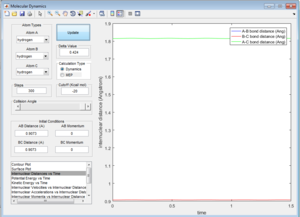
Trying values above and below this initial value for the transition state position allowed to precisely find the position by choosing the value for rts that gave little to no change in inter-nuclear distance with changing time. rts = 0.908 Å (3 d.p.)

Question 3 - Trajectories from r1 = rts+δ, r2 = rts
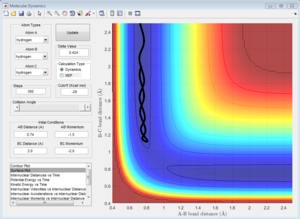
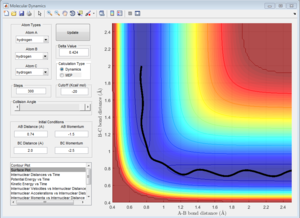
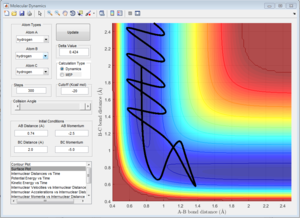
Comparing Figure 5 and Figure 6, it can be seen that the MEP calculation shows a trajectory that does show any vibration whereas the trajectory calculated using the Dynamics calculation does. The MEP calculation also doesn't show any vibration in the bonds whereas the Dynamic calculation does, even with zero momentum for all atoms in the system.
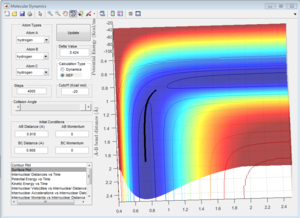
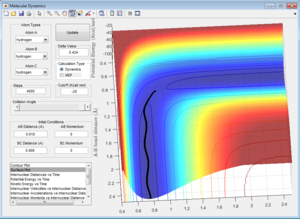
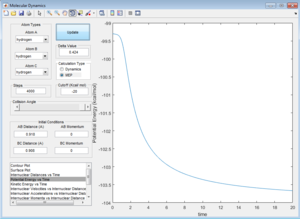
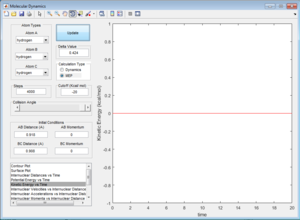
This is due to the fact that the MEP resets the velocity to zero for each time step, this therefore doesn't allow the system to transfer kinetic energy into potential energy, keeping the trajectory of the system along the pathway with minimum potential energy. This can be seen when observing Figure 7 and Figure 8.
Question 4 - Reactive and unreactive trajectories
Question 5 - Transition State Theory
The Transition State Theory (TST) assumes that all the molecules obey classical mechanics and works well for heavier molecules but when molecules are very light and quantum mechanical effects are more apparent (i.e. quantum tunneling), TST has its limitations. It also assumes that once the reactants cross the transition state, the reaction will go to completion. In addition, TST assumes that molecules obey the Bolztmann distribution when they occupy energy levels as well as assuming the rate of the reaction rate depends entirely on the transition state. [1] [2]
Due to the fact that we are dealing with light molecules in this system, TST would not match up very well with experimental values as many of the assumptions would be invalid especially when quantum effects have more of an influence (i.e. quantum tunneling). [3]
(Would predicted values be higher or lower than expected? Did you notice any barrier recrossing in your simulations? How does that reflect on TST's assumptions? Lt912 (talk) 03:58, 2 June 2017 (BST))
F - H - H System
Question 6 - PES Inspection
From Figure 9 it can be seen that the system where the F+ travels towards the H2 molecule to produce H-F as products is an exothermic as the reactants are higher in potential energy than the products.
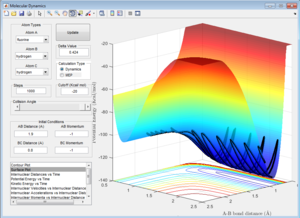
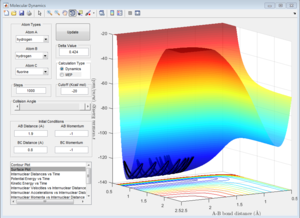
From Figure 10 it can be seen that the system where H+ travels towards the HF molecule to produce H2 as products is an endothermic as the reactants are lower in potential energy than the products.
Using tabulated bond enthalpies, the enthalpy of reaction (ΔHR) can be calculated simply by considering the enthalpy of bonds broken (ΔHbroken) and the bonds formed (ΔHformed):
ΔHR = ΔHbroken - ΔHformed
H-F Bond = 569 kJ/mol and H-H Bond = 436 kJ/mol.[4]
For the F+ + H2 → HF + H+ system ΔHR = -133 kJ/mol (exothermic) and for the H+ + HF → H2 + F+ system ΔHR = +133 kJ/mol which confirms the prediction of the initial potential surface calculations.
Question 7 - Approximate Transition State Position
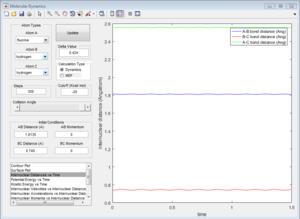
The approximate position for the transition state is rHaHb = 0.74 Å and rHbF = 1.81 Å (3 s.f.). This was achieved using a similar trial and error method used in Question 2 with the help of the data cursor.
From Figure 11 it can be seen that when this separation is given zero momentum there is virtually no resulting movement and therefore supports that these values are a good approximation for the position of the transition state.
For the opposite reaction, the transition state will also be in the same position for the opposite reaction since they pass through the same transition state.
Question 8 - Activation Energies
The activation energy is defined as the difference in potential energy from the reactants to the products. Using one system only, it is possible to calculate the activation energy for both reactions as they are essentially the same but in reverse, the difference between reactants and the transition state tells you the activation energy of the reverse reaction.
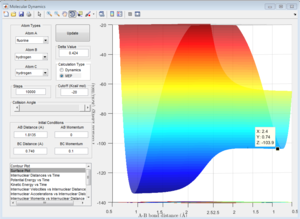

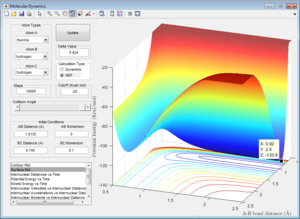
The activation energy for H2 + F+ → H+ + HF = (-103.7) - (-103.9) = 0.2 kcal/mol = 0.84 kj/mol.
The activation energy for H+ + HF → H2 + F+ = (-103.7) - (-133.9) = 30.2 kcal/mol = 126 kj/mol.
Question 9 - Reaction Dynamics - Reaction Energy
Energy can only be transformed from one form to another. Potential energy can be transformed into vibrational energy and the opposite is also true. for the exothermic reaction of F+ + H2 → HF + H+ system ΔHR, the excess potential energy can be converted to kinetic energy (vibrational energy or translational energy). Some of the energy is also lost as heat to the surroundings.
(What surroundings? What is heat? Lt912 (talk) 04:01, 2 June 2017 (BST))
The extent of reaction can be confirmed experimentally by a calorimetry to measure the transfer of heat to and from the system. The difference in vibrational energy of the products and reactants can be probed using IR spectroscopy methods to give a more detailed distribution of energy conversions between the reactants and products.
(How exactly would you use IR to do this? Lt912 (talk) 04:01, 2 June 2017 (BST))
Question 10 - Reaction Dynamics - Polanyi's empirical Rules
Discuss how the distribution of energy between different modes (translation and vibration) affect the efficiency of the reaction, and how this is influenced by the position of the transition state.
According to Poliyani's Rules, a reaction that proceeds via an early transition state (exothermic), relative translational energy between the colliding species is the most important factor in overcoming the activation energy. For a reaction with a late transition state (endothermic), relative vibrational energies is more of a governing factor in the efficacy of the reaction.[5]
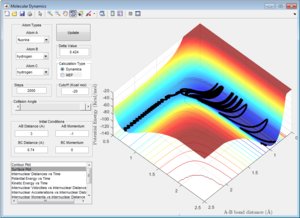
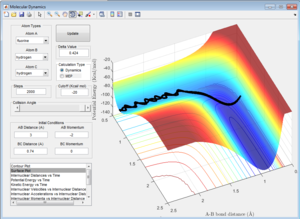
Comparing Figure 15 and Figure 16 it is clear that there is a larger vibrational contribution (greater amplitude of oscillation in Figure 16) has a significant effect on the reaction. This reaction is exothermic and according to Polanyi's rules, a larger translational contribution would yield a more efficient reaction.
Although Figure 15 shows a successful reaction, a significant amount of vibrational energy is observed in the formation of the products suggesting that there is still significant amount of vibrational energy in the system making the reaction inefficient. This can be seen in the recrossing of the transition state which is quite wasteful as energy is used to arrange the atoms several times over, illustrating that Polanyi's Rules have a profound effect on the efficiency of this reaction.
References
- ↑ Moore, John W., Kinetics and Mechanism, A Wiley-Intersection publication, John Wiley & Sons, p. 166, 1981.
- ↑ Levine, Ira N., Physical Chemistry, 6th ed, McGraw-Hill, p. 893, 2009.
- ↑ Miller, William H., Semi-classical limit of quantum mechanical transition state theory for nonseparable systems, J. Chem. Phys., Vol. 62, No. 5, 1975.
- ↑ T. L. Cottrell, The Strengths of Chemical Bonds, 2nd ed., Butterworth, London, 1958
- ↑ Guo, Hua, Control of chemical reactivity by transition-state and beyond, Chem. Sci., 7,pp 3992-4003, 2016

