Emmanuel Wiki:07812388086
Short Report on common diatomic gases and compounds that they form together (NH3 and ClF).
This wiki contains information on N2, H2, Cl2 and F2 as well as NH3 and ClF. This report lays out the results of analysis of the above mentioned elements and compounds and offers critical comments where applicable.
H2
General Information
General information about the H2 was obtained from analysis using GaussView 5.0.9 (with Gaussian 09W performing all the analysis). The relevant information is presented below:
Molecule : H2
Calculation Method : RB3LYP
Basic Set : 6-31G(d,p)
Final Energy E(RB3LYP) : -1.17853936 a.u.
RMS Gradient : 0.00000017 a.u.
Point Group : D∞h
H-H Bond Length : 0.74279 Å
Bond Angle : 180.00 ° as this is a linear molecule
"Item" Table for Hydrogen molecule from GaussView 5.0.9
The "Item" Table allows for the determination of the reliability of the optimisation. As all of the forces and displacements converged, we can assume that the optimisation was completed successfully by Gaussian 09W and that the molecule used for analysis is a suitable representation of the ground-state of molecule in question (H2 in this case).
         Item               Value     Threshold  Converged?
 Maximum Force            0.000000     0.000450     YES
 RMS     Force            0.000000     0.000300     YES
 Maximum Displacement     0.000000     0.001800     YES
 RMS     Displacement     0.000001     0.001200     YES
Interactive model of Hydrogen molecule
Below is an interactive ball and stick model of the Hydrogen molecule allowing you to visualise the molecule and also explore the symmetry exhibited by the molecule.
We can see that the molecule adopts a linear structure (predicted by Gaussian 09W). This fits with structures predicted by VSEPR for the Hydrogen molecule.[1]
Hydrogen Molecule |
Link to LOG file:File:EOPOKU H2 OPTF POP.LOG
Vibrational Modes
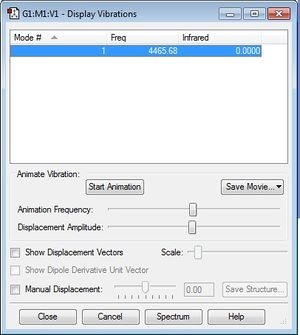
The frequency displayed corresponds to a bond stretch between atoms in the molecule, for which we only expect one as it is a linear diatomic molecule.
The molecule is not infrared-active as there is no change in dipole moment as the bond stretches.
Charge Distribution
It is expected that there will be an overall even charge distribution over the H2 molecule as it is a hetero-diatomic molecule and there are is no difference in electronegativity across the two atoms.
N2
General Information
General information about the N2 was obtained from analysis using GaussView 5.0.9 (with Gaussian 09W performing all the analysis). The relevant information is presented below:
Molecule : N2
Calculation Method : RB3LYP
Basic Set : 6-31G(d,p)
Final Energy E(RB3LYP) : -109.52412868 a.u.
RMS Gradient : 0.00000060 a.u.
Point Group : D∞h
N-N Bond Length : 1.10550 Å
Bond Angle : 180.00 ° as it is a linear molecule
"Item" Table for Nitrogen molecule from GaussView 5.0.9
The "Item" Table allows for the determination of the reliability of the optimisation. As all of the forces and displacements converged, we can assume that the optimisation was completed successfully by Gaussian 09W and that the molecule used for analysis is a suitable representation of the ground-state of molecule in question (N2 in this case).
         Item               Value     Threshold  Converged?
 Maximum Force            0.000001     0.000450     YES
 RMS     Force            0.000001     0.000300     YES
 Maximum Displacement     0.000000     0.001800     YES
 RMS     Displacement     0.000000     0.001200     YES
Interactive model of Nitrogen molecule
Below is an interactive ball and stick model of the Nitrogen molecule allowing you to visualise the molecule and also explore the symmetry exhibited by the molecule.
We can see that the molecule adopts a linear structure (predicted by Gaussian 09W). This fits with structures predicted by VSEPR for the Nitrogen molecule.[1]
Nitrogen Molecule |
Link to LOG file:File:EOPOKU N2 OPTF POP.LOG
Vibrational Modes
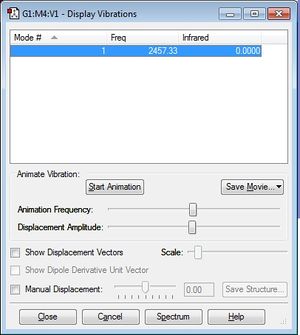
The frequency displayed corresponds to a bond stretch between atoms in the molecule, for which we only expect one as it is a linear molecule.
Charge Distribution
It is expected that there will be an overall even charge distribution over the N2 molecule as it is a hetero-diatomic molecule and there are is no difference in electronegativity across the two atoms, just like in the H2 molecule above.
NH3
NH3 is formed from N2 and H2, and is a very important reaction in industry. Ammonia (NH3) is used to produce fertilizers which are essential to the sustenance of an ever increasing population of humans on earth.
General Information
General information about the NH3 was obtained from analysis using GaussView 5.0.9 (with Gaussian 09W performing all the analysis). The relevant information is presented below:
Molecule : NH3
Calculation Method : RB3LYP
Basic Set : 6-31G(d,p)
Final Energy E(RB3LYP) : -56.55776873 a.u.
RMS Gradient : 0.00000485 a.u.
Point Group : C3v
N-H Bond Length : 1.01798 Å
H-N-H Bond Angle : 105.741 °
"Item" Table for Ammonia molecule from GaussView 5.0.9
The "Item" Table allows for the determination of the reliability of the optimisation. As all of the forces and displacements converged, we can assume that the optimisation was completed successfully by Gaussian 09W and that the molecule used for analysis is a suitable representation of the ground-state of molecule in question (NH3 in this case).
         Item               Value     Threshold  Converged?
 Maximum Force            0.000004     0.000450     YES
 RMS     Force            0.000004     0.000300     YES
 Maximum Displacement     0.000072     0.001800     YES
 RMS     Displacement     0.000035     0.001200     YES
Interactive model of Ammonia molecule
Below is an interactive ball and stick model of the Ammonia molecule allowing you to visualise the molecule and also explore the symmetry exhibited by the molecule.
We can see that the molecule adopts a tetrahedral pseudo-structure with the lone pair of electrons on the Nitrogen atom acting to repel any electron density between the hydrogen and the central nitrogen atom - the structure predicted by Gaussian 09W is trigonal pyramidal which fits with structures predicted by VSEPR for the Ammonia molecule.[1]
Ammonia Molecule |
Link to LOG file:File:EOPOKU NH3 OPTF POP.LOG
Vibrational Modes
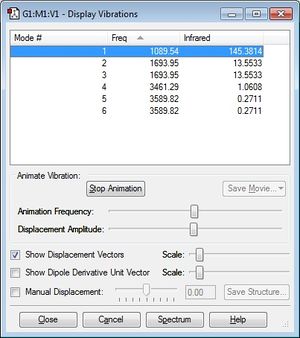
1. We expect to see 6 modes of vibration according to the 3N-6 rule.
2. Vibrational Modes 2 and 3 as well as 5 and 6 are degenerate.
3. Modes 1,2 and 3 are "bending modes" and 4,5 and 6 are "bond stretch vibrations".
4. Vibrational mode 4 is highly symmetric.
5. Vibration mode 1 is known as the "umbrella" mode.
6. 3 bands are expected from an experimental spectrum of gaseous ammonia. From the image below we can deduce that the column titled "Infrared" will be on the y-axis as frequency on an IR Spectrum is on the x-axis. The value for the last three frequencies are relatively small compared to the others and are likely to not show up in an IR Spectrum, thus 3 bands are expected.
Charge Distribution
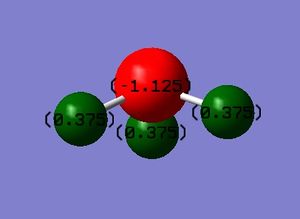
It is expected for the Nitrogen atom (red) to be negatively charged as it is more electronegative than the Hydrogen and it would attract the bonding electrons towards it more than the Hydrogen atoms (green) would, making the hydrogen atoms carry a slightly positive charge. The charge distribution on the Nitrogen atom is -1.125 and +0.375 on each Hydrogen molecule.
The Haber-Bosch Process (N2 + H2)
N2 + 3 H2 --> 2NH3
We can calculate the energy for the above reaction using the energy calculated during the optimisation process.
Calculating ΔE for the reaction
E(NH3) = -56.55776873 a.u.
2*E(NH3) = -113.11553746 a.u.
E(N2) = -109.52412868 a.u.
E(H2) = -1.17853936 a.u.
3*E(H2) = -3.53561808 a.u.
ΔE=2*E(NH3)-[E(N2)+3*E(H2)] = -0.0557907 a.u.
The value of ΔE ≈ -146.48 kJ/mol suggesting that that ammonia is more stable than the gaseous reactants. This is because there is a negative energy difference between the isolated gaseous reactants compared to that of the ammonia product (accounting for stoichiometry).
This value is very different to the experimentally determined value of -91.40 kJ/mol. This could be due to the fact that entropic factors weren't considered in the calculations made by Gauss. The calculation would also not have accounted for temperature, pressure and solvation effects which have a say on the final value obtained for ΔE. The fact that the conditions Gauss bases it's calculations on are not the same as those used in this industrial process could also play a part.[2]
Cl2
General Information
General information about the Cl2 was obtained from analysis using GaussView 5.0.9 (with Gaussian 09W performing all the analysis). The relevant information is presented below:
Molecule : Cl2
Calculation Method : RB3LYP
Basic Set : 6-31G(d,p)
Final Energy E(RB3LYP) : -920.34987886 a.u.
RMS Gradient : 0.00002511 a.u.
Point Group : D∞h
Cl-Cl Bond Length : 2.04174 Å
Bond Angle : 180.00 ° as this is a linear molecule
"Item" Table for Chlorine molecule from GaussView 5.0.9
The "Item" Table allows for the determination of the reliability of the optimisation. As all of the forces and displacements converged, we can assume that the optimisation was completed successfully by Gaussian 09W and that the molecule used for analysis is a suitable representation of the ground-state of molecule in question (Cl2 in this case).
         Item               Value     Threshold  Converged?
 Maximum Force            0.000043     0.000450     YES
 RMS     Force            0.000043     0.000300     YES
 Maximum Displacement     0.000121     0.001800     YES
 RMS     Displacement     0.000172     0.001200     YES
Interactive model of Chlorine molecule
Below is an interactive ball and stick model of the Chlorine molecule allowing you to visualise the molecule and also explore the symmetry exhibited by the molecule.
We can see that the molecule adopts a linear structure (predicted by Gaussian 09W). This fits with structures predicted by VSEPR for the Chlorine molecule.[1]
Chlorine Molecule |
Link to LOG file:File:EOPOKU CL2 OPTF POP.LOG
Vibrational Modes
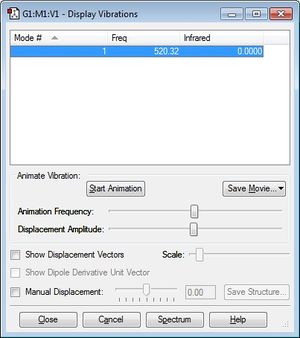
The frequency displayed corresponds to a bond stretch between atoms in the molecule, for which we only expect one as it is a linear diatomic molecule.
The molecule is not infrared-active as there is no change in dipole moment as the bond stretches.
Charge Distribution
It is expected that there will be an overall even charge distribution over the Cl2 molecule as it is a hetero-diatomic molecule and there are is no difference in electronegativity across the two atoms.
F2
General Information
General information about the F2 was obtained from analysis using GaussView 5.0.9 (with Gaussian 09W performing all the analysis). The relevant information is presented below:
Molecule : F2
Calculation Method : RB3LYP
Basic Set : 6-31G(d,p)
Final Energy E(RB3LYP) : -199.49825218 a.u.
RMS Gradient : 0.00007365 a.u.
Point Group : D∞h
F-F Bond Length : 1.40281 Å
Bond Angle : 180.00 ° as this is a linear molecule
"Item" Table for Chlorine molecule from GaussView 5.0.9
The "Item" Table allows for the determination of the reliability of the optimisation. As all of the forces and displacements converged, we can assume that the optimisation was completed successfully by Gaussian 09W and that the molecule used for analysis is a suitable representation of the ground-state of molecule in question (F2 in this case).
         Item               Value     Threshold  Converged?
 Maximum Force            0.000128     0.000450     YES
 RMS     Force            0.000128     0.000300     YES
 Maximum Displacement     0.000156     0.001800     YES
 RMS     Displacement     0.000221     0.001200     YES
Interactive model of Fluorine molecule
Below is an interactive ball and stick model of the Fluorine molecule allowing you to visualise the molecule and also explore the symmetry exhibited by the molecule.
We can see that the molecule adopts a linear structure (predicted by Gaussian 09W). This fits with structures predicted by VSEPR for the Fluorine molecule.[1]
Fluorine Molecule |
Link to LOG file:File:EOPOKU F2 OPTF POP.LOG
Vibrational Modes
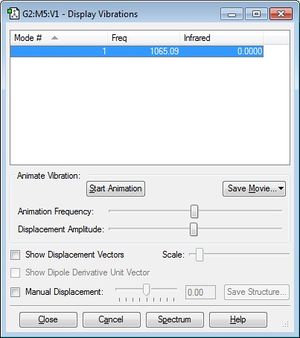
The frequency displayed corresponds to a bond stretch between atoms in the molecule, for which we only expect one as it is a linear diatomic molecule.
The molecule is not infrared-active as there is no change in dipole moment as the bond stretches.
Charge Distribution
It is expected that there will be an overall even charge distribution over the F2 molecule as it is a hetero-diatomic molecule and there are is no difference in electronegativity across the two atoms.
ClF
ClF is formed from F2 and Cl2, and has properties similar to the elements it is made of. It is therefore expected to be quite a reactive compound.
General Information
General information about the ClF was obtained from analysis using GaussView 5.0.9 (with Gaussian 09W performing all the analysis). The relevant information is presented below:
Molecule : ClF
Calculation Method : RB3LYP
Basic Set : 6-31G(d,p)
Final Energy E(RB3LYP) : -559.94269578 a.u.
RMS Gradient : 0.00014211 a.u.
Point Group : C∞v
F-Cl Bond Length : 1.66434 Å
Bond Angle : 180.00 ° as this is a linear molecule
"Item" Table for Chlorine Monofluoride molecule from GaussView 5.0.9
The "Item" Table allows for the determination of the reliability of the optimisation. As all of the forces and displacements converged, we can assume that the optimisation was completed successfully by Gaussian 09W and that the molecule used for analysis is a suitable representation of the ground-state of molecule in question (ClF in this case).
         Item               Value     Threshold  Converged?
 Maximum Force            0.000246     0.000450     YES
 RMS     Force            0.000246     0.000300     YES
 Maximum Displacement     0.000433     0.001800     YES
 RMS     Displacement     0.000613     0.001200     YES
Interactive model of Chlorine monofluoride molecule
Below is an interactive ball and stick model of the Chlorine monofluoride molecule allowing you to visualise the molecule and also explore the symmetry exhibited by the molecule. The structure fits with structures predicted by VSEPR for the ClF molecule.[1]
(The Flourine atom is the smaller, lighter green ball)
Chlorine monofluoride Molecule |
Link to LOG file:File:EOPOKU CLF OPTF POP.LOG
Vibrational Modes
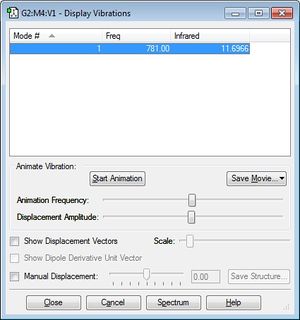
One band is expected from an experimental spectrum of the Chlorine monofluoride molecule. From the image below we can see that the molecule is infrared active and this is due to the fact that there is a change in dipole moment when the bond stretches.
Charge Distribution
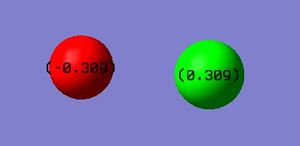
It is expected for the Flourine atom (red) to be negatively charged as it is the most electronegative atom in the molecule and will attract the bonding electrons towards it more than the Chlorine atom (green) would, making the Chlorine atoms carry a slightly positive charge. The charge distribution on the Fluorine atom is -0.39 and it is 0.39 on the Chlorine.
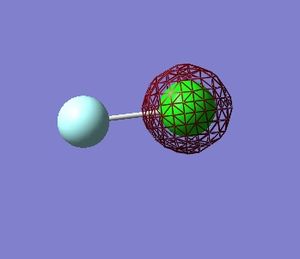
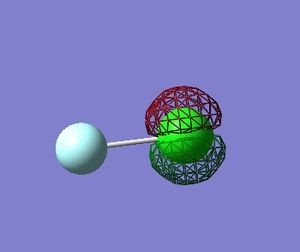
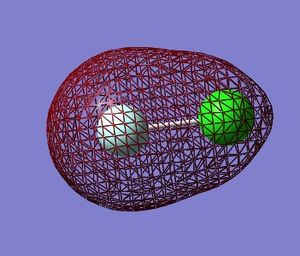
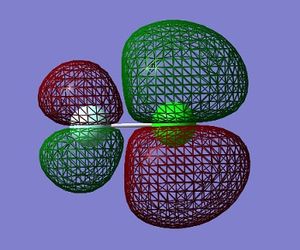
Molecular Orbitals in ClF
Using Gaussian 09W to calculate the combination of atomic orbitals(AOs) that produce the molecular orbitals(MOs) present in the ClF molecule.
The electronic configuration for the Cl atom is 1s2,2s2,2p6,3s2,3p5 and 1s2,2s2,2p5 for the Fluorine atom.
The table below shows 5 MOs in the molecule (13 filled MOs in total) visualised by GaussView 5.0.9.

