Em1815 Yr2 M R D
Molecular Reaction Dynamics: Applications to Triatomic systems
EXERCISE 1: H + H2 system
Question 1. What value does the total gradient of the potential energy surface have at a minimum and at a transition structure? Briefly explain how minima and transition structures can be distinguished using the curvature of the potential energy surface?
The total gradient of the potential energy surfaces at the minimum and transition structure is equal to zero. These point represent stationary points on the potential energy curve. Visually, the transition is seen to be a minima in one plane but a maximum in one plane, also known as a saddle point. Mathematically these points can be distinguished by using the differential operation once to find the coordinates of the minima and transition structure and twice to find if the position is a minimum or transition structure.
(how would you use the results of the differential to decide which is which?Lt912 (talk) 08:28, 9 June 2017 (BST))
Question 2. Report your best estimate of the transition state position (rts) and explain your reasoning illustrating it with a “Internuclear Distances vs Time” screenshot for a relevant trajectory.
The transition state position was found to be 0.908 Angstroms. By comparing the two Internuclear distance vs time plots, it can be seen that from the Original plot on the left, there is an interception point in internuclear distance reached by molecules B-C and A-B. This interception corresponds to the transition state position. From trial and error, the transition state position was found and inputted and the momentum of each coordinate was set to 0. From interpreting the second graph, it can be seen that position of each atom does not move as it is stationary on a 0 gradient ridge. As the gradient is 0, the process cannot proceed in any direction without any applied force.
Internuclear distance vs. time 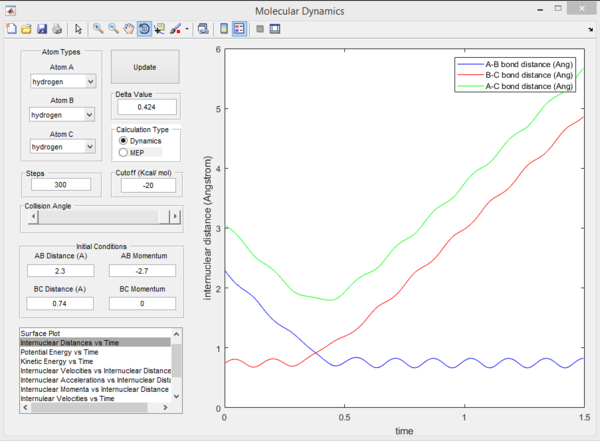 |
Internuclear distance vs. time at the transition state 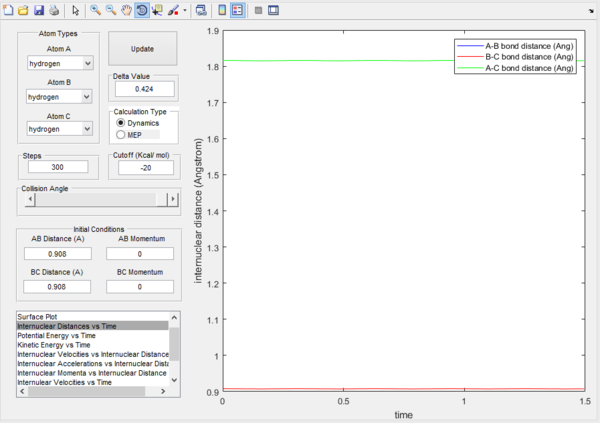 |
Question 3. Comment on how the mep and the trajectory you just calculated differ.
With a mep trajectory the velocity always reset to zero in each time step, and so it follows the lowest energy path. The dynamic trajectory doesn't prove the realistic translational and vibrational motion. By comparing the plots, it can be seen that the mep trajectory follows the ground vibrational path.
Also by evaluating the kinetic energy plots, it can be seen for the mep plot, the kinetic energy remains as 0, this is because of the 0 velocity of the molecules after calculations. Compared to the dynamic plot, the kinetic energy reaches a maximum and oscillates. This oscillation represents a conversion of translational energy to vibrational energy.
For the plots below r1 = rts+δ and r2 = rts
Mep surface plot 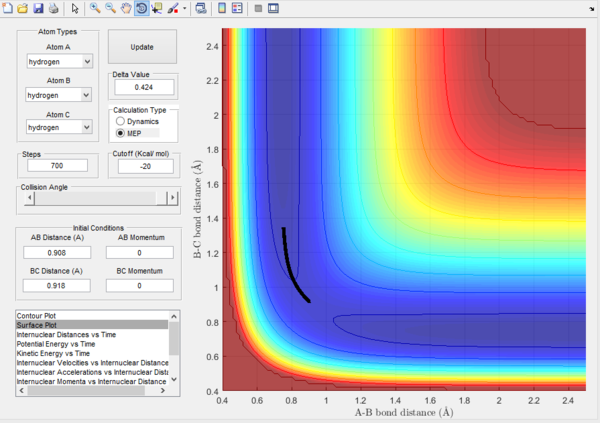 |
Dynamic surface plot 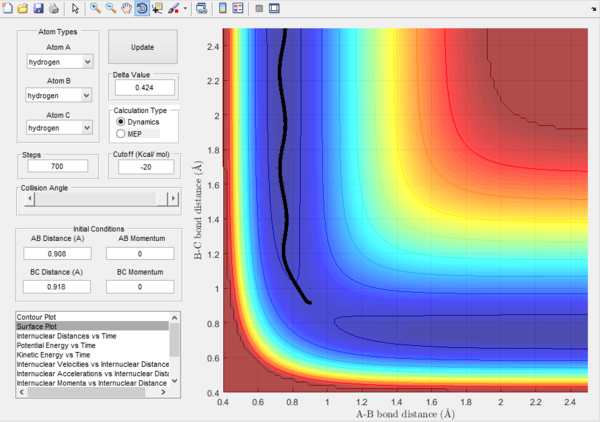 |
Mep kinetic energy vs. time plot 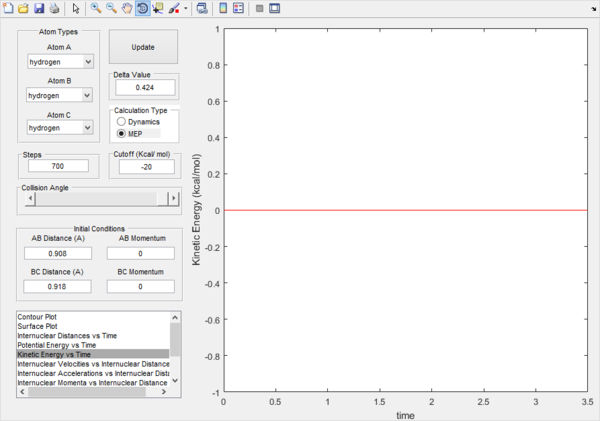 |
Dynamic kinetic energy plot 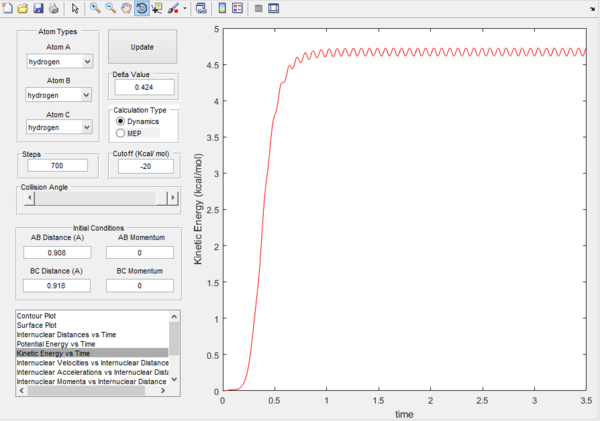 |
Question 4.Complete the table by adding a column reporting if the trajectory is reactive or unreactive. For each set of initial conditions, provide a screenshot of the trajectory and a small description for what happens along the trajectory.
| Reaction pathway | p1 | p2 | Trajectory reactive or unreactive |
|---|---|---|---|
| 1. | -1.25 | -2.5 | Reactive |
| 2. | -1.5 | -2.0 | Unreactive |
| 3. | -1.5 | -2.5 | Reactive |
| 4. | -2.5 | -5.0 | Unreactive |
| 5. | -2.5 | -5.2 | Reactive |
Trajectory 1.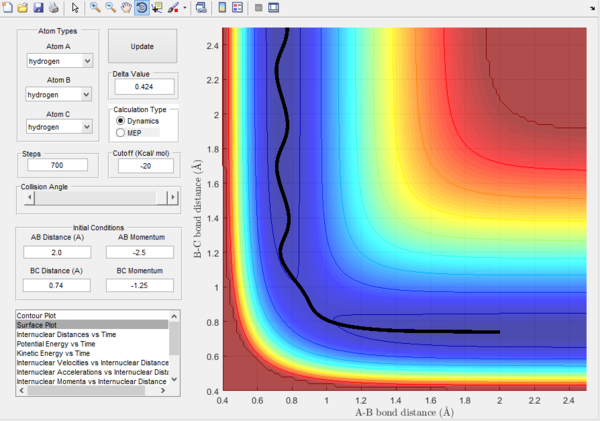 |
Trajectory 2.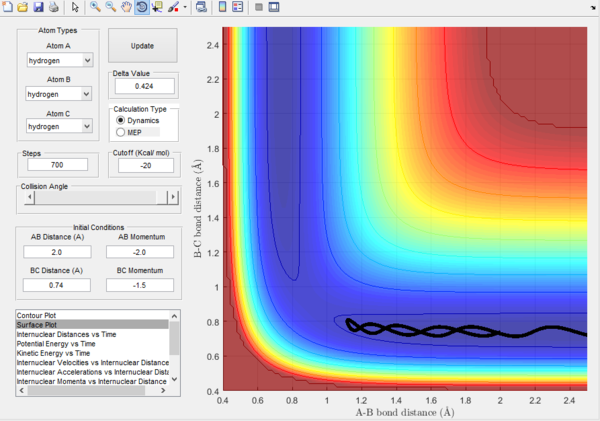 |
Trajectory 3.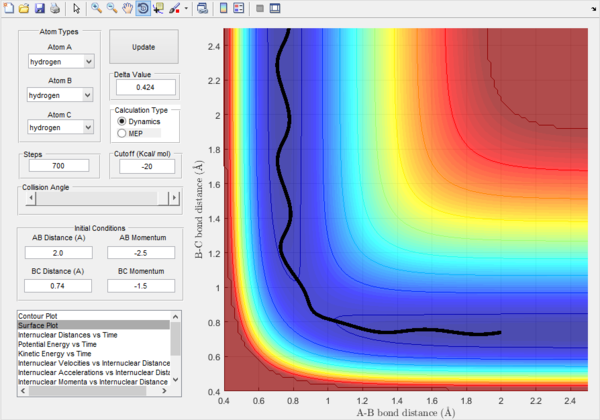 |
Trajectory 4.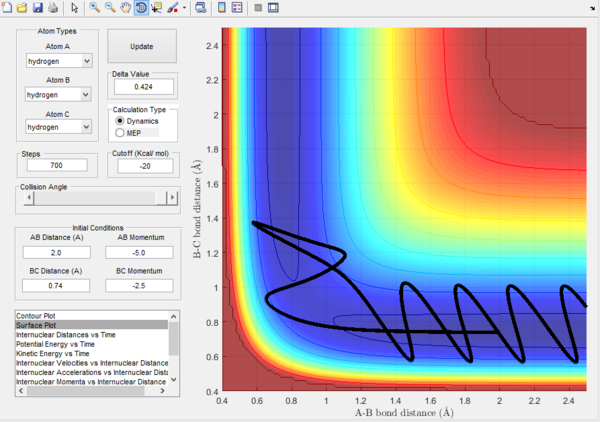 |
Trajectory 5.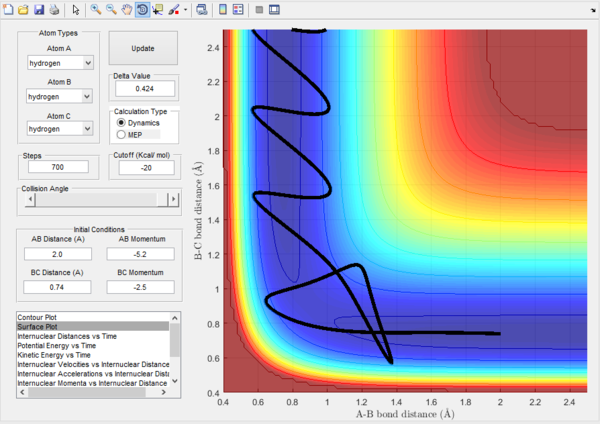 |
Trajectory 1.- It can be seen from this plot, that the reaction is successful as it shows the pathway starting in the reactant position and finishing in the products position, hence crossing the transition state threshold. It can be seen that there isn't much vibrational energy as the oscillations are small.
Trajectory 2.- It can be seen from this plot, there is less energy provided to complete the reaction and so the pathway starts in the reactants and finishes in the reactants position. It can be seen in the reaction pathway, that atom A heads towards B-C and this causes the B-C bond to vibrate but not to break. This can be seen by the oscillations in the plot. The energy is inadequate to reach the transition state and so the pathway returns to the initial state.
Trajectory 3.-From the plot, the energy of atom A is suffiecient to break the B-C bond. There is more translation energy of B-C compared to Trajectory 1. The increase in translational energy enables the reactants to overcome the transition state. This again occurs with minimal vibration.
Trajectory 4.- In this plot, the energies of all atoms have increased. There is too much vibrational and translational energy in B-C such that it doesn't allow A to react. The reaction scheme crosses the transition boundary to form the products however it quickly reverts and dissociates to the reactants due to excess vibrational energy. It can be seen that atom A return to its initial position without oscillation, dissipating most of its energy in the collision.
Trajectory 5.-The translational energy of atom A is increased compared to trajectory 4. The pathway passes throuhgh the trasition state, returns to the reactant position however atom A has enough energy to then react with B-C to return to the product position.
Question 5.State what are the main assumptions of Transition State Theory. Given the results you have obtained, how will Transition State Theory predictions for reaction rate values compare with experimental values?
The main assumptions of transition state theory are that during a reaction, the reactants and transition state are in an equilibrium with each other, however not with the product. If the product is formed the reaction cannot revert and return to the reactants. This assumes that the atoms behave under classic mechanics and ignores quantum mechanics. It also assumes the reaction pathway will follow the lowest energy saddle point of the energy surface ignoring distributions of energies and that molecules populate higher vibrational modes.
The transition state theory predicted rates will be faster than experimental values. This is because transition state theory doesn't take into account that excess energy in a reaction does not always mean a successful reaction. Reaction success is dependent on several factors such as molecule orientation, vibrational energy of the molecule. This theory states that once reaching the products you cannot return to the reactants and so this has been shown to be untrue. (you should relate this back to you calcultions Lt912 (talk) 08:30, 9 June 2017 (BST))
EXERCISE 2: F - H - H system
Question 6.Classify the F + H2 and H + HF reactions according to their energetics (endothermic or exothermic). How does this relate to the bond strength of the chemical species involved?
The H2 + F reaction is an exothermic reaction. This is because the bond strength of the product H-F is greater than H2 and so energy is released when this new lower energy bond is formed. More energy is released than the energy to cleave the H2 bond. This therefore means that the reverse H + H-F reaction will be an endothermic reaction. Energy needs to put into the system to break the H-F bond, the energy released to form the H2 bond is lower than the cleavage of the H-F bond.
Question 7.Locate the approximate position of the transition state.
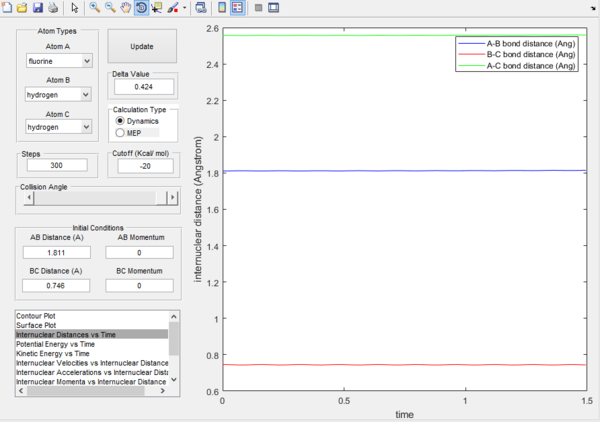
Location of transition state r1 = H-H = 0.746, r2 = H-F = 1.811. It can be seen that as we have started on a ridge, and so the molecules oscillate but never fall off.
Question 8.Report the activation energy for both reactions.
Activation energy = -103.3 Kcal/mol
H-F minimum potential energy = -134 Kcal/mol
H-H minumum potential energy = -103.8 Kcal/mol
H2 + F activation energy is 0.5 Kcal/mol H-F + H activation energy 30.7 Kcal/mol.
Transition state.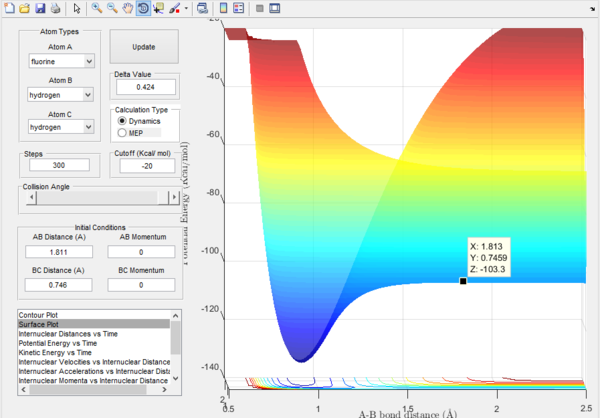 |
Potential energy of H-F.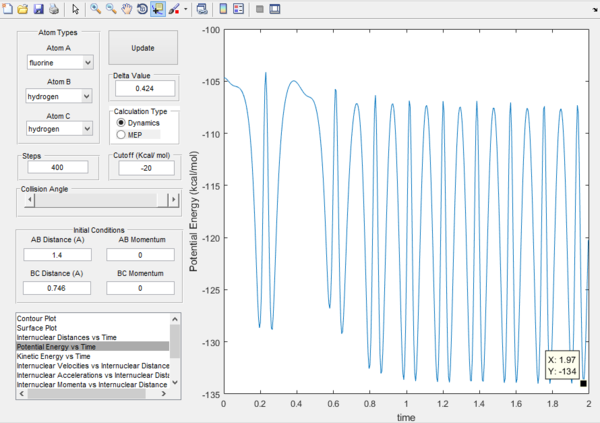 |
Potential energy of H-H.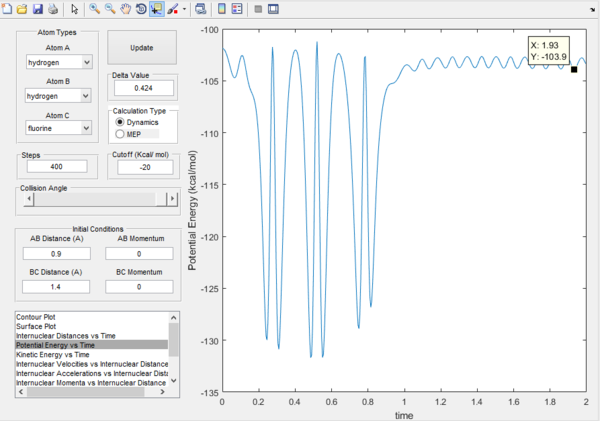 |
