EX3 Section lp1916
BH3
Optimisation using 6-31G
• Method used: RB3LYP
• Basis set used: 6-31G
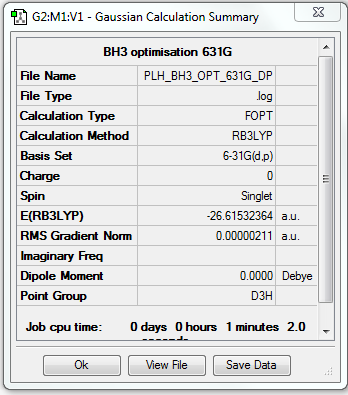
• Screen shot of a summary table:
• E(BH3) = -26.61532364 a.u.
• Item table:
         Item               Value     Threshold  Converged?
 Maximum Force            0.000004     0.000450     YES
 RMS     Force            0.000003     0.000300     YES
 Maximum Displacement     0.000017     0.001800     YES
 RMS     Displacement     0.000011     0.001200     YES
• Link to frequency.log file:
• Low frequencies:
 Low frequencies ---   -1.1800   -1.0028   -0.0054    4.1927   11.0182   11.0637
 Low frequencies --- 1162.9912 1213.1792 1213.1819
• Jmol dynamic image of BH3
BH3 |
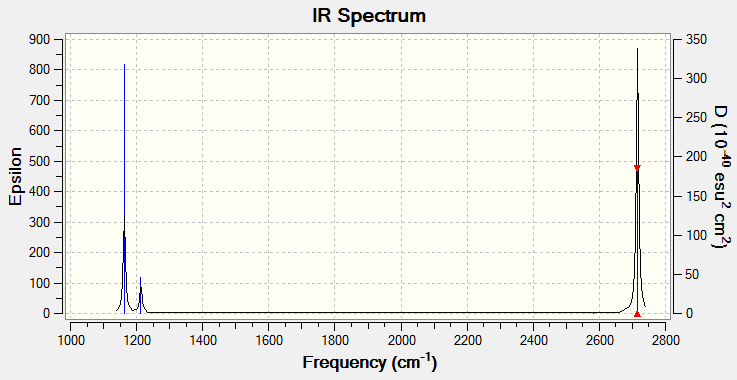
Vibrational spectrum for BH3
| wavenumber (cm-1) | Intensity (arbitrary units) | symmetry | IR active? | type |
| 1163 | 93 | A1 | yes | out-of-plane bend |
| 1213 | 14 | E | very slight | bend |
| 1213 | 14 | E | very slight | bend |
| 2582 | 0 | A1 | no | symmetric stretch |
| 2715 | 126 | E | yes | asymmetric stretch |
| 2715 | 126 | E | yes | asymmetric stretch |
• Reasons for fewer vibrational peaks:
There are six vibration modes which agrees with the 3N-6 rule, however there are only three peaks visible in the IR spectrum. Fisrt of all, some of the vibration frequencies are not IR active. For example, the symmetric stretch of BH3 molecule would not result in a change in dipole moment and is therefore not IR active. Secondly, some vibrational patterns have the same frequencies and the signals therefore coincide to give a greater peak. e.g. the last two frequencies in the above table are the same.
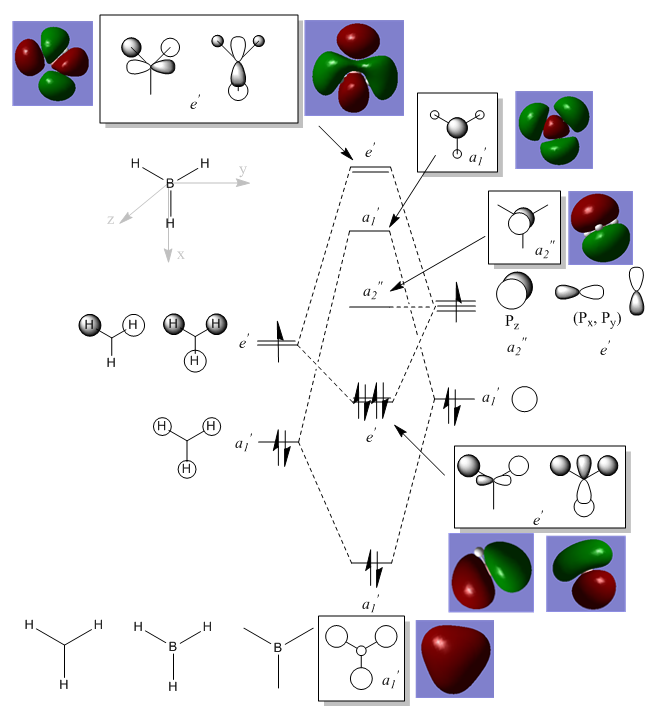
MO diagram for BH3
There are not any significant differences between the real and LCAO MOs. This means that the qualitative MO theory is extremely accurate as well as useful
Dissociation Energy Calculation
Optimisation of NH3
• Method used: RB3LYP
• Basis set used: 6-31G
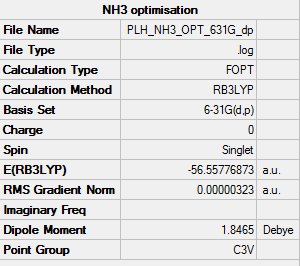
• Screen shot of a summary table:
• E(NH3) = -56.55776873 a.u.
Optimisation of NH3BH3
• Method used: RB3LYP
• Basis set used: 6-31G
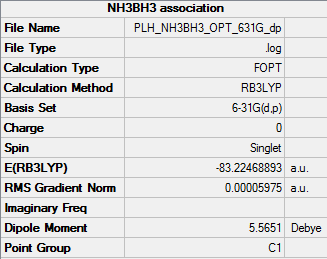
• Screen shot of a summary table:
• E(NH3BH3) = -83.22468893 a.u.
Association Energy
• ΔE = E(NH3BH3) - [E(NH3)+E(BH3)]
= -83.22468893 a.u. - (-56.55776873 a.u. - -26.61532364 a.u.)
= -0.05159656 a.u.
= -135 kJ/mol
Dissociation Energy
• Is therefore - Association Energy = 135 kJ/mol
Ng611 (talk) 20:26, 15 May 2018 (BST) Correct answer but you need to compare to other bonds to assess the overall strength.
BBr3
Optimisation of BBr3
• Method used: RB3LYP
• Basis set used: GEN
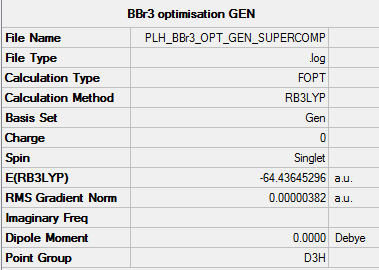
• Screen shot of a summary table:
• Item table:
         Item               Value     Threshold  Converged?
 Maximum Force            0.000008     0.000450     YES
 RMS     Force            0.000005     0.000300     YES
 Maximum Displacement     0.000036     0.001800     YES
 RMS     Displacement     0.000023     0.001200     YES
Frequency Analysis
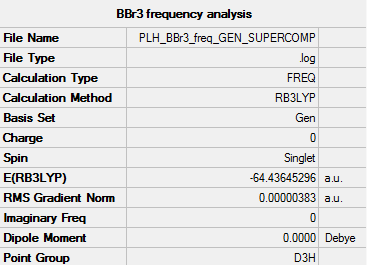
• Summary table
• Item table
         Item               Value     Threshold  Converged?
 Maximum Force            0.000008     0.000450     YES
 RMS     Force            0.000004     0.000300     YES
 Maximum Displacement     0.000036     0.001800     YES
 RMS     Displacement     0.000018     0.001200     YES
• Low frequencies
 Low frequencies ---   -0.0137   -0.0064   -0.0046    2.4315    2.4315    4.8421
 Low frequencies ---  155.9631  155.9651  267.7052
• Link to frequency file DOI:10042/202333
Project on Benzene and Borazine
Benzene
Optimisation
• Method used: RB3LYP
• Basis set used: 6-31G
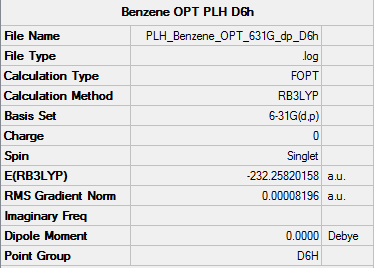
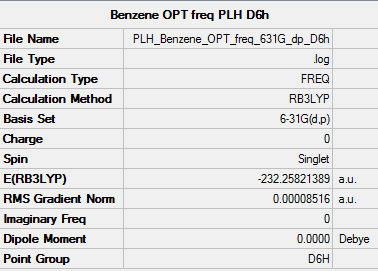
• Screen shot of a summary table:
• E(Benzene) = -232.25820158 a.u.
• Item table:
         Item               Value     Threshold  Converged?
 Maximum Force            0.000198     0.000450     YES
 RMS     Force            0.000082     0.000300     YES
 Maximum Displacement     0.000849     0.001800     YES
 RMS     Displacement     0.000305     0.001200     YES
Frequency analysis
• Method used: RB3LYP
• Basis set used: 6-31G
- with Full NBO to conduct charge analysis and to compute MOs
• Screen shot of a summary table:
• Item table:
         Item               Value     Threshold  Converged?
 Maximum Force            0.000197     0.000450     YES
 RMS     Force            0.000085     0.000300     YES
 Maximum Displacement     0.000780     0.001800     YES
 RMS     Displacement     0.000333     0.001200     YES
• Low frequencies
 Low frequencies ---   -3.5606   -3.5606   -0.0088   -0.0042   -0.0041   10.0905
 Low frequencies ---  413.9582  413.9582  621.1416
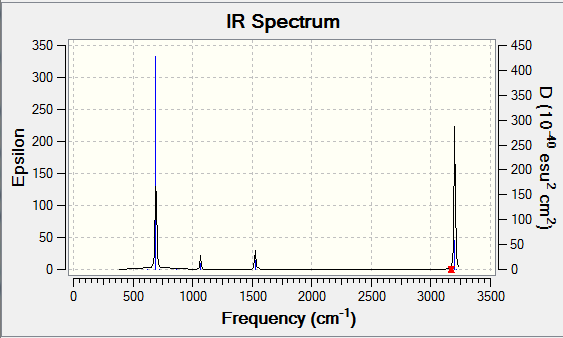
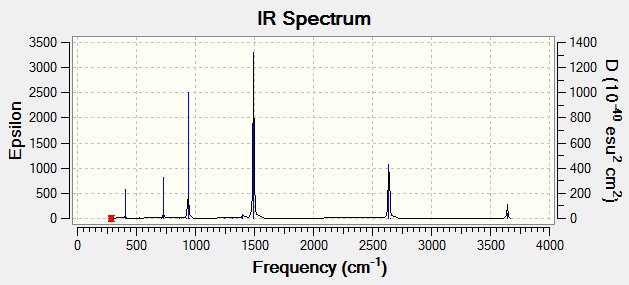
• IR spectrum --- no negative frequencies
• Jmol dynamic image of Benzene
Benzene |
• Link to log file
PLH BENZENE OPT FREQ 631G DP D6H.LOG
Borazine
Optimisation
• Method used: RB3LYP
• Basis set used: 6-31G
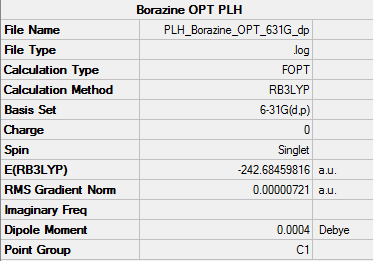
• Screen shot of a summary table:
• E(Benzene) = -242.68459816 a.u.
• Item table:
         Item               Value     Threshold  Converged?
 Maximum Force            0.000015     0.000450     YES
 RMS     Force            0.000006     0.000300     YES
 Maximum Displacement     0.000141     0.001800     YES
 RMS     Displacement     0.000051     0.001200     YES
Frequency analysis
• Method used: RB3LYP
• Basis set used: 6-31G
- with Full NBO to conduct charge analysis and to compute MOs
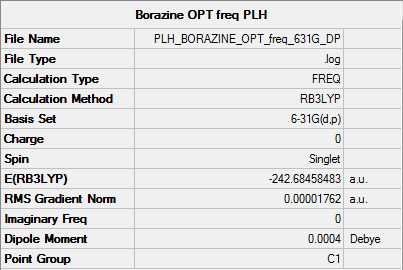
• Screen shot of a summary table:
• Item table:
         Item               Value     Threshold  Converged?
 Maximum Force            0.000054     0.000450     YES
 RMS     Force            0.000018     0.000300     YES
 Maximum Displacement     0.000389     0.001800     YES
 RMS     Displacement     0.000169     0.001200     YES
• Low frequencies
 Low frequencies ---  -18.0278  -16.9448   -5.8492   -0.0010   -0.0009    0.0006
 Low frequencies ---  289.0655  289.4428  404.3163
• IR spectrum --- no negative frequencies
• Jmol dynamic image of Borazine
Borazine |
• Link to log file
PLH BORAZINE OPT FREQ 631G DP.LOG
Charge analysis
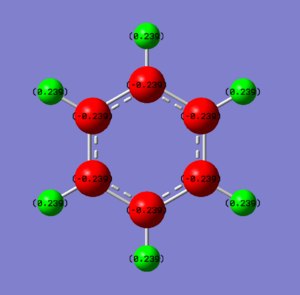
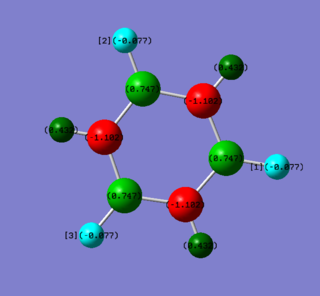
• Charge diagrams of Benzene (left) and Borazine (right)
• Charge analysis benzene
| Benzene | Electronegativity | Charge / a.u. |
| C | 2.5 | -0.239 |
| H | 2.1 | +0.239 |
• Charge analysis borazine
| Borazine | Electronegativity | Charge / a.u. |
| N | 3.0 | -1.102 |
| B | 2.0 | +0.747 |
| H-N | 2.1 | +0.432 |
| H-B | 2.1 | -0.077 |
• Interpretation
The charge density is evenly distributed among benzene molecule with hydrogen atoms having charge of +0.239 a.u. while carbon atoms having charge of -0.239 a.u. This uneven distribution of charge between carbon and hydrogen is caused by their electronegativity difference which equals 2.5 - 2.1 = 0.4. As carbon is more electronegative than hydrogen, it attracts electron density towards it and thereby resulting in a slight negative charge on carbon and positive charge on hydrogen.
However for borazine, the situation is much more complicated. the electronegativity of boron is the lowest and the electron density is therefore dragged away from it resulting in a charge value of +0.747 a.u. The electronegativity of nitrogen, being 3.0, is the most powerful electron withdrawing group and drags the electron density away from both hydrogen and boron, giving an extremely high negative charge on nitrogen. For hydrogen, however, it is slightly more electronegative than boron and hydrogen atoms connecting with boron atoms therefore carry tiny negative charges.
The values of relative charges are determined by the values of electronegativity difference Ng611 (talk) 20:43, 15 May 2018 (BST) What about symmetry and what is the sum of the partial charges?
Investigation of MOs
Aromaticity
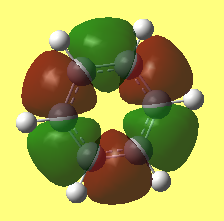
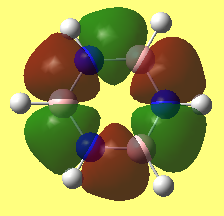
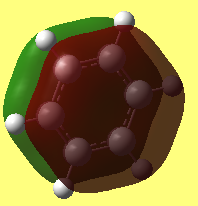
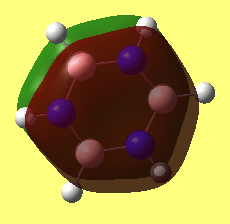
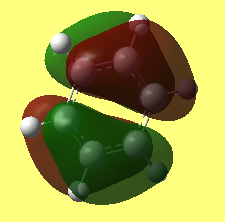
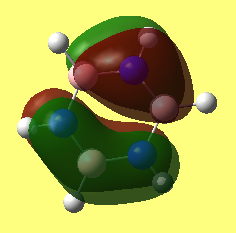
Aromaticity describes a planar, cyclic molecule with a ring of resonance bonds that satisfies Huckle's law and are highly stable due to the partial bond characteristics (more stable than any arrangements with same sets of atoms). The bonding within an aromatic compound has been assumed to be the delocalisation of pi electrons. From MO point of view, however, the strong bonding within aromatic compounds can be seen as the the overlaping of Pz orbitals. As shown in the benzene and borazene MOs above, the atomic orbitals of the same symmetry and close energy would mix to give MOs with stabilised energy and this leads to the stabilization of the molecule.
The overlapping of Pz orbitals can be used in benzene but not aromatic molecules with heteroatoms on. The Pz of heteroatoms may not have similar energy and would cause distortion of the atom. Therefore more orbital interactions and symmetry need to be considered in addition to the overlapping of perpendicular aligned Pz orbitals.
Ng611 (talk) 20:42, 15 May 2018 (BST) What you've written is correct but I think you need more detail in this discussion. How has the picture of aromaticity changed? What experimental techniques can we use? How do we account for aromaticity in non-planar molecules?
Ng611 (talk) 20:42, 15 May 2018 (BST) Some good aspects to this report, but you lost marks because you missed out on key information (log files etc.). Your explanations and rationalisations were correct but needed a little bit more detail.

