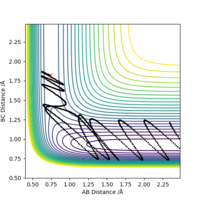
Domimi
EXERCISE 1: H + H2 system
1. On a potential energy surface diagram, how is the transition state mathematically defined? How can the transition state be identified, and how can it be distinguished from a local minimum of the potential energy surface?
On the potential energy surface diagram, the transition point is at the saddle point, where the derivatives are zero. Therefore, it is mathematically defined as: ∂V(ri)/∂ri=0 and H < 0, where H = Vr1r1(r10r20)Vr2r2(r10r20) - V2r1r2(r10r20), which is the determinant of the second partial derivative at the saddle point.
The transition state is defined as the maximum on the minimum energy path linking reactants and the products. So it can be identified by finding the maximum point on the minimum energy path.
It can be distinguished from a local minimum of the potential energy surface by comparing the second partial derivative determinant as the local minimum will have H > 0.
Slightly difficult to follow this part, remember that the second derivative of E wrt distance is +ve in a given direction whilst the orthogonal direction it will be negative. With your first partial derivative you could have explained this aswell, so rather than sayin 'derivatives' be specific, first/second...third?? Address what you would expect for a local minimum/ a maximum...would they have a value greater than or less than zero. Mys18 (talk) 23:45, 8 June 2019 (BST)
2. Report your best estimate of the transition state position (rts) and explain your reasoning illustrating it with a “Internuclear Distances vs Time” plot for a relevant trajectory.
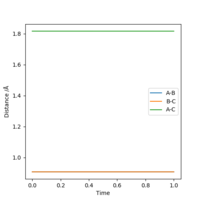
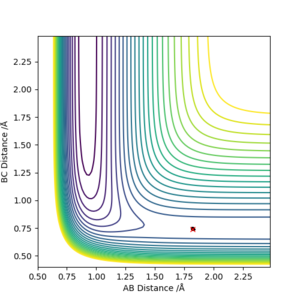
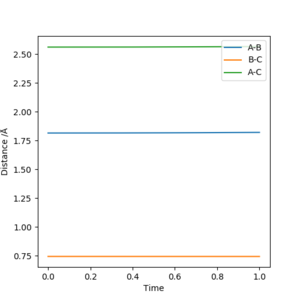
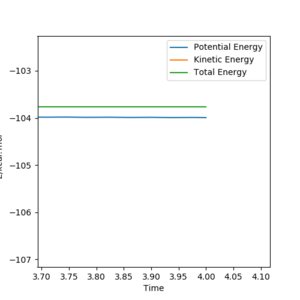
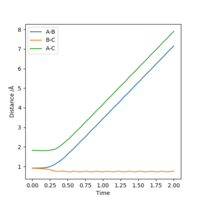
Starting with r(AB) = r(BC) = 0.74 Å, p1 = p2 = 0.0, after varying the internuclear distance, the transition state was observed where the internuclear distance equal to 0.9078 Å. At this distance, no oscillation is observed on the plot shown in Figure.1.
Good. Mys18 (talk) 23:52, 8 June 2019 (BST)
3. Comment on how the mep and the trajectory you just calculated differ.
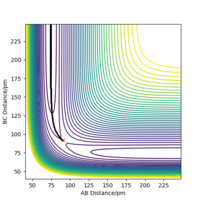
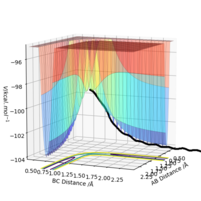
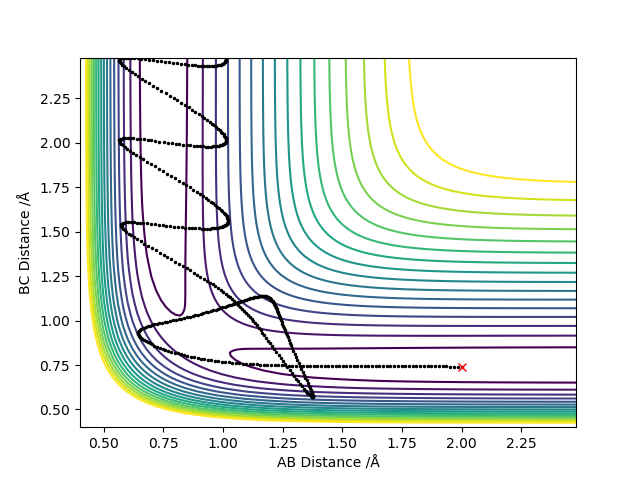
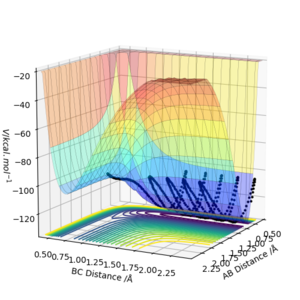
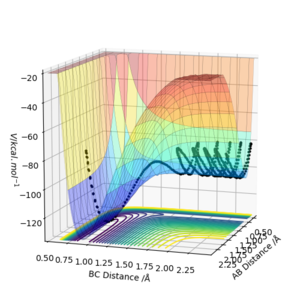
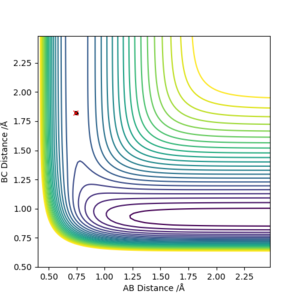
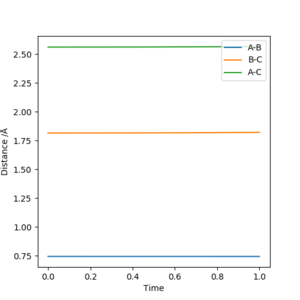
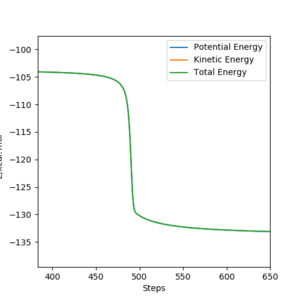
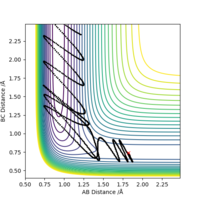
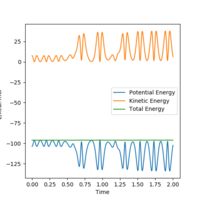
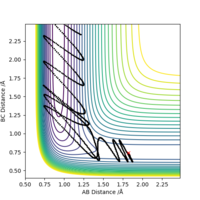
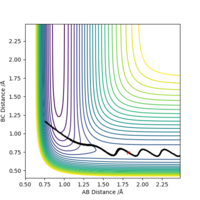
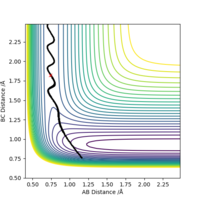
As shown in Figure.2 and Figure.3, the mep trajectory is smooth and dynamic one is wavy. The potential energy of mep trajectory keeps at the minimum and does not show any oscillation, whereas the dynamic trajectory shows oscillation. This is because mep is the minimum energy path where the momenta are always reset to zero in each time step which corresponds to infinitely slow motion of species.
Correct, visually the difference is very clear. For the MEP calculation, if the momenta is always reset to zero, what can you say about the kinetic energy? It might have been worth using your Fig. 4 and the MEP equivalent of that plot for this answer. . Mys18 (talk) 23:56, 8 June 2019 (BST)
4. Setup a calculation where the initial positions correspond to the final positions of the trajectory you calculated above, the same final momenta values but with their signs reversed.What do you observe?
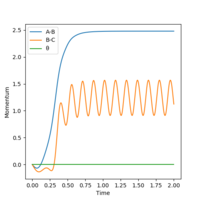
What did you observe? Mys18 (talk) 00:00, 9 June 2019 (BST)
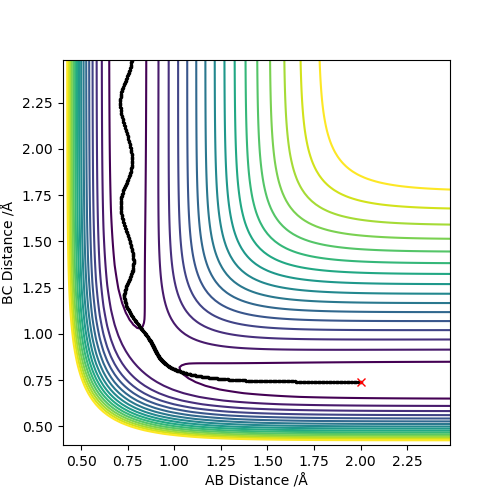
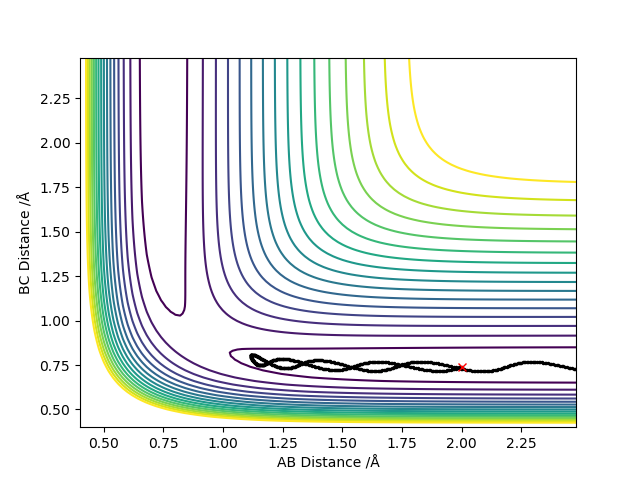
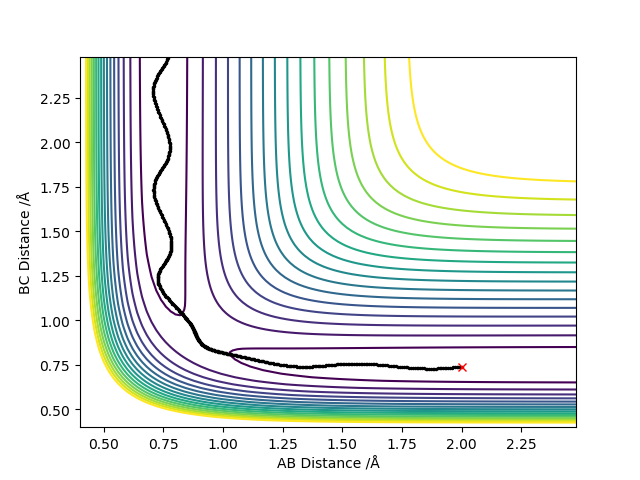
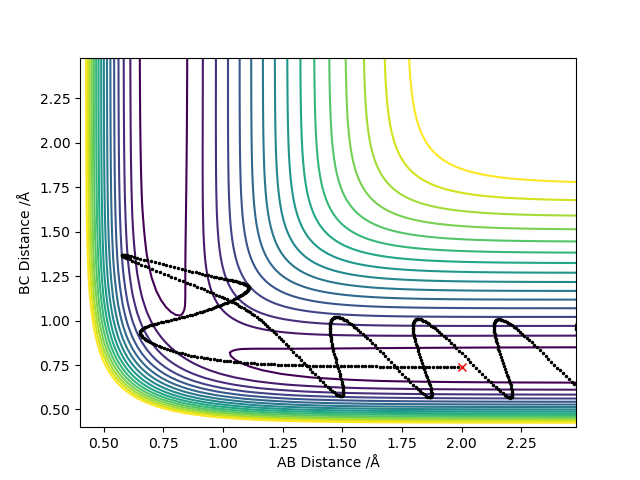
5. Complete the table above by adding the total energy, whether the trajectory is reactive or unreactive, and provide a plot of the trajectory and a small description for what happens along the trajectory. What can you conclude from the table?
A higher momenta of the species does not always produce reactive trajectory.
When the initial momenta is too high, reactants pass through products then fall back towards reactants. Because it has enough energy to reach transition state, it would reform products in the end.
6. State what are the main assumptions of Transition State Theory1. Given the results you have obtained, how will Transition State Theory predictions for reaction rate values compare with experimental values?
- Reactants are in constant equilibrium with the transition state structure.
- The energy of the particles follow a Boltzmann distribution.
- Once reactants become the transition state, the transition state structure does not collapse back to the reactants.
Trial 1,2 and 3 follow the transition state theory as either the reactants have enough energy to turn into products or do not have enough energy to overcome energy barrier where they reach transition state and fall back towards reactants.
Trail 4 and 5 do not match the prediction as reactants pass through products and fall back towards reactants.
Your reactivity answers are correct and explanations do help justify this. However, it would be worth mentioning the vibrational motions of the molecules. With your second reaction, yes there is insufficient energy, but how do you know the TS was reached and then, is it not true that it was unable to reach the TS in the first place because it had insufficient energy? Both reactions 2 and 5, your explanations are identical... it is not as simple as this for the fourth reaction at least... It might be worth reading your assumptions and conclusions at the end, fully understanding it then going back to explain this point...Conclusion is fine, but go back and mention momenta in your explanations, more specific detail and terminology would be preferred. (the 'falling back' to go to reactants is call recrossing) Mys18 (talk) 00:09, 9 June 2019 (BST)
EXERCISE 2: F - H - H system
1. By inspecting the potential energy surfaces, classify the F + H2 and H + HF reactions according to their energetics (endothermic or exothermic). How does this relate to the bond strength of the chemical species involved?
You could even have a look on literature to see the bond energies for H-H and H-F and use this to compare your findings with. Mys18 (talk) 00:18, 9 June 2019 (BST)
2.Locate the approximate position of the transition state.
The transition state is where no reaction trajectory is observed and lines on internuclear distance vs time plot are all linear.
3.Report the activation energy for both reactions.
The activation energy of the two systems are found by varying the distance slightly from the distance for transition state on the plot energy vs time. The activation energy is the energy difference between the reactant and product.
Excellent units. Mys18 (talk) 00:20, 9 June 2019 (BST)
4.In light of the fact that energy is conserved, discuss the mechanism of release of the reaction energy. Explain how this could be confirmed experimentally.
Okay, but the figure you have included shows significant presence of vibration motion, what spectroscopy technique could measure this? What would we be looking at specifically to detect what bond? Mys18 (talk) 00:23, 9 June 2019 (BST)
5.Discuss how the distribution of energy between different modes (translation and vibration) affect the efficiency of the reaction, and how this is influenced by the position of the transition state.
p(AB) and p(BC) for system F+H2 are translational energy and vibrational energy respectively. As shown in table above, for this exothermic reaction, translational energy outweighing vibrational energy give a reactive trajectory, this is result from the fact that exothermic reaction has an early transition state.
However, p(AB) and p(BC) for system H+HF are opposite. In this system, translational energy outweighing vibrational energy does not give a reactive trajectory, this is result from the fact that a late transition state is involved in endothermic reaction.
The results agree with 2Polanyi's rules.
Good, but what exactly is Polanyi's rule?. Mys18 (talk) 00:26, 9 June 2019 (BST)
References
1.Atkins, P., de Paula, J., Elements of Physical Chemistry, 5th ed.; Oxford University Press, 2009.
2. Guo, H., & Liu, K. (2016). Control of chemical reactivity by transition-state and beyond. Chemical Science. https://doi.org/10.1039/c6sc01066k

