
Deep-fried Bacon Double Cheese Quarter Pounder
Matthew Wilfred Ho
Module 2
Bonding (Ab initio and density functional molecular orbital)
Introduction
The use of computational methods in the prediction of chemical structure and reactivity is well established, despite its relatively late beginning as a field. Where decades ago a compound would have required much experimentation to elucidate its precise structure, with the increase in computing power available it is now possible for a chemist to work with an accurately enough prediction for actual chemistry, saving much time and man power; in the cases of transient species it may even be the only way forward.
In this exercise different methods in computational chemistry are compared, with special attention paid to the accuracy of results, and its tradeoff in computing resources and time consumed - as solving the wavefunctions of every individual electron in a system with an appreciable number of electrons is simply infeasible complicated. Different basis sets apply different approximations, simplifying the calculation but also introducing inaccuracies. The discerning computational chemist must know what methods to apply in what situations, and to do so requires an understanding not only of the molecules involved, but also what information is needed for the problem at hand.

For example, BH3 and TlBr3, two structurally similar compounds were investigated. Using the DFT/B3LYP method, the basis sets 3-21G and LANL2DZ were used on BH3 and TlBr3 respectively, illustrating the need to apply basis sets designed for their intended atoms. The ability of computational chemistry to predict structure, vibrational spectra and charge distribution was also showcased, with an emphasis on the chemists' involvement in determining whether a stationary point, or energy minima had been achieved, namely through energy plots and root mean square gradient plots of optimisation intermediates.
Additionally, the molecular orbitals of some complexes were calculated. The usefulness of computational methods in explaining the strength of bonds, and the stability and reactivity of compounds was also investigated.
BH3
Geometry Optimisation
Gaussview was used to create a molecule of BH3, with each B-H bond length custom set to 1.5 angstroms. Its structure was optimised with the B3LYP method and 3-21G set. Although the 3-21G basis set has a low accuracy, for the purposes of a simple molecule such as BH3 it is sufficiently accurate, and saves on computation time.

(DOI:10042/to-12924 )


        Item               Value     Threshold  Converged?
Maximum Force            0.000413     0.000450     YES
RMS     Force            0.000271     0.000300     YES
Maximum Displacement     0.001643     0.001800     YES
RMS     Displacement     0.001076     0.001200     YES
Predicted change in Energy=-1.018634D-06
Optimization completed.
   -- Stationary point found.
The above data entry indicates convergence has occurred by the final iteration of geometry optimisation, with the energy of the molecule having arrived at the stationary point of an energy minima.
----------------------------
                          !   Optimized Parameters   !
                          ! (Angstroms and Degrees)  !
--------------------------                            --------------------------
! Name  Definition              Value          Derivative Info.                !
--------------------------------------------------------------------------------
! R1    R(1,2)                  1.1935         -DE/DX =    0.0004              !
! R2    R(1,3)                  1.1935         -DE/DX =    0.0004              !
! R3    R(1,4)                  1.1935         -DE/DX =    0.0004              !
! A1    A(2,1,3)              120.0            -DE/DX =    0.0                 !
! A2    A(2,1,4)              120.0            -DE/DX =    0.0                 !
! A3    A(3,1,4)              120.0            -DE/DX =    0.0                 !
! D1    D(2,1,4,3)            180.0            -DE/DX =    0.0                 !
--------------------------------------------------------------------------------
Vibrational Analysis
The optimised structure of BH3 was submitted to Gaussian again for frequency calculations. The predicted IR spectrum is shown as below, with 6 vibrational modes described in particular:

(DOI:10042/to-12924 )
| No. | Vibrational mode | Animation | Symmetry | Frequency /cm-1 | Intensity | Description |
| 1 | Wagging (out of plane) |  |
A2" | 1152.77 | 92.2 | Also known as umbrella opening, hydrogen atoms move above the plane of the Boron atom, with the B atom itself being slightly displaced. |
| 2 | Scissoring (in plane) |  |
E' | 1209.64 | 13.3 | Two hydrogen atoms move within the plane of the Boron atom, resembling the closing and opening of a pair of scissors. |
| 3 | Rocking (in plane) |  |
E' | 1209.64 | 13.3 | Two hydrogen atoms rock in phase in the plane of the Boron atom, while the third rocks out of phase. |
| 4 | Stretching (symmetric) |  |
A1' | 2576.40 | 0.0 | All 3 B-H bonds extend and contract in phase, contributing zero dipole moment overall. |
| 5 | Stretching (asymmetric) |  |
E' | 2714.67 | 135.5 | Two B-H bonds extend and contract in phase, with the third bond oscillating out of phase. |
| 6 | Stretching (asymmetric) |  |
E' | 2714.67 | 135.5 | Two B-H bonds extend and contract out of phase, with the third bond length remaining constant. |
Although six vibrational modes are described, it must be noted that the symmetric stretching does not involve a dipole change; it therefore does not show up on the IR spectrum. Also, the 1209.64 and 2714.67 peaks are degenerate due to their E' symmetry, thus giving a total of three peaks, as shown in the predicted IR spectrum.
Low frequencies ---   -0.3353   -0.0330   -0.0046   28.9578   30.1869   30.1887
Low frequencies --- 1152.7703 1209.6409 1209.6432
The low frequencies indicate the extent of motion by the molecule about its center of mass. For a geometry optimisation to be valid, they should be lower than or close to the value of the lowest predicted vibrational frequency. The values shown do not indicate otherwise, and is thus another indication on top of the previously mentioned convergence checks etc. that optimisation had been performed successfully.
Molecular Orbitals
A molecular orbital diagram was constructed for BH3, which has a D3h point group. The LCAO orbitals are represented diagrammatically alongside the computed Molecular Orbitals obtained through the B3LYP method and 3-21G basis set. The computed MOs were found to be in good agreement with the LCAO orbitals predicted. Furthermore, the occupancy of the electronic energy levels along with the degeneracy were in good agreement, demonstrating the potential of Molecular Orbital calculations for more complex molecules.


(DOI:10042/to-12924 )
NBO Analysis
An NBO analysis was performed on the optimised BH3 molecule as well.In the digrams below, the numbers labelled on the atoms indicated their natural charge, while its colour on the adjacent diagram illustrates the charge distribution, on a spectrum with green indicating positive charge, and red indicating negative charge. The calculated values are in line with expectations of Boron being highly electron deficient in BH3. The data below obtained from the output file tabulates these values:

(DOI:10042/to-12924 )

Summary of Natural Population Analysis:

                                      Natural Population
               Natural  -----------------------------------------------
   Atom  No    Charge         Core      Valence    Rydberg      Total
-----------------------------------------------------------------------
     B    1    0.27816      1.99954     2.72230    0.00000     4.72184
     H    2   -0.09272      0.00000     1.09256    0.00015     1.09272
     H    3   -0.09272      0.00000     1.09256    0.00015     1.09272
     H    4   -0.09272      0.00000     1.09256    0.00015     1.09272
=======================================================================
  * Total *    0.00000      1.99954     6.00000    0.00046     8.00000
      (Occupancy)   Bond orbital/ Coefficients/ Hybrids
---------------------------------------------------------------------------------
    1. (1.99854) BD ( 1) B   1 - H   2
               ( 45.36%)   0.6735* B   1 s( 33.33%)p 2.00( 66.67%)
                                           0.0000  0.5774  0.0000  0.0000  0.0000
                                           0.8165  0.0000  0.0000  0.0000
               ( 54.64%)   0.7392* H   2 s(100.00%)
                                           1.0000  0.0001
    2. (1.99854) BD ( 1) B   1 - H   3
               ( 45.36%)   0.6735* B   1 s( 33.33%)p 2.00( 66.67%)
                                           0.0000  0.5774  0.0000  0.7071  0.0000
                                          -0.4082  0.0000  0.0000  0.0000
               ( 54.64%)   0.7392* H   3 s(100.00%)
                                           1.0000  0.0001
    3. (1.99854) BD ( 1) B   1 - H   4
               ( 45.36%)   0.6735* B   1 s( 33.33%)p 2.00( 66.67%)
                                           0.0000  0.5774  0.0000 -0.7071  0.0000
                                          -0.4082  0.0000  0.0000  0.0000
               ( 54.64%)   0.7392* H   4 s(100.00%)
                                           1.0000  0.0001
    4. (1.99954) CR ( 1) B   1           s(100.00%)
                                           1.0000  0.0000  0.0000  0.0000  0.0000
                                           0.0000  0.0000  0.0000  0.0000
    5. (0.00000) LP*( 1) B   1           s(100.00%)
The above data from the NBO .out file is interpreted thus. The first three entries (BD) indicate that Boron contributes 45.36% of its orbital, while the three Hydrogens have a combined contribution of 54.54%. The 33.33% s character and 66.67% p character of Boron's orbitals indicate an sp2 hybridisation, while Hydrogen's orbitals have 100% s character. Entry 4 denotes the 1s orbital (CR) resides with Boron, while entry 5 denotes a lone pair (LP*) with 100% s character on the Boron as well.
Second Order Perturbation Theory Analysis of Fock Matrix in NBO Basis
    Threshold for printing:   0.50 kcal/mol
                                                                             E(2)  E(j)-E(i) F(i,j)
        Donor NBO (i)                     Acceptor NBO (j)                 kcal/mol   a.u.    a.u.
===================================================================================================
within unit  1
  4. CR (   1) B   1                / 10. RY*(   1) H   2                    0.70    7.42    0.064
  4. CR (   1) B   1                / 11. RY*(   1) H   3                    0.70    7.42    0.064
  4. CR (   1) B   1                / 12. RY*(   1) H   4                    0.70    7.42    0.064
The second order perturbation theory is useful in determining the extent of interaction between bonding and non-bonding NBOs; judging by the low values in the E(2) column (0.70 kcal/mol), the interaction is weak.
Natural Bond Orbitals (Summary):
                                                           Principal Delocalizations
          NBO                        Occupancy    Energy   (geminal,vicinal,remote)
====================================================================================
Molecular unit  1  (H3B)
    1. BD (   1) B   1 - H   2          1.99854    -0.43328
    2. BD (   1) B   1 - H   3          1.99854    -0.43328
    3. BD (   1) B   1 - H   4          1.99854    -0.43328
    4. CR (   1) B   1                  1.99954    -6.68393  10(v),11(v),12(v)
    5. LP*(   1) B   1                  0.00000     0.53915
    6. RY*(   1) B   1                  0.00000     0.37512
    7. RY*(   2) B   1                  0.00000     0.37512
    8. RY*(   3) B   1                  0.00000    -0.04064
    9. RY*(   4) B   1                  0.00000     0.41499
   10. RY*(   1) H   2                  0.00015     0.73308
   11. RY*(   1) H   3                  0.00015     0.73308
   12. RY*(   1) H   4                  0.00015     0.73308
   13. BD*(   1) B   1 - H   2          0.00146     0.42130
   14. BD*(   1) B   1 - H   3          0.00146     0.42130
   15. BD*(   1) B   1 - H   4          0.00146     0.42130
      -------------------------------
             Total Lewis    7.99516  ( 99.9396%)
       Valence non-Lewis    0.00437  (  0.0547%)
       Rydberg non-Lewis    0.00046  (  0.0058%)
      -------------------------------
           Total unit  1    8.00000  (100.0000%)
          Charge unit  1    0.00000
TlBr3
Optimisation
Geometry optimisation was performed using the LANL2DZ basis set, which stands for Los Alamos National Laboratory 2 double zeta, used for transition metals such as Thallium in this case. This demonstrates the need for computational chemists to discern between molecules under investigation and apply correctly a method and basis set suited to the task. Also, the structure was restricted to D3h prior to running the optimisation.


        Item               Value     Threshold  Converged?
Maximum Force            0.000002     0.000450     YES
RMS     Force            0.000001     0.000300     YES
Maximum Displacement     0.000022     0.001800     YES
RMS     Displacement     0.000014     0.001200     YES
Predicted change in Energy=-6.083939D-11
Optimization completed.
   -- Stationary point found.
                          ----------------------------
                          !   Optimized Parameters   !
                          ! (Angstroms and Degrees)  !
--------------------------                            --------------------------
! Name  Definition              Value          Derivative Info.                !
--------------------------------------------------------------------------------
! R1    R(1,2)                  2.651          -DE/DX =    0.0                 !
! R2    R(1,3)                  2.651          -DE/DX =    0.0                 !
! R3    R(1,4)                  2.651          -DE/DX =    0.0                 !
! A1    A(2,1,3)              120.0            -DE/DX =    0.0                 !
! A2    A(2,1,4)              120.0            -DE/DX =    0.0                 !
! A3    A(3,1,4)              120.0            -DE/DX =    0.0                 !
! D1    D(2,1,4,3)            180.0            -DE/DX =    0.0                 !
--------------------------------------------------------------------------------


As shown, these data collated from the output file indicate that convergence had occurred, that optimisation had found an energy minima after three iterations.
Frequency Analysis
| No. | Vibrational mode | Animation | Symmetry | Frequency /cm-1 | Intensity | Description |
| 1 | Scissoring (in plane) |  |
E' | 46.43 | 3.69 | Two Bromine atoms move within the plane of the Thallium atom, resembling the closing and opening of a pair of scissors. |
| 2 | Rocking (in plane) |  |
E' | 46.43 | 3.69 | Two Bromine atoms rock in phase in the plane of the Thallium atom, while the third rocks out of phase. |
| 3 | Wagging (out of plane) |  |
A2" | 52.14 | 5.85 | Also known as umbrella opening, Bromine atoms move above the plane of the Thallium atom, with the B atom itself oscillating out of phase. |
| 4 | Stretching (symmetric) |  |
A1' | 165.27 | 0.00 | All 3 Tl-Br bonds extend and contract in phase, contributing zero dipole moment overall. |
| 5 | Stretching (asymmetric) |  |
E' | 210.69 | 25.48 | Two Tl-Br bonds extend and contract out of phase, with the third bond length remaining constant. |
| 6 | Stretching (asymmetric) |  |
E' | 210.69 | 25.48 | Two Tl-Br bonds extend and contract in phase, with the third bond oscillating out of phase. |
Low frequencies ---   -3.4213   -0.0026   -0.0004    0.0015    3.9367    3.9367
Low frequencies ---   46.4289   46.4292   52.1449
As shown, negative values for low frequencies were found - however, since they lie between values of -10 to 0 cm-1, it is within acceptable range. If negative values of over -10 were found though, it would be an indication that optimisation had not been conducted successfully, as that indicates a significant movement of the atom about its centre of mass, a factor which should not contribute to its vibrational spectra.
What is a bond?
During the course of the exercise, it was noted that for some compounds the bonds would disappear after an optimisation of its geometry. This reflects a limitation of Gaussview, wherein its recognition of chemical bonds rely on interatomic distances lying within a known, predefined range; but also highlights the need to define a bond in a manner that reflects modern chemistry.
A preliminary understanding of bonding can roughly divide bonding into Covalent, Ionic or Metallic, which has its uses but does not fully explain compounds that do not conveniently fall into any clear cut category; for example, the Li-I bond is commonly described as ionic with covalent character.
The advent of quantum mechanics has given chemists the wavefunction, solutions of which give rise to atomic and molecular orbitals that describe the bonding between atoms. Within this framework, far greater accuracy has been achieved in predicting bonding and reactivity, superceding older methods such as the useful but flawed VSEPR model. The overlap of molecular orbitals in a manner that lowers the overall electronic energy level is the best understanding of what a "bond" is. While the other frameworks of understanding have their uses, for the working chemist there is currently no better model.
Isomers of Mo(CO)4L2

In this investigation, two isomers of an octahedral Molybdenum complex was modelled and subject to analysis. The original intent was to model Mo(CO)4(PPh3)2; however, the computational demands of modelling three phenyl rings renders it infeasible within the timeframe of this exercise, so a reasonable substitute of Mo(CO)4(PCl3)2 was chosen instead, reducing the number of atoms that need to be considered.
In contrast to previous procedures, optimization was carried out with 3 different methods, listed as follows:
- LANL2MB - for loose optimisation.
- LANL2DZ - for tighter optimisation applied to the already loosely optimised complex, using a higher level basis set.
- Modified LANL2DZ - taking account of hypervalency in Phosphorus, as its dAOs are known to participate in bonding sometimes.
Optimisation
The three methods of optimisation outlined above were applied to both the cis- and trans- isomers. The resulting Jmols, summary files, Total energy plots and RMS gradient plots of optimisation are provided below.
(DOI:10042/to-13129 )
(DOI:10042/to-13130 )

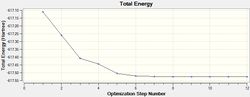

The LANL2MB basis set was used, which is the smallest of the 3 employed, making this optimisation the loosest one. Nevertheless, convergence is confirmed to have occurred, with a sufficiently low RMS Gradient norm value at the end of 12 optimisation iterations for cis, and 8 for trans.
(DOI:10042/to-13131 )
(DOI:10042/to-13132 )


A tighter optimisation was run on the already loosely optimised structure from above, this time using the larger LANL2DZ basis set. Again, there is confirmation of convergence from a low RMS gradient norm value, with the energy minima reached by optimisation iteration 7 for cis, and 9 for trans. An important point to note is that computation time using this method was longer than that of the loose optimisation with the smaller LANL2MB basis set, reflecting the trade-off between accuracy and computation time. One indication that this optimisation has achieved a globally lower minima is the lower Dipole moment of the cis- isomer: 1.31D down from 8.48D.
(DOI:10042/to-13144 )
(DOI:10042/to-13134 )


The third and final attempt at optimisation used the modified LANL2DZ basis set, accounting for Phosphorous hypervalency. Once again there is confirmation of convergence from the low RMS gradient norm values, with the energy minima reached by optimisation iteration 7 for cis, and 9 for trans. Again, the Dipole moment indicates that this optimisation is again better at finding the global minima than the previous one: for cis-, it went down from 1.31 to 0.07 Debye; for trans-, it went down from 0.31 to 0.23 Debye.
| Cis isomer | Calculated bond lengths (Å) | Literature value[2] |
| Mo-C | 2.05 | - |
| Mo-P | 2.48 | 2.58 |
| C-O | 1.17 | - |
| P-Cl | 2.12 | 1.83 |
| Trans isomer | Calculated bond lengths (Å) | Literature value[3] |
| Mo-C | 2.06 | 1.85 |
| Mo-P | 2.42 | 2.50 |
| C-O | 1.17 | 1.16 |
| P-Cl | 2.12 | - |
Frequency Analysis
Below are the computed IR spectra for both the cis- and trans- isomers, two each, one optimized using the LANL2DZ basis set and the other with the modified LANL2DZ basis set.
Optimised Cis Isomer IR spectrum:

(DOI:10042/to-13133 )

(DOI:10042/to-13144 )
Optimised Trans Isomer IR spectrum :
(DOI:10042/to-13145 )
(DOI:10042/to-13134 )
Vibrational analysis
Carbonyl Stretches
Cis isomer stretches:
| No | Vibrational Mode | Animation | Description | LanL2DZ Optimisation Frequency [cm-1] [Intensity] | 3rd Optimisation Frequency [cm-1] [Intensity] | Literature Frequency [cm-1][4] |
|---|---|---|---|---|---|---|
| 1 | PCl3 Scissor Bending |  |
IR inactive | 10.84 [0.03] | 11.73 [0.02] | - |
| 2 | PCl3 Twist |  |
IR inactive | 17.66 [0.01] | 20.28 [0.00] | - |
| 3 | B2 |  |
Asymmetric stretch of equatorial CO ligands | 1945.31 [763.15] | 1938.09 [1604.90] | 1897 |
| 4 | B1 |  |
Asymmetric stretch of axial CO ligands | 1948.63 [1498.04] | 1941.52 [813.19] | 1908 |
| 5 | A1 |  |
Symmetric stretch of equatorial CO ligands | 1958.35 [632.40] | 1952.37 [588.39] | 1927 |
| 6 | A1 |  |
Symmetric stretch of axial CO ligands | 2023.29 [598.03] | 2019.13 [544.65] | 2023 |
Trans isomer stretches:
| No | Vibrational Mode | Animation | Description | LanL2DZ Optimisation Frequency [cm-1] [Intensity] | Modified LanL2DZ Optimisation Frequency [cm-1] [Intensity] | Literature Frequency [cm-1][5] |
|---|---|---|---|---|---|---|
| 1 | PCl3 Scissor Bending | IR inactive mode | 4.96 [0.09] | 4.54 [0.05] | ||
| 2 | PCl3 Twist | IR inactive mode | 6.21 [0.00] | 7.03 [0.00] | ||
| 3 | B2 | Asymmetric stretch of equatorial CO ligands | 1950.41 [1475.54] | 1939.12 [1606.59] | 1886 | |
| 4 | B1 | Asymmetric stretch of axial CO ligands | 1951.08 [1466.78] | 1939.84 [1606.03] | 1866 | |
| 5 | A1 | Symmetric stretch of equatorial CO ligands | 1977.34 [0.64] | 1966.79 [5.94] | 1933 | |
| 6 | A1 | Symmetric stretch of axial CO ligands | 2031.12 [3.72] | 2025.44 [5.38] | 2050 |
Low frequencies
Cis Isomer
Low frequencies ---   -1.3405   -0.0003   -0.0003    0.0006    0.7323    1.9128
Low frequencies ---   11.7435   20.2824   45.8808
Trans Isomer
Low frequencies ---   -2.2591   -1.9000   -0.0002    0.0002    0.0006    3.0385
Low frequencies ---    4.6612    7.0651   40.4863
Mini Project
Introduction
 |
 |
 |
||||
| CrCO6 | Cr(CO)5CF3 | Cr(CO)5C(OCH3)CH3[6] |
Geometry Optimisation
Atomic-type orbitals of fixed size are used in minimal basis sets, which contain the minimum number of basis functions needed. For example, when considering oxygen, the relevant orbitals are 1s, 2s, 2px, 2py and 2pz. For geometry optimisation, the choice of basis sets is a trade-off between accuracy and computation time. For elements from H to Xe, the 6-31G basis set is commonly used as it is relatively undemanding on computational resources; while still giving a reasonable (though not entirely accurate) result, because it has two or more sizes of basis functions for each valence orbital. For example, it would treat each of carbon's 2s, 2px, 2py and 2pz as multiple differently sized orbitals. In order to improve the accuracy of results, the 6-311G(d,p) basis set, which incorporates angular momentum and orbital shape into its calculations, was further used in subsequent optimisations for all 3 molecules under investigation.This basis set is commonly used for first and second row elements of the periodic table. A major drawback to the 6-311G(d,p) basis set is its poor performance toward most transition metals, which poses a problem for this investigation of Chromium complexes. For the TM centre, the LanL2DZ basis set was used, as it was developed to cope with heavy elements in its calculations. Thus the GEN method with the combination of 6-311G(d,p) for the C, H, O and F atoms, and LanL2DZ for the Cr metal centre strikes a good balance between accuracy and computational demands, and was chosen for final geometry optimisations of the complexes.
CrCO6
Chromium hexacarbonyl is an organometallic complex, with octahedral geometry and a closed shell of 18 valence electrons.
For both B3LYP/6-31G and the GEN method, 5 steps were needed before optimisation. As expected, the GEN method which incorporates the larger basis set LANL2DZ and 6-311G(d,p) took a longer time for optimisation to complete. The point group of the molecule was also correctly predicted in both cases, Oh, which also explains its complete lack of a dipole moment.

DOI:10042/to-13140

DOI:10042/to-13139

DOI:10042/to-13140

DOI:10042/to-13139

DOI:10042/to-13140

DOI:10042/to-13139
Cr(CO)5CF3
Cr(CO)5CF3 is similar to Cr(CO)6 except one of its carbonyl ligands is replaced by CF3. The effect of this change in a ligand on the structure, bond lengths, IR spectra is investigated.
For B3LYP/6-31G, 11 steps were needed before complete optimisation, while 13 were needed for the GEN method using 6-311G(d,p) & LANL2DZ basis sets. As expected, the GEN method which incorporates the larger basis set LANL2DZ and 6-311G(d,p) took a longer time for optimisation to complete. An immediately apparent difference to Cr(CO)6 is the presence of its dipole moment, as it is no longer octahedral, and instead has C1 symmetry.

DOI:10042/to-13143

DOI:10042/to-13138

DOI:10042/to-13143

DOI:10042/to-13138

DOI:10042/to-13143

DOI:10042/to-13138
Cr(CO)5(C(OCH3)CH3)
Again, Cr(CO)5(C(OCH3)CH3) is similar to Cr(CO)6 except one of its carbonyl ligands is replaced by (C(OCH3)CH3). The effect of this change in a ligand on the structure, bond lengths, IR spectra is investigated.
28 steps were required for the 6-31G basis set to achieve convergence, and 30 were needed for the GEN method of 6-311G(d,p) & LANL2DZ mixed basis sets. The introduction of (C(OCH3)CH3) has greatly increased the number of optimization intermediates required. This was expected as it introduces 10 atoms into the system, complicating computational tasks and driving up its resource demands.

DOI:10042/to-13142

DOI:10042/to-13141

DOI:10042/to-13142

DOI:10042/to-13141

DOI:10042/to-13142

DOI:10042/to-13141
Bond Angles and Lengths
For ease of understanding, the -CF3 and -C(OCH3)CH3 substituents to the Cr metal centre are denoted as axial.
Metal Carbonyl Complexes
| No. | Bond Type | 6-31G Optimisation Bond Length [Å] | 6-311G(d,p) and LanL2DZ Optimisation
Bond Length [Å] |
Literature Value [Å][7] |
|---|---|---|---|---|
| 1 | Cr-C (equatorial) | 1.91 | 1.92 | 1.92 |
| 2 | Cr-C (axial) | 1.91 | 1.92 | 1.92 |
| 3 | C-O (equatorial) | 1.17 | 1.14 | 1.14 |
| 4 | C-O (axial) | 1.17 | 1.14 | 1.14 |
The extremely good agreement between literature values for bond lengths and those obtained through 6-311G(d,p) and LanL2DZ optimisation indicates that this method is an excellent choice for modelling this particular complex, and probably other first row transition metal complexes as well. Its greater accuracy over the 6-31G basis set can be attributed to it being a larger basis set, and also that LanL2DZ accounts for d orbitals better.
| No. | Bond Type | 6-31G Optimisation Bond Length [Å] | 6-311G(d,p) and LanL2DZ Optimisation
Bond Length [Å] |
|---|---|---|---|
| 1 | Cr-C (equatorial) | 1.94 | 1.95 |
| 2 | Cr-C (axial CO) | 1.95 | 1.98 |
| 3 | Cr-C (axial CF3) | 2.11 | 2.14 |
| 4 | C-O (equatorial) | 1.16 | 1.13 |
| 5 | C-O (axial) | 1.16 | 1.14 |
While no literature values for this compound could be found, its inclusion into this investigation serves to demonstrate what effects substituents can have on the metal ligand bonds of a complex, and the other ligands themselves. Though the values obtained through the basis set 6-31G are included for completeness, we will be focusing on the values obtained through 6-311G(d,p) and LanL2DZ optimisation.
In comparison to Cr(CO)6, both the axial and equatorial Cr-C bonds were weakened in this complex, with the axial Cr-C suffering a greater weakening, indicating a trans effect caused by the CF3 ligand. The C-O bond lengths of the carbonyls themselves remain relatively unaffected, so the Cr-C bond weakening should not be attributed to any backbonding on the part of the Cr metal centre, and should be explained by the strong electron-withdrawing ability of Fluorine drawing electron density away from the Cr-C bonds. This hypothesis will be further investigated in the following NBO section.
| No. | Bond Type | 6-31G Optimisation Bond Length [Å] | 6-311G(d,p) and LanL2DZ Optimisation
Bond Length [Å] |
Literature Value[Å][8] |
|---|---|---|---|---|
| 1 | Cr-C (equatorial) | 1.89 | 1.91 | 1.91 |
| 2 | Cr-C (axial CO) | 1.89 | 1.90 | 1.90 |
| 3 | Cr-C (axial C(OCH3)CH3) | 2.05 | 2.06 | 2.02 |
| 4 | C-O (equatorial) | 1.18 | 1.14 | - |
| 5 | C-O (axial) | 1.17 | 1.15 | 1.15 |
Similar to CrCO6, there was very good agreement between literature values and those obtained through 6-311G(d,p) and LanL2DZ optimisation. The corroboration of this case strengthens the support for this method as an accurate means to model first row transition metal complexes. The only anomaly is in the predicted Cr-C (axial C(OCH3)CH3), which is higher than expected and actually deviates more than the value obtained through 6-31G optimisation. A further point to note is that despite being depicted as a Cr=C bond (i.e. a carbene), both the computed and literature values were greater than the Cr-C single bonds in CrCO6.
Frequency Analysis
CrCO6 IR Spectra

DOI:10042/to-13140

DOI:10042/to-13139
Cr(CO)5CF3 IR Spectra

DOI:10042/to-13143

DOI:10042/to-13138
Cr(CO)5(C(OCH3)CH3) IR Spectra

DOI:10042/to-13142

DOI:10042/to-13141
Due to the highly symmetrical nature of Cr(CO)6 with its Oh point group, and the fact that it has no functional groups beyond carbonyl ligands, it has the fewest IR peaks compared to the other two complexes. Another point of interest is the carbonyl peak in the 2000cm-1 region. In Cr(CO)5CF3, it is notably shifted up, indicating a strengthening of the C-O bond in the carbonyl ligands; this also corresponds to the slightly shorter C-O bond distance of 1.13Å versus 1.14Å in Cr(CO)6.
Charge Distribution Analysis
The colour on the diagrams illustrate the charge distribution, on a spectrum with green indicating positive charge, and red indicating negative charge.

DOI:10042/to-13135

DOI:10042/to-13137

DOI:10042/to-13136
As a follow-up from the Bond Length section above, the charge distribution analysis of Cr(CO)5CF3 shows a significant positive charge developed on the Cr metal centre, in contrast to the other two complexes. Since both Cr and C are predicted to develop a negative charge as opposed to the other two where the metal centre carries a positive charge, the Cr-C bond for Cr(CO)5CF3 would be expected to be weaker in comparison. This corroborates with the longer Cr-C bond distance observed in Cr(CO)5CF3 in the earlier analysis.
Conclusion
The application of computational methods to inorganic chemistry was showcased. In particular the basis sets 3-21G, 6-31G, 6-311G(d,p), LANL2MB, LANL2DZ were used, showing the trade-off between longer computation time and higher accuracy in calculations achievable by larger basis sets. It was further shown that basis sets such as LANL2DZ which specifically cater for transition metals produce results better suited for complexes containing them; these methods can be used to predict properties such as bond lengths and vibrational spectra. Additionally, the potential for Molecular Orbitals in explaining reactivity and structure was explored.
References
- ↑ http://www.shodor.org/chemviz/optimization/students/background.html
- ↑ F. A. Cotton, Inorg. Chem., 21, 1982, pp 294 - 299
- ↑ D. W. Bennett, J. Chem. Cryst., 34(6), 2004, pp 353 - 359
- ↑ Darensbourg, D.J.; Inorg. Chem., 18(1), 1979, pp 14-17
- ↑ Darensbourg, D.J.; Inorg. Chem., 18(1), 1979, pp 14-17
- ↑ Imperial College Chemistry Inorganic Course 2I.3 Transition Metal Coordination & Organometallic Chemistry, Lecture 7, Slide 14
- ↑ Figgus, B.N.; Sobolev, A.N.; Acta. Cryst., 2004, E60, i93-i94
- ↑ M.T., Lee; C.H., Hu; Organometallics, 23, 2004, pp. 976 - 983