Danspage
Ammonia NH3
Parameters from optimisation
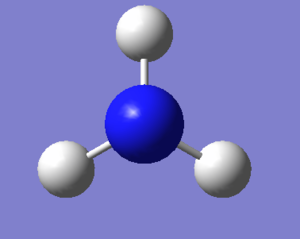
Ammonia can be modelled using gaussiview. This model can then be optimised by finding the stable equilibrium arrangement of the atoms. From this optimisation, a series of parameters can be extracted. These parameters are listed in the table below.
| Query | Result |
|---|---|
| Molecule | NH3 |
| Calculation method | RB3LYP |
| Basis Set | 6-31G(d,p) |
| Final Energy (au) | -56.55776873 |
| RMS Gradient (au) | 0.00000485 |
| Point group | C3V |
| N-H Bond length (Å) | 1.01798 |
| H-N-H Bond Angle(°) | 105.74115 |
Table 1: Ammonia Data
        Item             Value        Threshold    Converged?
Maximum Force            0.101823     0.000450     NO
RMS     Force            0.068634     0.000300     NO
Maximum Displacement     0.187375     0.001800     NO
RMS     Displacement     0.123109     0.001200     NO
Predicted change in Energy=-4.704240D-02
Table 2: Ammonia 'item' table
Figure 2:jmol image of optimised Ammonia |
The optimisation file is linked to here
Vibrations in Ammonia
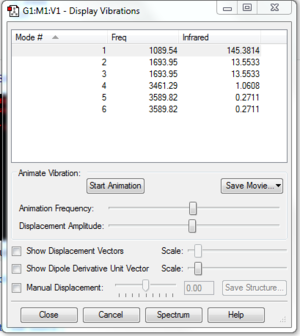
| Query | Result |
|---|---|
| Expected number of nodes | 3N-6= 3(4)-6= 6 |
| Degenerate modes | 2 |
| Bending modes | 3 |
| Stretching modes | 3 |
| Highly symmetric mode | Mode 4 (stretching mode) |
| Umbrella mode | Mode 1 (bending mode) |
| Expected bands in experimental spectrum | 2 |
Table 3: Questions on vibrational modes in Ammonia
Charge Distribution
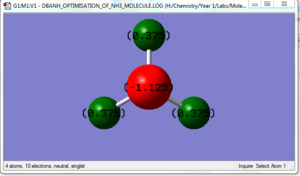
Nitrogen is more electronegative than hydrogen so the expected charge distribution would be a positive dipole on the hydrogen and a negative dipole on the nitrogen. The charge on the Nitrogen atom is -1.125 whilst the charge on the hydrogen atoms is +0.375.
Nitrogen
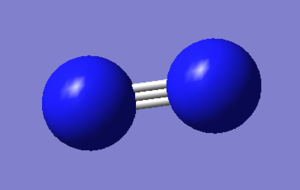
Parameters extracted from optimisation of N2
| Query | Result |
|---|---|
| Molecule | NH3 |
| Calculation method | RB3LYP |
| Basis Set | 6-31G(d,p) |
| Final Energy (au) | -109.52412868 |
| RMS Gradient (au) | 0.00000060 |
| Point group | D*H |
Table 4: Nitrogen Data
         Item             Value        Threshold    Converged?
 Maximum Force            0.000001     0.000450     YES
 RMS     Force            0.000001     0.000300     YES
 Maximum Displacement     0.000000     0.001800     YES
 RMS     Displacement     0.000000     0.001200     YES
 Predicted change in Energy=-3.401079D-13
Table 5: Nitrogen item table
Figure 5:jmol image of optimised Nitrogen |
The optimisation file is linked to here
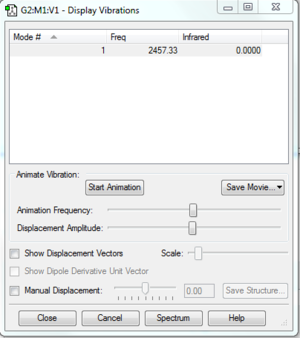
Vibrational modes of N2
Hydrogen
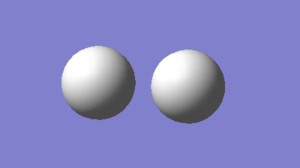
Parameters extracted from optimisation of H2
| Query | Result |
|---|---|
| Molecule | NH3 |
| Calculation method | RB3LYP |
| Basis Set | 6-31G(d,p) |
| Final Energy (au) | -1.17853936 |
| RMS Gradient (au) | 0.00000017 |
| Point group | D*H |
Table 6: Hydrogen Data
         Item             Value        Threshold    Converged?
 Maximum Force            0.168347     0.000450     NO
 RMS     Force            0.168347     0.000300     NO
 Maximum Displacement     0.119698     0.001800     NO
 RMS     Displacement     0.169278     0.001200     NO
 Predicted change in Energy=-2.130559D-02
Table 7: Hydrogen 'item' table
Figure 8:jmol image of optimised Hydorgen |
The optimisation file is linked to here
Vibrational modes of H2
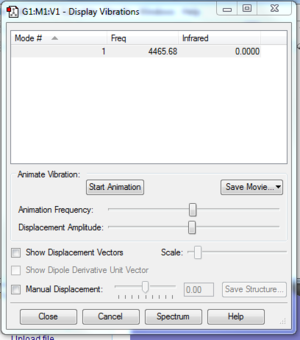
Haber process
| Item | Energy (au) |
|---|---|
| NH3 | -56.55776873 |
| 2*NH3 | -113.1155375 |
| N2 | -109.52412868 |
| H2 | -1.17853936 |
| 3*H2 | -3.53561808 |
| ΔE | -0.05579074 |
Table 8: Energy change in the Haber process
ΔE for the Haber process is -0.05579074 or -146.479 KJ mol-1
This overall energy change is negative so the reactants are less thermodnamically stable compared to the products.
Borane
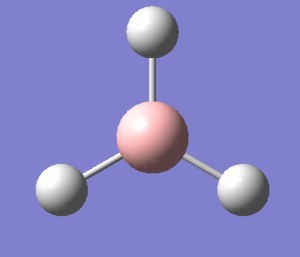
| Query | Result |
|---|---|
| Molecule | BH3 |
| Calculation method | RB3LYP |
| Basis Set | 6-31G(d,p) |
| Final Energy (au) | -26.61532364 |
| RMS Gradient (au) | 0.00000211 |
| Point group | D3H |
| B-H Bond length (Å) | 1.19232 |
| H-B-H Bond angle (°) | 120.00000 |
Table 9: Borane data
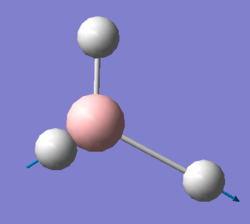
Figure 11:jmol image of optimised Borane |
The optimisation file is linked to here
         Item             Value        Threshold    Converged?
 Maximum Force            0.006105     0.000450     NO
 RMS     Force            0.003997     0.000300     NO
 Maximum Displacement     0.023278     0.001800     NO
 RMS     Displacement     0.015239     0.001200     NO
 Predicted change in Energy=-2.135202D-04
Table 10: Borane 'item' table
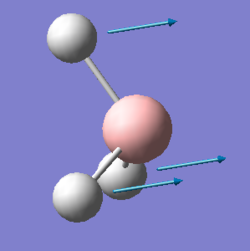
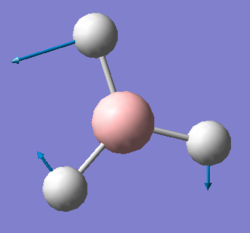
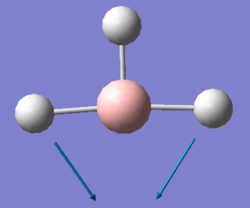
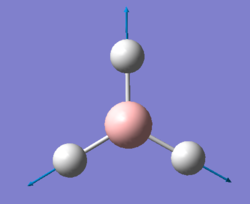
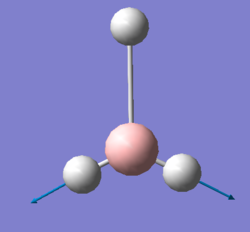
Vibrations
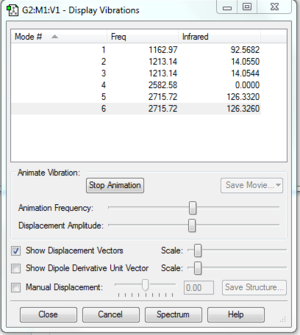
Table 11: Informatin on Vibrational modes in Borane
Borane has 2 sets of degenerate vibrational modes. One vibrational mode doesn't appear in the Infrared spectrum because the stretching vibrational mode doesn't result in a change in dipole moment so cannot be detected by Infrared spectroscopy. The number of vibrational modes is also expected. Borane should have 3N-6 vibrational modes because it is non-linear. This is consistent with the 6 vibrational modes shown in the above table: 3(4)-6= 6.
Charge distribution
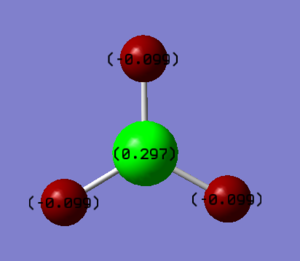
Boron is slightly more electropositive compared to Hydrogen so as a result, negative charge on Borane is skewed towards the hydrogen atoms. This is due to hydrogen atoms being smaller than Boron atoms. However, Borane doesn't have a dipole moment as it has a D3H point group so is arranged with a trigonal planar structure. Due to this symmetry, There is no overall dipole. The Boron has a charge of +0.297 and the hydrogen atoms have a charge of -0.099.
Molecular orbitals
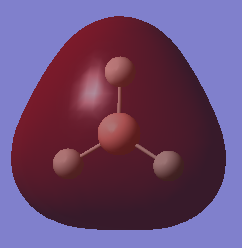
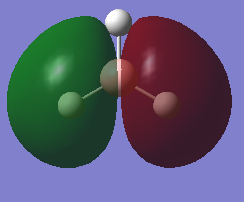
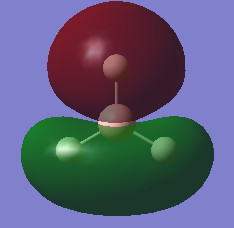
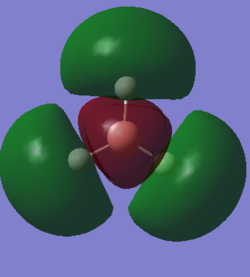
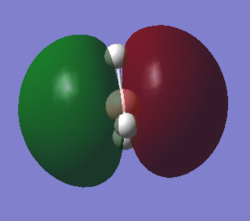
Molecular orbitals in Boron trifluoride are formed by the combination of Atomic orbitals from the Boron atom and Ligand group orbitals (LGOs) formed by the combination of the hydogren atomic orbitals. Combining the Hydrogen atoms forms 3 LGOs. LGO 1 is a bonding molecular orbital formed, LGO 2 is a non bonding molecular orbital and LGO 3 is an anti bonding molecular orbital. These LGOs ten combine with the 2s and 2p orbitals to form new molecular orbitals. The Boron 1s orbital is too deep in energy to participate in the formation of new molecular orbitals.
Table 12: Molecular orbital data

