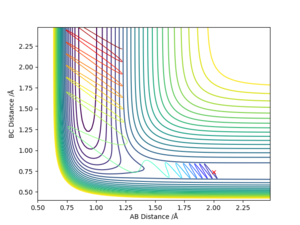
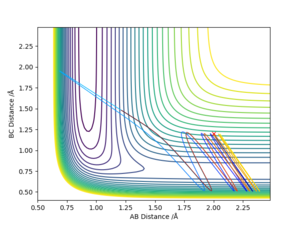
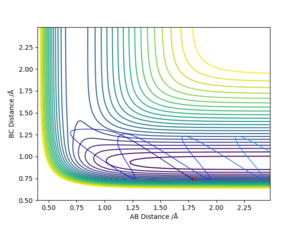
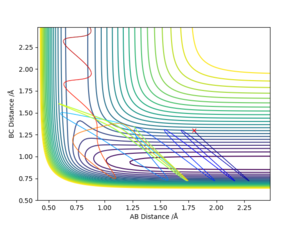
DY:01359531
Molecular Reaction Dynamics
H+H2 System
The experiment is analysed under the condition:
| distance | momentum |
|---|---|
| rab =0.74 | pab =0 |
| rbc =2.30 | pbc =-2.7 |
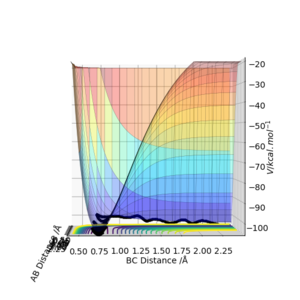
Transition state Definition
Define the following factors: L=length of the linearly placed hydrogen= rab +rbc S=difference between rab and rbc = rab -rbc
On the potential energy surface, the transition state is the saddle point, which is defined by
∂U/∂L=0 ; ∂U/∂L2>0
∂U/∂S=0 ; ∂U/∂S2<0
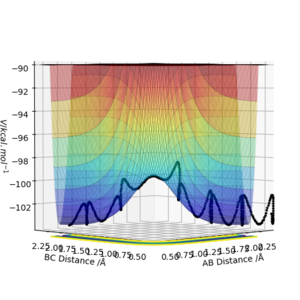
From Figure 1., the transition state must lie on the line which moves through the lowest energy surface shown on the graph, which in this case is the reaction path, the Bold Black line.
As for a Local Minimum:
∂U/∂L=0 ; ∂U/∂L2>0
∂U/∂S=0 ; ∂U/∂S2>0
From Figure 2., there are several turning points. However, the transition state is the point at the middle where S=0.This is because it is a symmetric reaction, which means that at the transition state rab =rbc . Any other turning points are known as local minimum points. Reason for the reaction pathway to vibrate along the potential surface is due to vibration energy.
Transition State Position
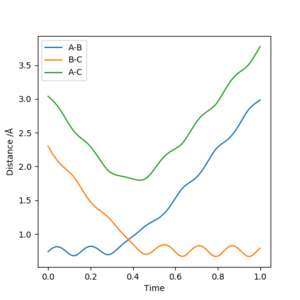
Using the same parameters as above, a Internuclear Distances VS Time graph has been plotted where the transition state is shown as the intercept of the blue and orange line.
Therefore, A B and C are equally separated.
The parameters are then set to:
| distance | momentum |
|---|---|
| rab =1.20 | pab =0 |
| rbc =1.20 | pbc =0 |
These parameters are set because the saddle point must satisfy rab =rbc .
The energy surface diagram is then analysed by MEP and the data are exported as Excel.
Since TS has the lowest potential energy,searching for the lowest V would give a corresponding distance:
rab =rbc =rts =0.908 Å
MEP and Dynamic Trajectory
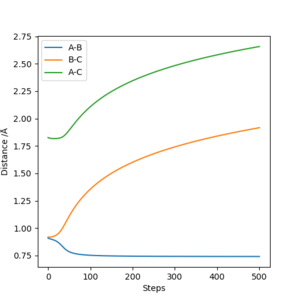
| distance | momentum |
|---|---|
| rab =0.908 | pab =0 |
| rbc =0.918 | pbc =0 |
Both MEP and Dynamic calculation methods have been used to generate the Internuclear Distance VS Time plot.
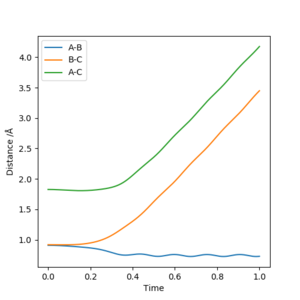
As can be seen from Fig 3. and Fig 4., the distance of B-C fluctuates after t=0.4 min for dynamic calculation while it is a straight line calculated by MEP.
Dynamic calculation has included the motion of the molecule, which means the fluctuation of the blue line is caused by the actual vibration of H2 molecule. MEP, however, only shows the lowest energy pathway.
Another difference shown on the graph is the gradient of the orange and green line. Shown on Fig 3. The gradient is decreasing with respect to time, this is because as the distance between H2 and H atom increases, the repulsion between them decreases, and therefore, from MEP calculation, it would show that the rate of separation is decreasing.
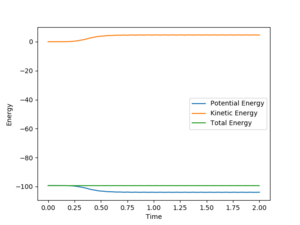
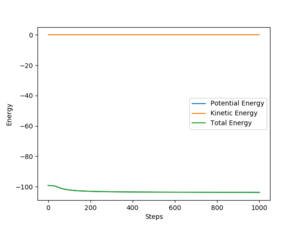
By comparing Fig 5. and Fig 6. it can be clearly seen that Dynamic calculation is based on the conservation of energy, while MEP only consider stating the minimum energy pathway.
Reactive and unreactive trajectory
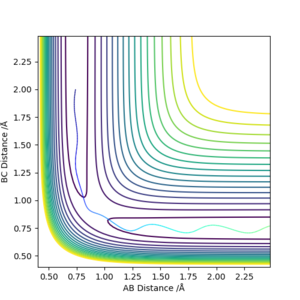
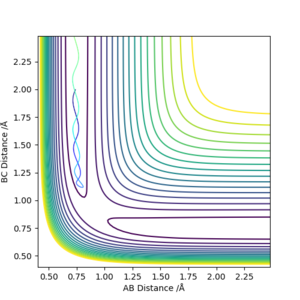
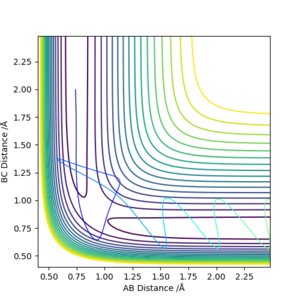
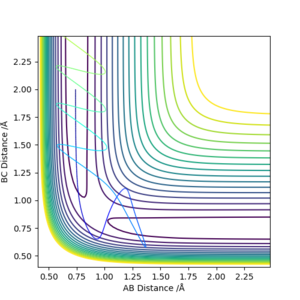
| pAB | pBC | Etot | Reactive? | Description of the dynamics |
|---|---|---|---|---|
| -1.25 | -2.5 | -99.0184 | Yes | Vibrating H2 molecule approaches HC atom and successfully interact, HBC molecule vibrates away |
| -1.5 | -2.0 | -100.456 | No | Vibrating H2 molecule approaches HC atom but does not have enough energy to overcome the transition state, the reaction does't proceed and HAB molecule vibrates back |
| -1.5 | -2.5 | -98.9549 | Yes | Vibrating H2 molecule approaches HC atom and successfully interact, however, at a faster rate |
| -2.5 | -5.0 | -84.9557 | No | Vibrating H2 molecule approaches HC atom, reactants have crossed the reaction barrier, transition state is reached where HB atom 'bounces' between HA and HC, however, HAB molecule is reformed and vibrates back |
| -2.5 | -5.2 | -84.4160 | Yes | Vibrating H2 molecule approaches HC atom, reactants have crossed the reaction barrier, transition state is reached where HB atom 'bounces' between HA and HC, finally, HBC molecule is formed and vibrates away. |
From these figures, it can be concluded that
1)for reaction to occur, molecules must posses energy higher than the reaction barrier.
2)for a reaction, higher energy the molecule possess, faster the rate of reaction
3)even if the molecules have energy higher than the transition state, the reaction still might not occur.
Transition State Theory
Assumption made:
Two basic assumptions:
1.Nuclear motion is stationary compared to electronic motion due to the large difference in mass (equivalent to the Born-Oppenheimer approximation)
2.Reactant molecules are distributed according to the Boltzmann distribution.
Three unique assumptions:
3.If the reactants passes the transition state in the direction of forming product, they can not turn back and reform reactants.
4.In the transition state, the motion of molecules in the direction of reaction coordinates can be separated from the other motions, it is not effected by the other motions and can be treated classically as Translation.
5.Assumption 2 still holds even in the absence of an equilibrium between reactants and products.
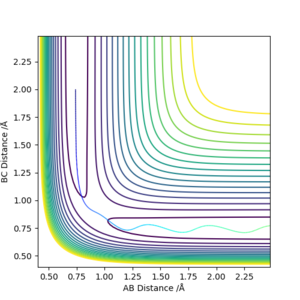
As shown on Fig 10., even if the reactants have passed through the transition state, it still reforms back to the reactant, this is against assumption 3.
F - H - H system
PES inspections
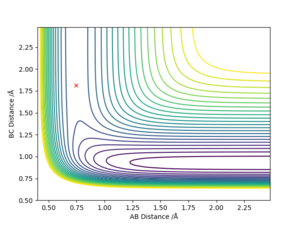

| Reaction | Reaction type | Transition state position |
|---|---|---|
| F + H2 → HF + H | Exothermic | rFH = 1.813 , rHH = 0.744 |
| H + HF → F + H2 | Endothermic | rHH = 1.813 , rHF = 0.744 |
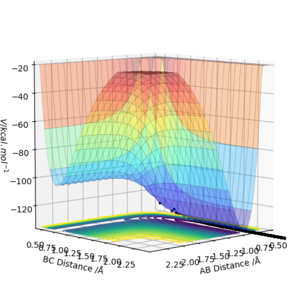
For F + H2 → HF + H reaction, the H-H bond is broken while a new H-F bond is formed.
Since H-F (565 Kj/moL) bond has a larger bond energy than H-H (432 Kj/moL), it suggests that this reaction is exothermic
As for the H + HF → F + H2 reaction, it is the opposite, H-F bond is broken and H-H bond is formed and it is deduced to be endothermic.
Activation energy
The activation energy for this reaction F + H2 → HF + H is: E=0.20 Kcal/moL
The activation energy for this reaction H + HF → F + H2 is: E=30 Kcal/moL
Reaction Dynamics
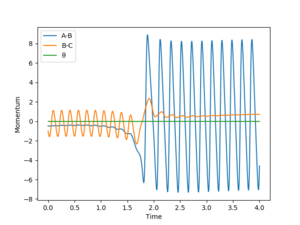
| distance | momentum |
|---|---|
| rFH = 2.0 | pFH = -0.5 |
| rHH = 0.8 | pHH = -1 |
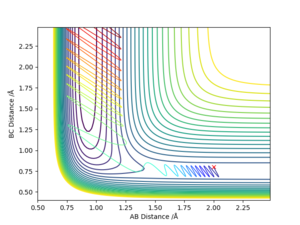
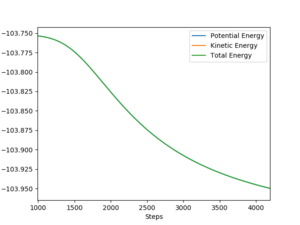
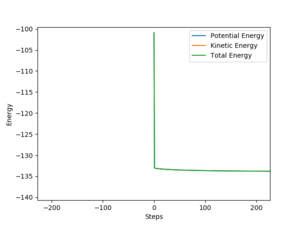
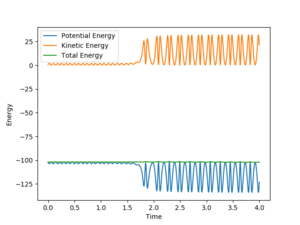
As shown on Fig 18., the potential energy decreases as the kinetic energy increases, the increase in KE corresponds to the heat generated during this exothermic reaction.
Polanyi's empirical rules
F + H2 = FH + H is an exothermic reaction, the transition state resembles the reactants and therefore, has a early barrier.
FH + H = F + H2 is an endothermic reaction, the transition state resembles the products and hence, possesses a late barrier.
Polanyi's rules states that:
1) Translation energy is most effective for crossing early barriers
2) Vibration energy is most effective for crossing late barriers
Therefore, it can be predicted that F + H2 = FH + H can occur under Low Vibration High Translation and FH + H = F + H2 under High Vibration Low Translation. This corresponds to the experimental data shown above.

