DS3817 MOWIKI
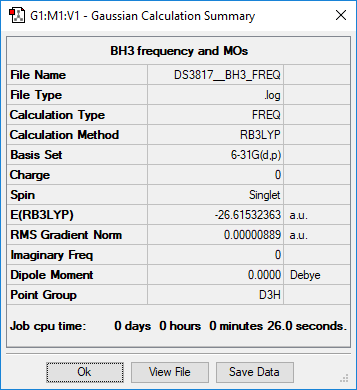
BH3
Summary
Method and Basis Set: RB3LYP/6-31G(d,p)
Optimisation
Item               Value     Threshold  Converged?
 Maximum Force            0.000018     0.000450     YES
 RMS     Force            0.000009     0.000300     YES
 Maximum Displacement     0.000070     0.001800     YES
 RMS     Displacement     0.000035     0.001200     YES
Frequency Analysis
Low frequencies ---  -10.3498   -3.4492   -1.2454   -0.0055    0.4779    3.2165
Low frequencies --- 1162.9519 1213.1527 1213.1554
3D image of optimised BH3
Optimised BH3 |
Vibrational Spectrum of optimised BH3
| Mode | Frequency (cm-1) | Infrared (Intensity) | Symmetry | IR Activity | Vibration Type |
|---|---|---|---|---|---|
| 1 | 1163 | 93 | A2" | Yes | Out of plant wagging |
| 2 | 1213 | 14 | E' | Slight | In plane scissoring |
| 3 | 1213 | 14 | E' | Slight | In plane rocking |
| 4 | 2582 | 0 | A1 | No | Symmetric stretching |
| 5 | 2716 | 126 | E' | Yes | Asymmetric stretching |
| 6 | 2716 | 126 | E' | Yes | Asymmetric stretching |
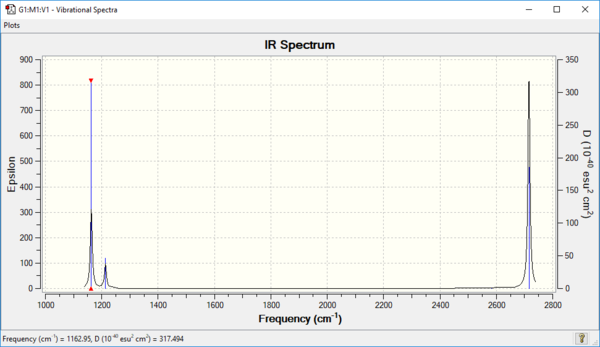
For a vibration to show up on an IR spectrum, it must induce a change in dipole moment. There are 6 vibrational modes in total, but one (mode 4 [2852]) does not result in the change in dipole moment. There are also two degenerate pairs of vibrations (mode 2, 3 [1213] and mode 5, 6 [2716]), hence resulting in only 3 IR peaks.
Good explanation with both reasons identified and nice detail in the table of the vibrational type in particular. Smf115 (talk) 21:02, 1 June 2019 (BST)
MO diagram for BH3

MO Theory is able to predict the AOs and their combinations very well, but can only approximate the shape of the MOs to a certain degree of accuracy when compared to the real MO. As a result, MO theory is unable to predict the effects based on the shapes of the MOs very well.
Clear inclusion of the MOs on to the diagram. Your evaluation of the usefulness of the LCAO MOs is ok but very general and you could have considered some specific examples, such as the difference in predicted contributions in the 3a1' or 2e' orbitals. Smf115 (talk) 21:05, 1 June 2019 (BST)
NH3
Summary
Method and Basis Set: RB3LYP/6-31G(d,p)
Optimisation
         Item               Value     Threshold  Converged?
 Maximum Force            0.000006     0.000450     YES
 RMS     Force            0.000004     0.000300     YES
 Maximum Displacement     0.000014     0.001800     YES
 RMS     Displacement     0.000009     0.001200     YES
Frequency Analysis
 Low frequencies ---   -0.0128   -0.0008    0.0009    7.1033    8.1047    8.1050
 Low frequencies --- 1089.3834 1693.9368 1693.9368
3D image of optimised NH3
Optimised NH3 |
BH3NH3
Summary
Method and Basis Set: RB3LYP/6-31G(d,p)
This is a repeat of the NH3 table! Smf115 (talk) 21:06, 1 June 2019 (BST)
Optimisation
         Item               Value     Threshold  Converged?
 Maximum Force            0.000121     0.000450     YES
 RMS     Force            0.000057     0.000300     YES
 Maximum Displacement     0.000564     0.001800     YES
 RMS     Displacement     0.000316     0.001200     YES
Frequency Analysis
Low frequencies ---   -0.0252   -0.0030    0.0009   17.0275   17.0301   36.9251
Low frequencies ---  265.7528  632.2151  639.3365
3D image of optimised BH3NH3
Optimised BH3NH3 |
Association Energies
Method and Basis Set: RB3LYP/6-31G(d,p):
- E(BH3) = -26.61532363 a.u.
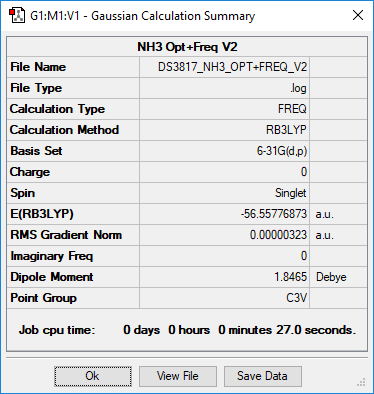
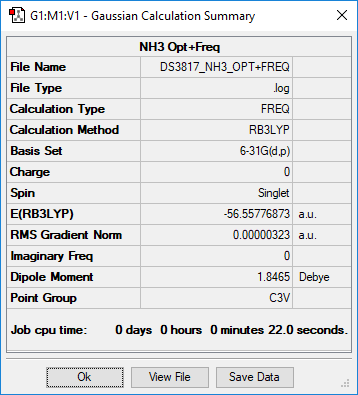
- E(NH3) = -56.55776873 a.u.
- E(NH3BH3) = -83.22468892 a.u.
- ΔE = E(NH3BH3)-[E(NH3)+E(BH3)] = (-83.22468892) - (-56.55776873 + (-26.61532363)) = -0.051597 a.u. = -135.47 kJmol-1
- The average C-C Bond strength is 348 kJmol-1[1] This is suggests that the N-B bond is quite weak when compared to a typical C-C bond.
Correct calcualtion, however, you should have considered the value of the final reported energy values (5 d.p. for a.u. and the nearest 1 for kJmol-1). Good, referenced comparison, to improve you could have mentioned why you chose this comparison. Smf115 (talk) 21:12, 1 June 2019 (BST)
NI3
Summary
Method and Basis Set: RB3LYP/6-31G(d,p)
Optimisation
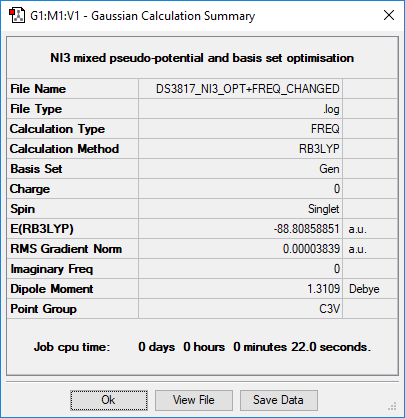
Optimised N-I bond length is 2.18362 Å
         Item               Value     Threshold  Converged?
 Maximum Force            0.000068     0.000450     YES
 RMS     Force            0.000044     0.000300     YES
 Maximum Displacement     0.000488     0.001800     YES
 RMS     Displacement     0.000364     0.001200     YES
Frequency Analysis
 Low frequencies ---  -12.7378  -12.7317   -6.2903   -0.0040    0.0188    0.0633
 Low frequencies ---  101.0325  101.0333  147.4123
3D image of optimised NI3
Optimised NI3 |
Correct implementation of the pseudopotential, just note that the calculation files should have been frequency log files and not opt freq files. Smf115 (talk) 21:14, 1 June 2019 (BST)
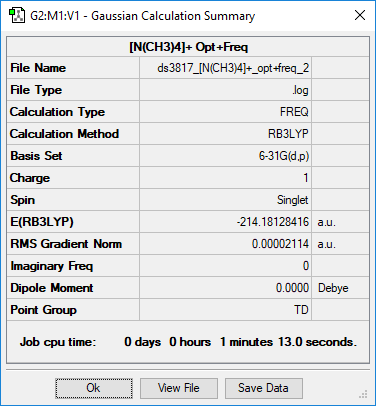
(NMe4)+
Summary
Method and Basis Set: RB3LYP/6-31G(d,p)
Optimisation
Optimised N-C bond length is 1.50956 Å
Optimised C-H bond length is 1.09019 Å
         Item               Value     Threshold  Converged?
 Maximum Force            0.000067     0.000450     YES
 RMS     Force            0.000017     0.000300     YES
 Maximum Displacement     0.000251     0.001800     YES
 RMS     Displacement     0.000081     0.001200     YES
Frequency Analysis
 Low frequencies ---   -0.0014   -0.0011   -0.0008   22.7149   22.7149   22.7149
 Low frequencies ---  189.1568  292.9977  292.9977
3D image of optimised (NMe4)+
Optimised NMe4+ |
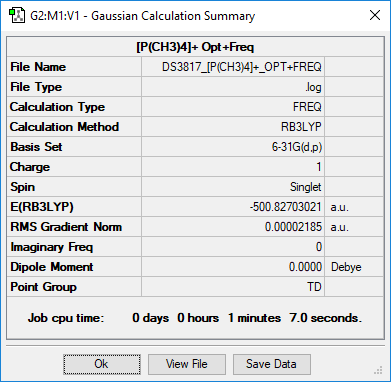
(PMe4)+
Summary
Method and Basis Set: RB3LYP/6-31G(d,p)
Optimisation
Optimised P-C bond length is 1.81667 Å
Optimised C-H bond length is 1.09333 Å
         Item               Value     Threshold  Converged?
 Maximum Force            0.000128     0.000450     YES
 RMS     Force            0.000032     0.000300     YES
 Maximum Displacement     0.000732     0.001800     YES
 RMS     Displacement     0.000306     0.001200     YES
Frequency Analysis
 Low frequencies ---    0.0025    0.0026    0.0030   26.3168   26.3168   26.3169
 Low frequencies ---  160.9765  195.4756  195.4756
3D image of optimised (NMe4)+
Optimised PMe4+ |
Comparing charge distribution between (NMe4)+ and (PMe4)+
| Diagram displaying charge distribution (with same colour range) | Charge of central heteroatom | Charge on carbon | Charge on hydrogen | |
| (NMe4)+ |  |
-0.295 | -0.483 | 0.269 |
| (PMe4)+ | 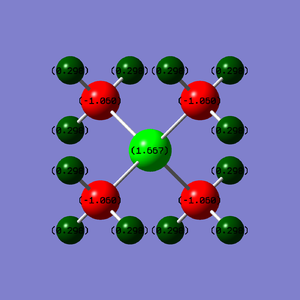 |
1.667 | -1.060 | 0.298 |
In the case of N(Me)4+, the central nitrogen atom does not carry the positive charge as we expected. Instead, the positive charge is carried by the hydrogens attached to the carbon, with the carbon carbon carrying the most negative charge. The nitrogen is surrounded by four methyl groups in a tetrahedral geometry and despite nitrogen being more electronegative than carbon, the majority of the negative charge is still carried by the carbon due to the donation (dative bonding) of the nitrogen lone pair to a methyl group in forming the tetramethylammonium cation.
In the case of P(Me)4+, the central phosphorus atom is the most positive, followed by the hydrogen, then the carbon. This follows the electronegativity scale where carbon is the most electronegative out of the three atoms, followed by hydrogen, then phosphorus.
In both cases, the charges on the hydrogens are quite similar. This suggests that the inductive effect by the central heteroatom only has a small effect on the hydrogens.
Correct NBO charges calculated and good use of a uniform colour range to display the charge distributions! Your charge analysis is ok and the comment on the similarity of the H charges is nice. However, you could have developed the justification using the relative electronegativities more, compared the two molecules or mentioned other factors such as symmetry.Smf115 (talk) 18:35, 4 June 2019 (BST)
You haven't really explained why the +1 formal charge arises on the N in the traditional picture (consider formal electron counting) and the mention of the dative bond resulting in the real C charges calculated isn't quite correct in the real charge picture.Smf115 (talk) 18:35, 4 June 2019 (BST)
Molecular Orbitals of (NMe4)+ and (PMe4)+
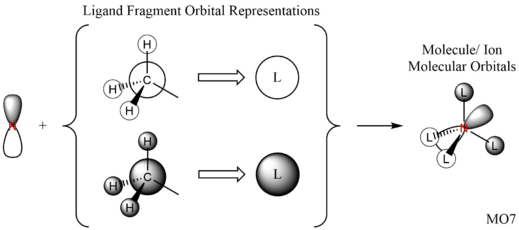
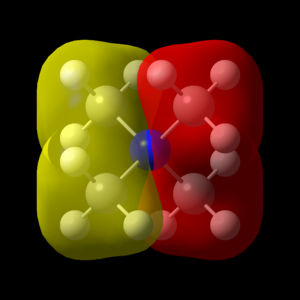
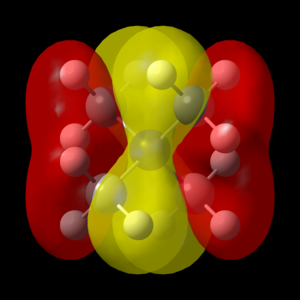
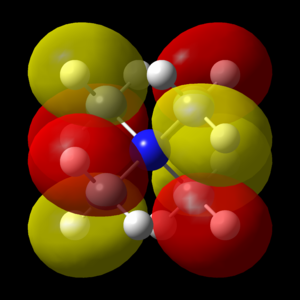
Great presentation with excellent use of jmols! You've selected a good range of MOs, all having different ligand FOs which are all correct. To improve, it would have just been nice to see some analysis to justify the assigned MO character. Smf115 (talk) 18:43, 4 June 2019 (BST) Overall, a good report and well presented. Smf115 (talk) 18:43, 4 June 2019 (BST)| MO | Energy (a.u.) | JSmol | MO Image | LCAO MO Diagram | Bonding Character | |||
|---|---|---|---|---|---|---|---|---|
| 7 | -0.92552 |
|
 |
 |
Strongly Bonding | |||
| 14 | -0.62246 |
|
 |
 |
Weakly Bonding | |||
| 16 | -0.58035 |
|
 |
 |
Non-bonding |
- ↑ https://chem.libretexts.org/Bookshelves/General_Chemistry/Map%3A_Chemistry_-_The_Central_Science_(Brown_et_al.)/08._Basic_Concepts_of_Chemical_Bonding/8.8%3A_Strength_of_Covalent_Bonds

