DL3715 Y2
Molecular Reaction Dynamics: Applications to Triatomic systems
Introduction
In this lab, a triatomic system of collision was investigated assuming that the motions of atoms obeyed classical mechanics. The system was investigated with respect to different types of atoms, varying internuclear distances and internuclear momentum by monitoring the molecular dynamic trajectories using MATLAB. Also, the relationship between reaction efficiency and the position of the transition state was demonstrated by the Polanyi's empirical rules.
EXERCISE 1: H + H2 system
1.1 What value does the total gradient of the potential energy surface have at a minimum and at a transition structure? Briefly explain how minima and transition structures can be distinguished using the curvature of the potential energy surface.
The gradients (first derivative) of the potential energy surface at minimum and at a transition state are both zero. Minima and transition structures can be distinguished by the second derivative of the potential energy surface: at a minimum point, d^^2V/dR^^2>0; whereas at a transition state, d^^2V/dR^^2<0.
(This is not necessarily true, depending on your R coordinate. The transition state is the minimum along one axis but the maximum along another. Lt912 (talk) 04:08, 2 June 2017 (BST))
1.2 Report your best estimate of the transition state position (rts) and explain your reasoning illustrating it with a “Internuclear Distances vs Time” screenshot for a relevant trajectory.
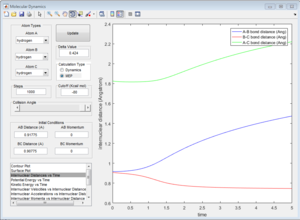
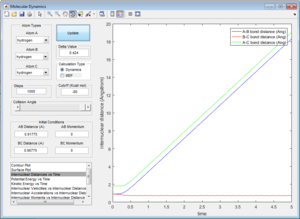
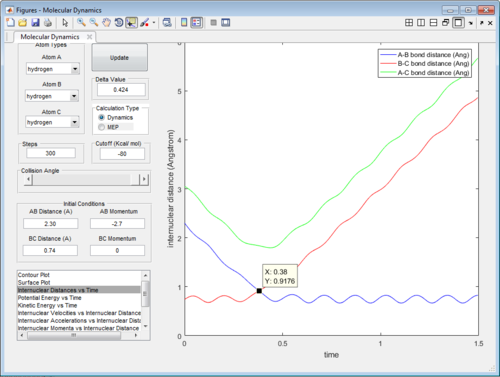
The transition state was found at t=0.38 from the internuclear distances vs time plot as shown below.
|
| Internuclear distances vs time (P1=-2.7,P2=0) |
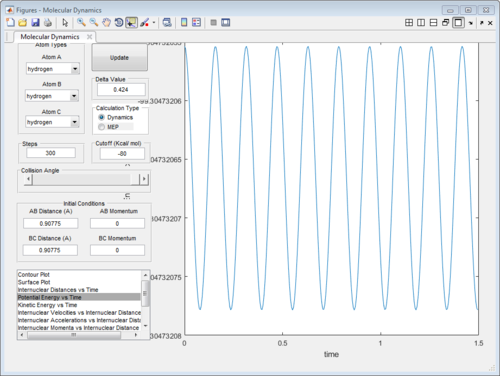
The internuclear distance was optimised to 0.90775A when bothe kinetic and potential energy start to oscillate as shown below.
 |
 |
| Oscillating potential energy at TS | Oscillating kinetic energy at TS |
At the transition state (r1=r2=0.90775), the distance between A-B and B-C will always be a constant as illustrated by the internuclear distances vs time plot at P1=P2=0 shown below:

|
| Internuclear distances vs time (P1=0,P2=0) |
1.3 Comment on how the mep and the trajectory you just calculated differ.
An initial condition was set as : r1=0.91775, r2=0.90775, p1=p2=0 for all plots.
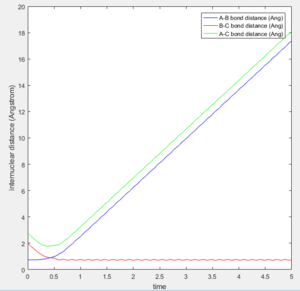
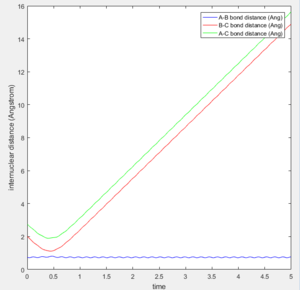
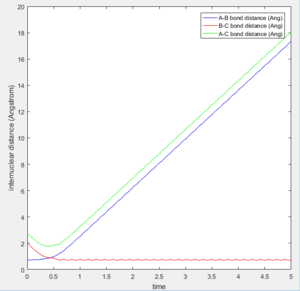
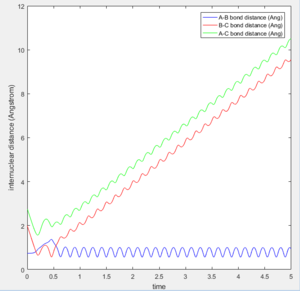
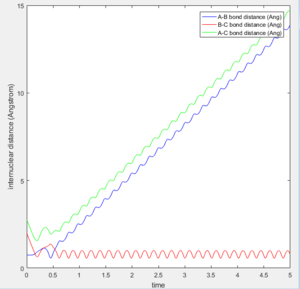
The initial position of r2 was set to deviate from the transitional state position by 0.1. Since A is closer to B than C does, the formation of bond between B-C is favoured over A-B as shown in both of the intermolecular distance vs time plot.
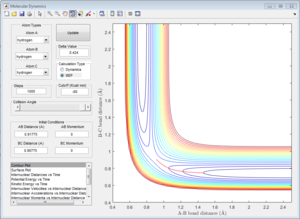
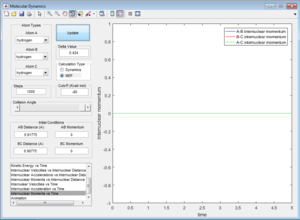
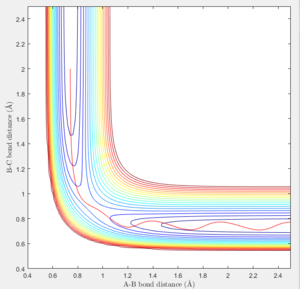
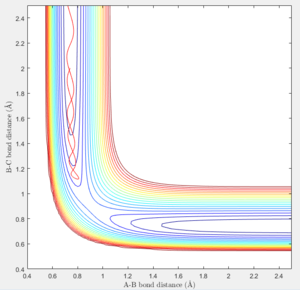
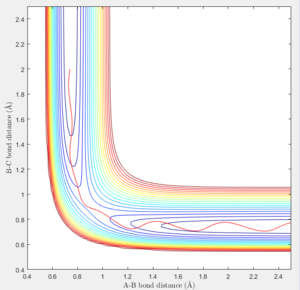
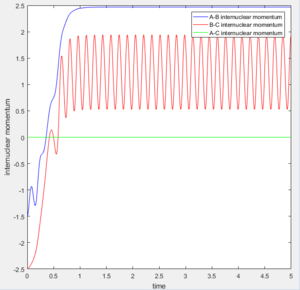
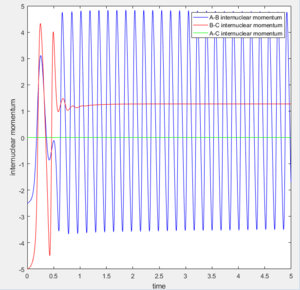
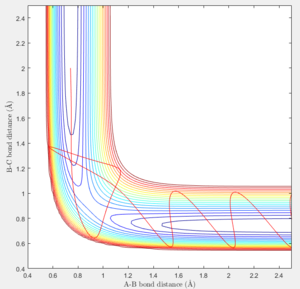
In MEP calculation, there is no internuclear momentum, ie. B-C will not vibrate over time as seen in the contour plot since it is taking the minimum energy at each time point in calculation.The momentum is zero even it is slightly off the transition state.
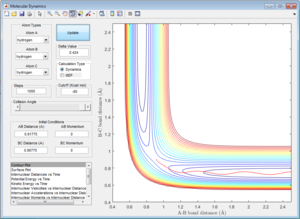
The trajectory getting from the Dynamics calculation is quite different from the MEP calculation. Dynamic calculation includes all the vibrating situation with the trajectories so when a proton is placed off the transition state, the motion is spontaneous whereas, in MEP, the motion will not take place.
Calculating the reaction path by using Trajectories from r1 = rts + δ r2 = rts
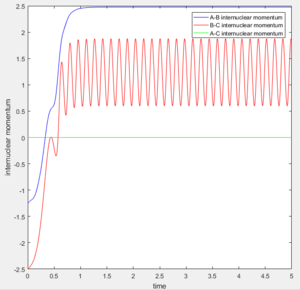
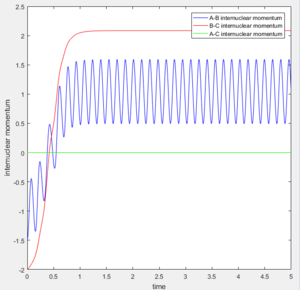
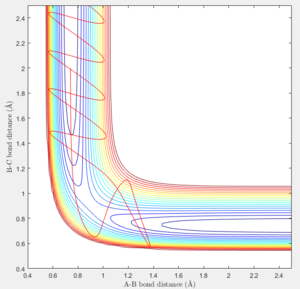
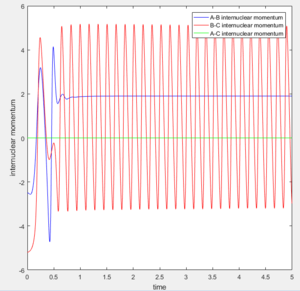
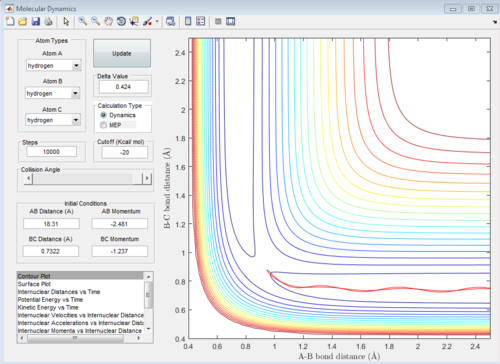
At large t (t=5): the intermolecular distance between A and B is 18.31 the intermolecular distance between B and C is 0.7322 the average intermolecular momentum between B and A is 2.481 the average intermolecular momentum between B and C is 1.237. When the final state becomes the initial state with inverse sign of momentum, the atoms were expected to be brought back together in the same path as before as shown in the following contour plot.
1.4 Complete the table by adding a column reporting if the trajectory is reactive or unreactive. For each set of initial conditions, provide a screenshot of the trajectory and a small description for what happens along the trajectory.
The 1st, 3rd and 5th group with Hc-Hb +Ha initial state are all reactive since they have sufficient energy to overcome the activation energy barrier. While the 2nd and 4th group don't form stable product as they don't have sufficient activation energy. Especially in the 4th group, the product was formed at a high vibration energy but it soon dissociated back to reactants at lower vibration energy.
1.5 State what are the main assumptions of Transition State Theory. Given the results you have obtained, how will Transition State Theory predictions for reaction rate values compare with experimental values?
Transition state theory states that once the system reaches a transition state configuration, the product must be formed. However, in our experimental data of the 4th group, the reactant reaches the transition state but reverses its path after a short while. This dissociation of the already formed product shows that the vibration direction for both reactants is still important. Every reaction has a kinetic energy and a activation barrier. The reaction can occur of the kinetics energy is greater than the activation barrier. However, if the kinetic energy i much larger than the activation energy, it can recross the transition state and cause the reaction to be unreactive. As a result, higher momentum does also give a reactive reaction.
( True, however transition state theory make more assumptions than this. How will prediction for reaction rate values compare with experimental values? Lt912 (talk) 17:42, 4 June 2017 (BST))
EXERCISE 2: F - H - H system
2.1 Classify the F + H2 and H + HF reactions according to their energetics (endothermic or exothermic). How does this relate to the bond strength of the chemical species involved?
Since H-F bond strength is much larger than H-H bond, the reaction from F+H2 to H+HF is exothermic (where a fluorine atom is approaching to H2 molecule, H-F bond formation is energetically favoured); whereas the reaction from H-F+H to H2+F is endothermic (where a proton is approaching H-F, H-F bond dissociation is energetically unfavoured) The first surface plot shows a fluorine atom approaching H2. The reaction proceeds from a higher energy state to a lower energy state so exothermic.
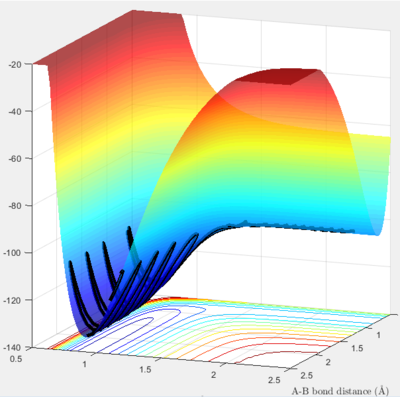
|
| surface plot of F + H2 |
The second surface plot shows a hydrogen atom approaching H-F. The reaction proceeds from a lower energy state to a higher energy state so endothermic.
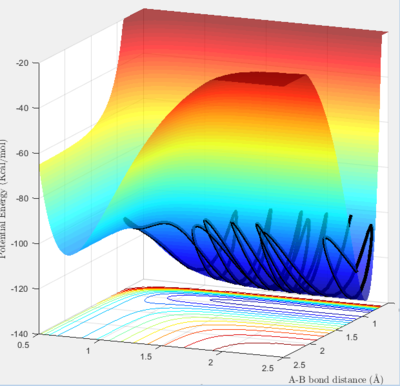
|
| surface plot of H + HF |
2.2 Locate the approximate position of the transition state.
The transition state was found at r1=1.8107 and r2=0.745 with initial momenta equals to zero.
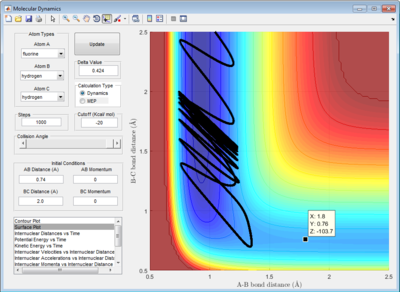
|
| transition state surface plot |
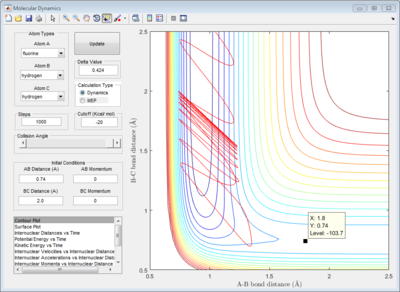
|
| transition state contour plot |
At transition state, the internuclear distances among all three atoms remain unchanged with time, ie. three atoms are all vibrating at its position.
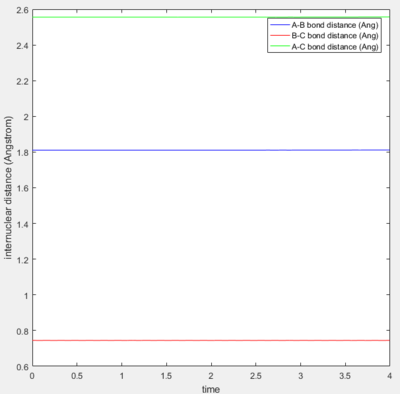
|
| internuclear distances at transition state |
2.3 Report the activation energy for both reactions.
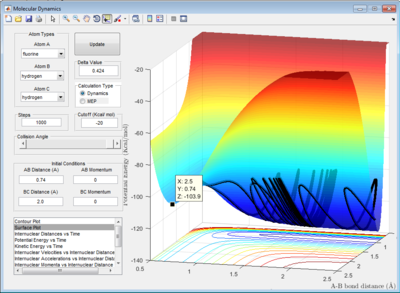
|
| minimum energy point at -103.3 Kcal/mol |
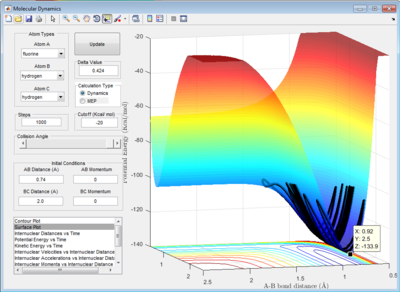
|
| minimum energy point at -133.9 Kcal/mol |
The activation energy is the energy difference between the minimum energy point and the transition state point. Therefore:
for energy barrier between the H-H bond and transition state:
the Ea could be calculated as Ea=-103.3-(-103.9)= 0.6 Kcal/mol
for energy barrier between the transition state and the H-F bond:
the Ea could be calculated as Ea=-103.3-(-133.9)= 30.6 Kcal/mol
2.4 In light of the fact that energy is conserved, discuss the mechanism of release of the reaction energy. How could this be confirmed experimentally?
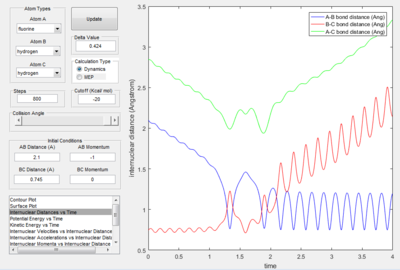
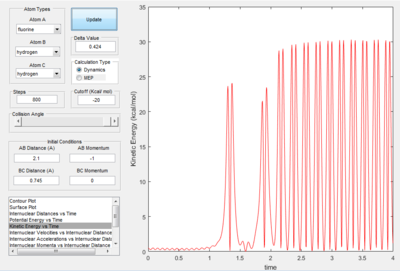
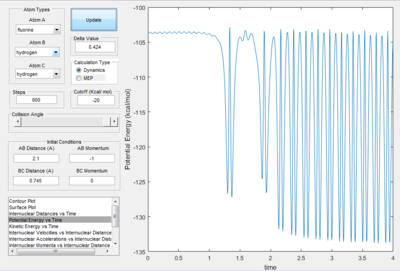
Reaction of F + H2 The reaction condition was set as : r(HF) =2.1å,momentum(HF) =-1 Ns r(HH) =0.745å, momentum(HF) =0 Ns The plots were shown in the following table.
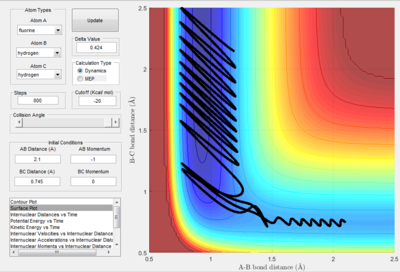 |
 |
 |
 |
| Potential energy surface | Internuclear distance vs time | Kinetics energy vs time | Potential energy vs time |
(You started your simulation here from very near to the transition state, rather than from the reactants (2.1 vs 2.5 AB distance). Lt912 (talk) 18:09, 4 June 2017 (BST))
The graphs suggested that the mechanism of this reaction can be divided into two steps:
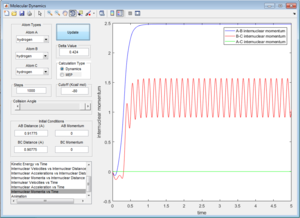
1. The fluorine atom is approaching the vibrating H2 molecule, shown as the oscillating momentum.
2. The fluorine collide with one of the hydrogen atom causing the dissociation of the H2 molecule, shown as the increasing momentum and internuclear distance of B-C. Then, the fluorine atom forms a bond with the hydrogen, shown as the oscillation of A-B internuclear momentum.
Since the energy is always conserved in the reaction, the energy is converting between kinetic energy and potential energy. The reaction is exothermic so the potential energy of the reactant is higher than that of the product. As a result, the kinetic energy is transformed into potential energy. At the beginning, the change in both energies are small because it was due to the relative small vibration of H2 molecule. The changes became more significant at 2.5s when the H-H bond dissociated and H-F started to form. This can be experimentally proved by the following two ways: 1. IR spectroscopy. The vibration frequencies of the H-H bond and H-F bond can be distinguished on the spectrum and the heat released was stored as the vibrational energy so can be calculated by E=hv. 2. Thermometer. The energy released can be calculated by Q=mcΔT, where Q is the thermal enegy released, m is the mass of the liquid, c is the specific capacity and ΔT is the change in temperature.
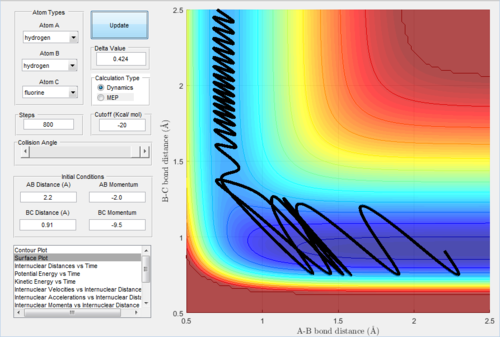
Reaction of H + HF The initial condition was set that the reactants have low kinetic energy: r(HH)=2.2 Å r(HF)=0.91 Å momentum(HH)=-2.2 kg m s-1 momentum(HF)=-2.0 kg m s-1 The reaction was unreactive as shown below:
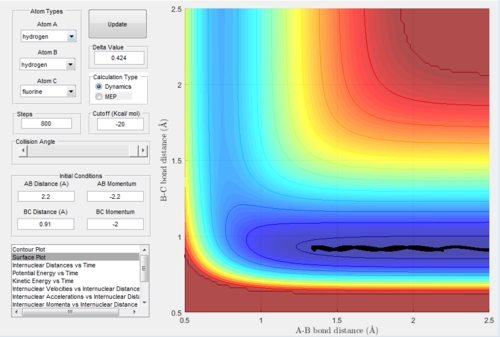
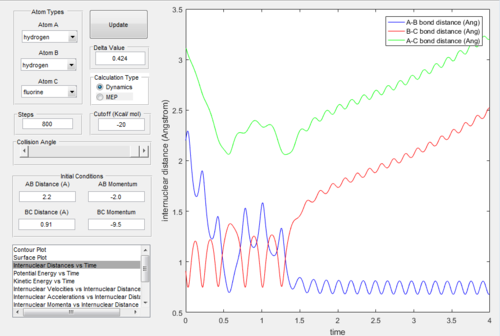
The, the momentum of the incoming hydrogen was changed slightly from -2.2 to -2.0; and the moment of H-F was significantly changed from -2.0 to -9.5. The reaction becomes reactive, as shown below.
The H-H bond formation was shown as the oscillation in the internuclear distance plot below.
(More detail here on how you would the equation to show you created a vibrationaly excited product would be useful. If you are only comparing the H-H and H-F bond spectra all you show is that you created H-F. To show you created vibrationally excited HF you would measure the shift in the HF spectrum itself, vs its ground state, or detect the emitted photons as it relaxes. Lt912 (talk) 18:10, 4 June 2017 (BST))
2.5 Discuss how the distribution of energy between different modes (translation and vibration) affect the efficiency of the reaction, and how this is influenced by the position of the transition state.
The reaction efficiency and transition state were related by the Polanyi's empirical rules. Polanyi's empirical rules state that vibrational energy is more efficient in promoting a late-barrier reaction than translational energy. In H + HF reaction, the reaction is endothermic so it has a late transition state. According to Polanyi's empirical rules, the vibrational energy would promote the reaction greater than the translational energy. Compared with the data used in 2.4, the reaction becomes reactive when it has a greater momentum (vibration energy) than the translational energy (-9.5 : -2.2). Therefore, the reaction trajectory obeys the Polanyi's empirical rules.
Conclusion
In the H + H2 system, the transition state was at 0.9175 Å. According to the Classical Transition State theory, all reactions with sufficient energy to overcome the activation barrier should proceed to product. However, in our experiment, reactions with too high energies recrossed the transition state which leads to a overall unreactive reaction. In the H-H-F system, two possible reactions behaved differently due to the different strength of bond formed, therefore, they have a different energy profile which related to the reaction efficiency. The H + HF reaction is endothermic with late transition state, as a result, vibrational energy promotes the reactive more effectively than translational energy.

