Cyn6217
Molecule modelling and Analysis
The profile of BH3 (Boron Hydride)
B3LYP/6-31G(d,p) level
 Item                     Value       Threshold  Converged?
 Maximum Force            0.000189     0.000450     YES
 RMS     Force            0.000095     0.000300     YES
 Maximum Displacement     0.000746     0.001800     YES
 RMS     Displacement     0.000373     0.001200     YES
Frequency analysis log file
Media:ZYL BH3 FREQ.LOG
Low frequencies ---   -0.2263   -0.1037   -0.0055   47.9770   49.0378   49.0383
Low frequencies --- 1163.7209 1213.6704 1213.6731
test molecule |
vibration              1                      2                      3
symmetry               A2"                    E'                     E'
Frequencies       1163.7209              1213.6704              1213.6731
IR Intensity       92.4742                14.0889                14.0925

vibration              4                      5                      6
symmetry               A1'                    E'                     E'
Frequencies       2579.7463              2712.6720              2712.6731
IR Inten             0.0000               126.4183               126.4087
IR spectrum
In the IR spectrum above, there were only 3 peaks shown while there are in total 6 vibration modes. It is because that 1. vibration 2 and 3, vibration 5 and 6 have same frequencies, so the peaks overlap with each other; 2. the vibration 4 is symmetrical, hence it is not IR active.
Well done for mentioning both reasons which result in only 3 visible peaks. The screenshot from the log file doesn't contain all the required information though and means that the numbers (frequency and intensity) are not to the right accuracy. To improve you should have reported the results properly. Smf115 (talk) 21:42, 15 May 2019 (BST)
MO diagram
Compared with the real MO diagrams, the LCAOS show consistent bonding and anti-bonding phases and similar extent of contribution of each AO to MO;
Therefore, the qualitative MO theory provides a proper superficial approximation of the shapes and charge distributions of MOs. However, the exact c constant values, energy and size of the MO still require further calculation with Schrodinger’s equation and optimization.
I think you've got a bit mistaken when assigning the MOs, the lowest energy orbital is a core orbital and shouldn't appear on the diagram and following from this the others are all incorrectly assigned. It might be worth having another look at the MOs to help your inorganic course and asking someone for some guidance if you still can't pair them up. Smf115 (talk) 21:47, 15 May 2019 (BST)
The profile of NH3 (Ammonia)
B3LYP/6-31G(d,p) level
         Item               Value     Threshold  Converged?
 Maximum Force            0.000092     0.000450     YES
 RMS     Force            0.000039     0.000300     YES
 Maximum Displacement     0.000304     0.001800     YES
 RMS     Displacement     0.000101     0.001200     YES
Frequency analysis log file
Low frequencies --- -32.4037  -32.3907  -11.4232   -0.0036    0.0075    0.0521
Low frequencies --- 1088.7639 1694.0249 1694.0253
test molecule |
The profile of NH3 BH3 (Ammonia Boron)
B3LYP/6-31G(d,p) level
         Item               Value     Threshold  Converged?
 Maximum Force            0.000241     0.000450     YES
 RMS     Force            0.000053     0.000300     YES
 Maximum Displacement     0.001381     0.001800     YES
 RMS     Displacement     0.000374     0.001200     YES
Frequency analysis log file
Media:ZYL NH3BH3 FREQ.LOG
Low frequencies ---   -0.2072   -0.0608   -0.0067   10.1080   16.5642   16.5733
Low frequencies ---  263.0162  631.3847  638.8686
test molecule |
The association energy of NH3 BH3 (Ammonia Boron)
After frequency analysis to calculate the minimum energy of ammonia, boron hybride and Ammonia Boron, the B-N association bond energy could be calculated with equation : association energy = E(NH3BH3)-(E(NH3)+E(BH3))) E(NH3)= -56.558 a.u. E(BH3)= -26.615 a.u. E(NH3BH3)= -83.225 a.u.
association energy = -(E(NH3BH3)-(E(NH3)+E(BH3))) = -0.052 a.u. = -136.5 kJ/mol
Bond energy is the energy absorbed to break a bond While association energy is ,in general, the energy emitted while two groups are associated,which might not as strong as the bond energy in this case. I compared B-N association energy with a stable B-N bond's energy (377.9 kJ/mol [1]). It can be said to be a weak bond so that the bond could be easily dissociate.
Nice to see a sensible and referenced literature value used for comparison! However, the discussion could be a bit clearer, particularly when trying to define the association energy. Smf115 (talk) 22:09, 15 May 2019 (BST)
"heavy molecule" NI3
B3LYP/6-31G(d,p) level & psuedo-potentials
        Item               Value     Threshold  Converged?
 Maximum Force            0.000063     0.000450     YES
 RMS     Force            0.000038     0.000300     YES
 Maximum Displacement     0.000478     0.001800     YES
 RMS     Displacement     0.000273     0.001200     YES
Frequency analysis log file Media:NI3 freq.log
Low frequencies ---  -12.7349  -12.7287   -6.2860   -0.0040    0.0188    0.0634
Low frequencies ---   101.0320  101.0328  147.4112
test molecule |
optimised N-I distance is 2.18363 a.u.
Your structures are all correct and are all the correct symmetries which is good detail Smf115 (talk) 21:54, 15 May 2019 (BST)
Ionic Liquids: Designer Solvents
In this section, the charge distribution of two cations used in the ionic liquid was investigated. As a room-temperature liquid composed purely of ions, the ions are required to be charge-delocalized.
The profile of [P(CH3)4]+
        Item               Value     Threshold  Converged?
 Maximum Force            0.000287     0.000450     YES
 RMS     Force            0.000096     0.000300     YES
 Maximum Displacement     0.001365     0.001800     YES
 RMS     Displacement     0.000678     0.001200     YES
Frequency analysis log file Media:ZYL -N(CH3)4-+FREOUTPUT.LOG
Low frequencies ---    0.0028    0.0031    0.0037   50.3282   50.3282   50.3282
Low frequencies ---  185.6971  210.7678  210.7678
test molecule |
Good inclusion of the charge for both ILs and your log files show the correct frequency calculations. However, I think you've got a bit mistaken when presenting the information for the structure, here the low frequencies and convergence table are actually for NMe4(the PMe4 ones are below) and your summary table is for NH3. Smf115 (talk) 17:32, 19 May 2019 (BST)
The profile of [N(CH3)4]+
          Item               Value     Threshold  Converged?
 Maximum Force            0.000066     0.000450     YES
 RMS     Force            0.000039     0.000300     YES
 Maximum Displacement     0.000887     0.001800     YES
 RMS     Displacement     0.000433     0.001200     YES
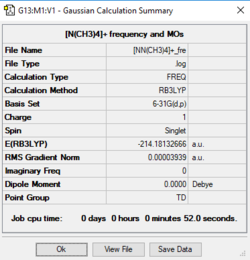
Frequency analysis log file Media:-NN(CH3)4-+ FRE.LOG
Low frequencies ---   -0.0004    0.0003    0.0003   34.6230   34.6230   34.6230
Low frequencies ---  216.8782  316.1696  316.1696
test molecule |
charge distribution
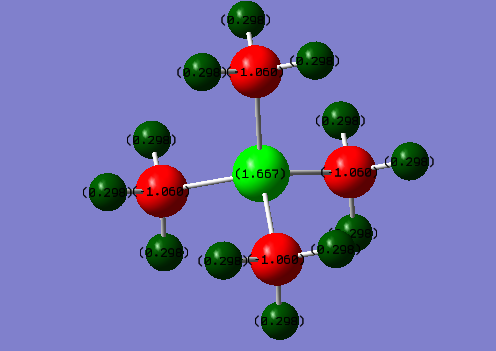
The charge distribution of cation P(CH3)4+
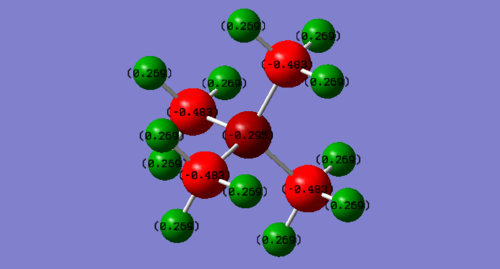
The charge distribution of cation N(CH3)4+
	N(CH3)4+	P(CH3)4+
H	0.269	        0.296
C       -0.483	       -1.060
N/P	-0.295	        1.667
Overall, both cations carries +1 charge.
For P(CH3)4+ cation, P atom carries most of the positive charge (1.667). Meanwhile, all the carbon atoms have equally positive charge 1.060 and hydrogen atoms also shares identical +0.298 charge. The distribution of the positive charge is evenly descending from the central atom P. This distribution is generally consistent with the relative electronegativity of P, C and H : P < H < C. P was with the lowest electronegativity, it has weak ability to attract electron ,therefore, it carries the largest positive charge. In addition, the effective nuclear charge could also influence the positive charge carried by each atom. P have the largest positive charge can also due to its large nuclear charge (+15). The low positive charge of H can probably be justified since its effective nuclear charge was originally small.
For N(CH3)4+ cation, conversely N carries negative charge (-0.295) while Cs also have negative charge: -0.483. All the positive charge was evenly distributed among Hs (0.269). In summary, the charge was increasing from the central ion to the Hs. This can be justified by the relative electronegativity of N,C and H: N > C > H because more electronegative atom trends to attract electron density, making its partial charge more negative. This is corresponding to the MO diagram in the MO diagram, the energy level of more electronegative element is relatively lower and more available for electrons to occupy. The negative charge n C is higher than N probably because the occupied MOs were with energy level which is closer to the C atom’s energy level, therefore C AOs have larger contribution to the MOs, more electron density is closer to C.
These data was contradict to the communal traditional description of the formal charge location on N(CH3)4+ since it was N carries all the positive formal charge instead of all the Hs.
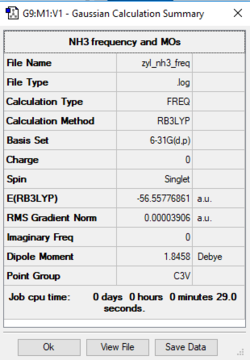
Correct calculation of the NBO charges for both of the ILs and good use of comparative electronegativities to justify the observed charges. To improve, you should have presented the charge across both ILs using the same colour range to make the diagrams comparable. Overall, you've raised some different ideas showing that you've thought about the discussion but they aren't quite correct. For example, the effective nuclear charge is the charge felt by a certain electron from a nucleus given the screening effect of the surrounding electrons and +15 is instead the P atomic charge, so this argument is a bit confused and not valid. You were also expected to explain why real charges deviate from the traditional picture of the formal charge being located on the N. Smf115 (talk) 18:02, 19 May 2019 (BST)
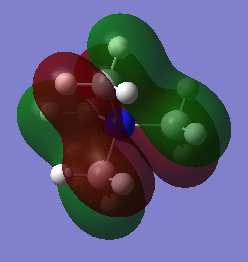
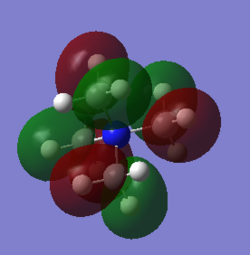
Visualisation of valence MOs of N(CH3)4+
In this section, the MOs of this cation was vistualised with gaussian after frequency anaylsis. Overall, the bonding character dominate the filled orbitals when some anti-bonding between space etc. could be observed in several orbitals.
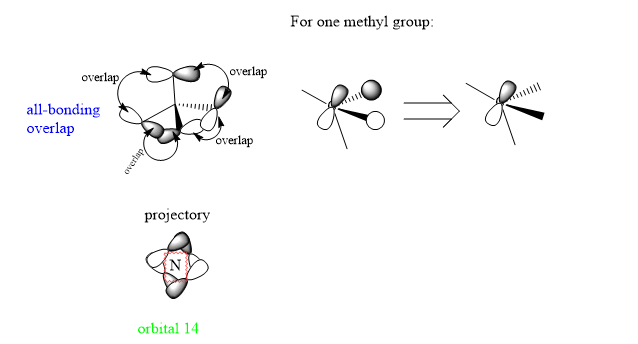
1.Orbital 14
This orbital is with all bonding interactions between AOs. It is a MO consists of p orbital of Cs and 2 s orbitals on Hs. All the orbitals overlap with the same phase as itself.
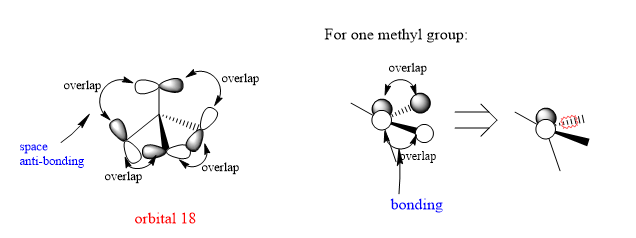
2.Orbital 18
There is anti-bonding through space between the neighbouring p orbitals which will higher the energy and destabilized the overall structure. Meanwhile, in the methyl group, there's bonding overlap between s orbitals and the p orbtial which lies in the same plane with them.
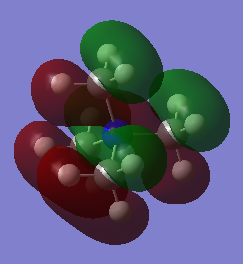
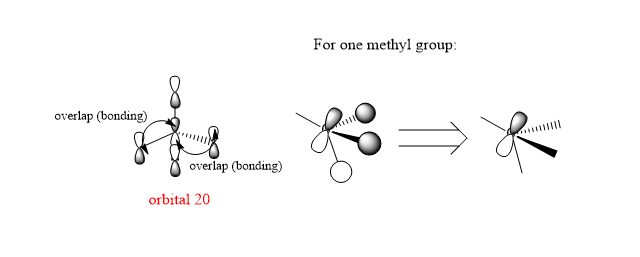
3.Orbital 20
This orbital mainly shows bonding character since all the p orbitals overlap with each other in a parallel orientation and the overlap areas are with the same phase. In the methyl group, the bonding character dominates as well.
Decent range of MOs chosen and a good attempt at considering the overall bonding/antibonding nature of the MO. The FOs are all correct but are let down by the diagrams which aren't always clear. In particular, the FO for MO 18 looks more like it uses a combination of just s orbitals and without your initial introduction to the MO it would be very unclear. The 'projectory' image for MO 14 is also confusing and doesn't add anything to your analysis. Smf115 (talk) 21:57, 20 May 2019 (BST)
Overall, a good report with good structure calculations. Smf115 (talk) 21:59, 20 May 2019 (BST)
Reference
1. Unkonwn Author Staff.ustc.edu.cn. (2019). [online] Available at: http://staff.ustc.edu.cn/~luo971/2010-91-CRC-BDEs-Tables.pdf [Accessed 10 May 2019].


