Complab sbs17
1) On a potential energy surface diagram, how is the transition state mathematically defined? How can the transition state be identified, and how can it be distinguished from a local minimum of the potential energy surface?
On a potential energy surface, the transition state is the maximum on the minimum energy path linking reactants and products, making it a saddle point. At this point, the gradient of the potential is zero:
Additionally, at the saddle point, there are 3N - 6 vibrational degrees of freedom (where N is the number of atoms involved in the reaction). One of these is equivalent to an infinitesimal motion along the reaction path, but the rest of these correspond to the vibrational motion positioned orthogonally to the reaction path.1 For a simple system consisting of three identical atoms positioned in a linear fashion, two orthogonal internal degrees of freedom exists.2 These are defined as follows:
At the saddle point, which possesses a symmetric configuration, the following conditions apply:3 , where r0 is the saddle point position.
As such, the saddle point, corresponds to a maximum on the reaction path potential and a minimum on the potential orthogonal to the reaction coordinate, . Therefore the saddle point must satisfy the two following conditions:4
and
Good answer. Mak214 (talk) 15:14, 13 May 2019 (BST)
2) Report your best estimate of the transition state position (rts) and explain your reasoning illustrating it with a “Internuclear Distances vs Time” plot for a relevant trajectory.
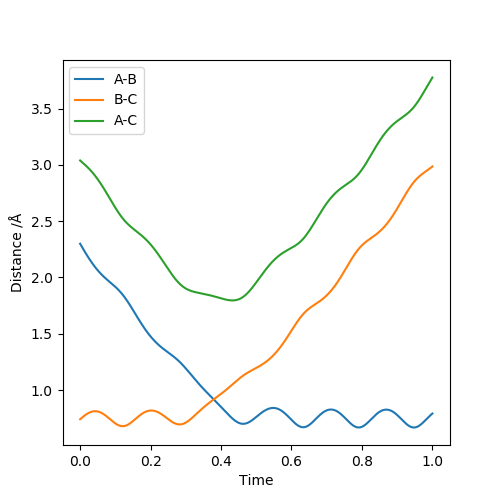
The reaction H2 + H → H + H2 was considered. The bond length of H2 was set to be 0.74 Å, and the third H atom set to be at a distance of 2.30 Å from the H2 molecule, with a momentum of 2.70 (to indicate that the atom is approaching H2, this value was set to be negative in LEPS GUI). The single atom approaching H2 is designated A, and the atoms in the initial H2 molecule are designated B and C. The distance between atom A and B is shown as r1 and the distance between B and C is shown as r2.
The transition state position of the reaction under these conditions is found at rts=0.9126, which is the point where r1=r2, that is to say where the distance between atom A and B, and B and C are equal (see Figure 1). The molecules do not vibrate at this point.
OK. Note that you can find the transition state distances even more accurately than this by setting the momentum of both AB and BC to 0, encouraging the reaction to get stuck in the transition state configuration. Mak214 (talk) 15:15, 13 May 2019 (BST)
3) Comment on how the mep and the trajectory you just calculated differ.
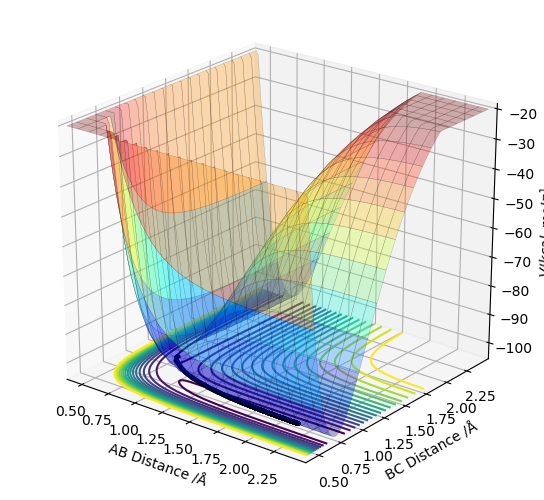
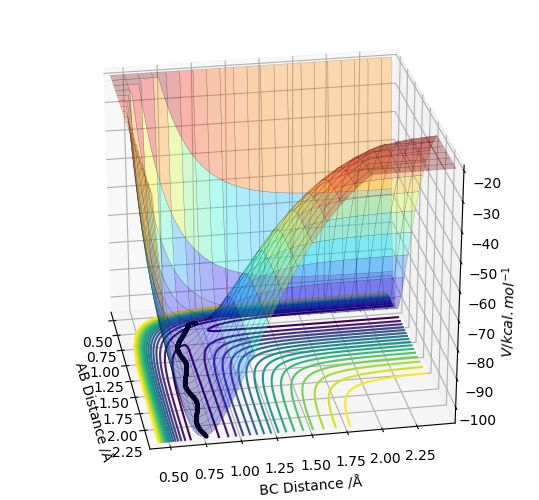
The minimum energy path, "mep", corresponds to a trajectory of the reaction at infinitely slow motion. The "mep" can be found by running a trajectory wherein the system is slightly displaced from the transition state and experiences zero initial momentum. The resulting trajectory follows the valley floor of the potential energy surface of the reaction (see Figure 2). However, the "mep" does not allow for a realistic view of how the atoms move throughout the reaction, as it does not account for the vibration of the H2 molecule.
This does not explain why the two calculations MEP and Dynamics have given you a different plot. The reason that you see the oscillating behaviour for the dynamics simulation is because the calculation remembers how much momentum the particles have after each timestep, meaning that if they reach a minimum stationary point on the PES they may still rise back out of this if they had some momentum. However for the MEP the residual momentum is reset to 0 after each timestep, meaning that once a stationary point is reached there is no force to move the particles. Mak214 Mak214 (talk) 15:19, 13 May 2019 (BST)
These need to be labelled Mak214 (talk) 15:21, 13 May 2019 (BST)
4) Complete the table above by adding the total energy, whether the trajectory is reactive or unreactive, and provide a plot of the trajectory and a small description for what happens along the trajectory. What can you conclude from the table?
The initial positions were set to be r1=|BC|=0.74 and r2=|AB|=2.0
| p1 | p2 | Etot | Reactive? | Description of the dynamics |
|---|---|---|---|---|
| -1.25 | -2.5 | -99.12 | Yes | H atom A approches the unvibrating BC H2 molecule. The transition state is reached at t=0.427 at rts=0.902 |
| -1.5 | -2.0 | -100.46 | No | H atom A approches the vibrating BC H2 molecule, but no reaction occurs. |
| -1.5 | -2.5 | -98.96 | Yes | H atom A approaches slightly vibrating BC H2 molecule. The transition state is reached t=0.427 at rts=0.895 |
| -2.5 | -5.0 | -84.96 | No | H atom A approaches the vibrating BC H2 molecule. A reaction occurs to form the AB H2 molecule, with a transition state at t=0.163 at rts=0.819. However, due to the vibration of AB, this molecule hits atom C to form the initial molecules. The transition state for this is reached t=0.542 at rts=1.077 |
| -2.5 | -5.2 | -83.42 | Yes | H atom A approaches the vibrating BC H2 molecule. A reaction occurs to form the AB H2 molecule, with a transition state at t=0.157 at rts=0.814. However, due to the vibration of AB, this molecule hits atom C to form the initial molecules. The vibrating BC molecule hits atom A again to form H2 molecule A. The transition state for this is reached at t=0.533 at rts=1.076. |


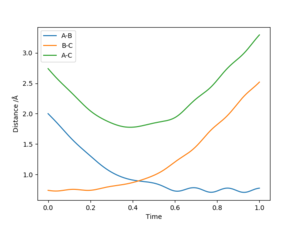
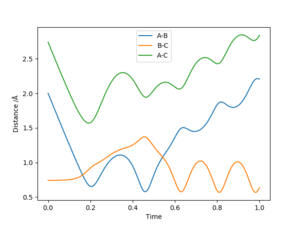
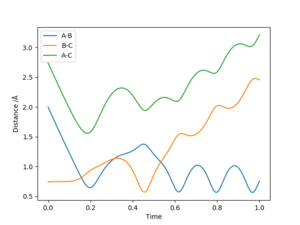
As can be seen by the results found in the table, whether a reaction occurs is dependent not only on whether the energy of the collision exceeds the activation energy barrier, but also whether this collision collides in the correct relative orientation. As such, a collision meeting the energy requirements for a reaction between an atom and vibrating molecule with a certain vibration momentum might lead to a reaction, while a collision between an atom and a vibrating molecule with a different vibration momentum might not.
Yes, although I think "orientation" is not relevant here as you are studying a triatomic system colliding at 180 degrees every time Mak214 (talk) 15:33, 13 May 2019 (BST)
5) State what are the main assumptions of Transition State Theory. Given the results you have obtained, how will Transition State Theory predictions for reaction rate values compare with experimental values?
The three main assumptions of Transition State Theory as devised by Eyring are as follows:5 1) If a molecular system has crossed the transition state in the direction of the products, it is not possible for the system to recross that point and reform the reactants again. 2) At the point of the transition state, motion along the reaction coordinate can be treated as a classical translation. 3) Transition states in the direction of the products are distributed among their states according to Maxwell-Boltzmann laws. This is irrespective of whether an equilibrium exists between reactant and products.
The experimental rate of reaction of a bimolecular reaction is given by: Where [A] is the concentration of reactant A, and [B] the concentration of reactant B, k the rate constant. The rate constant, k, can be found given the following equation6:
This does not answer the second part of the question. Look again at your trajectories above, think about the experimental rate of your 5th trajectory, will this be the same as that predicted by TST? Why, why not? Mak214 (talk) 15:33, 13 May 2019 (BST)
6) By inspecting the potential energy surfaces, classify the F + H2 and H + HF reactions according to their energetics (endothermic or exothermic). How does this relate to the bond strength of the chemical species involved?
First, the reaction F + H2 → HF + H was analysed. F was set to be atom A, and H2 was set to be atom B and C. The distance between A and B was set to be 2.30 and the distance between B and C was set to be 0.74. The AB momentum was set to be -11.1 while the BC momentum was set to be 0. A surface plot was found using LEPS GUI.
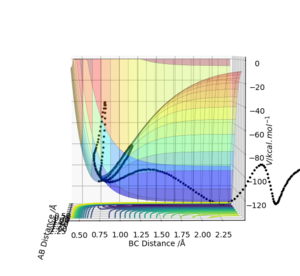
As can be seen from the surface plot above above, the reaction is exothermic.
The second reaction HF + H → F + H2 was analysed. H was set to be atom A, and HF was set to be atom B and C. The distance between A and B was set to be 2.30 and the distance between B and C was set to be 0.925, which is the literature value for the HF bond length.7 The AB momentum was set to be -9 while the BC momentum was set to be 0. A surface plot was found using LEPS GUI.
By inspecting the potential energy surface of reaction 2, it can be seen that it the reaction is endothermic.

The fact that reaction 1, which involves the formation of HF is exothermic while reaction 2, which involves the breaking of the HF bond, is endothermic can be made sense of when considering the bond strength of HF. HF is a very strong bond, and as such, the fact that energy is released during its formation is not surprising. Conversably, a significant amount of energy must be applied to the system to break the HF bond.
Nice answer. Mak214 (talk) 15:33, 13 May 2019 (BST)
7) Locate the approximate position of the transition state.
Reaction 1: t=0.34, rts=1.248. The transition state is located at the third crossover point between |AB| and |BC| (see figure below).
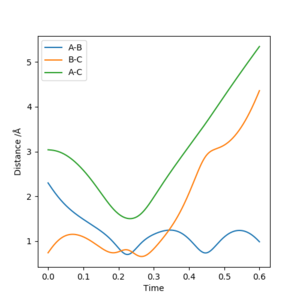
Reaction 2: t=0.24, rts=1.14. The transition state is located at the second crossover point between |AB| and |BC| (see figure below).

These figures are the same? The transition state for these reactions cannot be defined by only one bond length rts because you have two different bonds, HF and HH! Needs more thought and discussion. Mak214 (talk) 16:48, 13 May 2019 (BST)
8) Report the activation energy for both reactions.
Reaction 1: The activation energy was retrieved by performing a MEP calculation from a structure close to the transition state. As such, the AB distance was set to be 1.258, and the BC distance to be 1.248. Both the momentums were set to be 0. The energy for this trajectory is a decent estimate for the activation energy of the reaction. This was found to be -99.476.
Reaction 2: The activation energy was retrieved by performing a MEP calculation from a structure close to the transition state. As such, the AB distance was set to be 1.15, and the BC distance to be 1.14. Both the momentums were set to be 0. The energy for this trajectory is a decent estimate for the activation energy of the reaction. This was found to be -114.064.
The energy you are quoting is that of the transition state, now compare this to the energy for the reactants (i.e. BC with A very far away) for both cases to get the activation energy. Mak214 (talk) 15:33, 13 May 2019 (BST)
9) In light of the fact that energy is conserved, discuss the mechanism of release of the reaction energy. Explain how this could be confirmed experimentally.
10) Discuss how the distribution of energy between different modes (translation and vibration) affect the efficiency of the reaction, and how this is influenced by the position of the transition state.
No answer for last two questions, report not complete Mak214 (talk) 16:48, 13 May 2019 (BST)
References
1. Steinfeld J, Francisco J, Hase W. Chemical kinetics and dynamics. Upper Saddle River, N.J.: Prentice Hall; 1999.
2. Steinfeld J, Francisco J, Hase W. Chemical kinetics and dynamics. Upper Saddle River, N.J.: Prentice Hall; 1999.
3. Steinfeld J, Francisco J, Hase W. Chemical kinetics and dynamics. Upper Saddle River, N.J.: Prentice Hall; 1999.
4. Steinfeld J, Francisco J, Hase W. Chemical kinetics and dynamics. Upper Saddle River, N.J.: Prentice Hall; 1999.
5. Steinfeld J, Francisco J, Hase W. Chemical kinetics and dynamics. Upper Saddle River, N.J.: Prentice Hall; 1999.
6. Steinfeld J, Francisco J, Hase W. Chemical kinetics and dynamics. Upper Saddle River, N.J.: Prentice Hall; 1999.
7. Liu R, Francisco J. AbInitioStudy of the Mechanism for the Reaction of CF2Radicals with OH. The Journal of Physical Chemistry A. 1998;102(48):9869-9875.
Check info on how to edit your Wiki. An issue with references and no subheaders on this page. Figures are not labelled although sometimes they are referred to as "figure x" in the text. Mak214 (talk) 15:14, 13 May 2019 (BST)

