Complab2:zeya1989
The following is a report on Module 2 of the 3rd Year Computational Lab compiled by Zeya Rao.
Module Introduction
The content of this module focuses on the study of computational inorganic chemistry, comprising analysis of BH3, BCl3, Cis-/Trans- isomers of Mo(CO)4Cl2, and an insight into computational research on the 'fuel of the future' - Ammonia borane (NH3BH3). All calculations in this module were carried out on Gaussian 09W and then visualised in GaussView 3.0 and/or GaussView 5.0.
General Note on Accuracy and Convention
- total energies are reported in atomic unit of Hartree (E'h').
- relative energies are reported in KJ/mol, and are only valid for systems with identical number and type of atoms.
- the energy calculate has an error of ≈ 10 kJ/mol, which is equivalent of 0.00381 Hartree(1Eh = 2625.5 kJ/mol)
- the dipole moment is accurate to about 2 decimal places, ie 0.01 Debye.
- frequencies in wavenumbers are by convention reported to the nearest whole integer with stematic error of around 10%.
- intensities are reported with no dedimal places by convention although accuracy is much less than this.
- bond distances are accurate to ≈ 0.01 Å
- bond angles are accurate to ≈ 0.1°
Analysis of a Molecule of BH3
Optimisation of the Geometry
A BH3 molecule was prepared in GuassView 5.0 and the B-H bond lengths were defined manually to be 1.5 Å. The geometry optimisation was carried out on the local computer using Gaussian 09w, since the molecule is small and the calcuation criteria is simple, involving DFT (Density Function Theory) B3LYP method, and 3-21G basis set:
# opt b3lyp/3-21g geom=connectivity

BH3 Optimisation

0 1
- Output log: AZR07_BH3_OPT.LOG
- Calculation summary: AZR07_BH3_OPT_SUM.txt
The optimised molecule displays the B-H bond length at 1.19(435)Å and the HBH bond angle at 120.0°. To confirm that the calculation has indeed converged, check the information below "Item" in the log file. In this case all the forces and displacements criteria have converged, and the optimisation was properly executed in Gaussian.
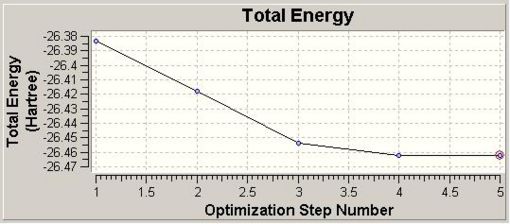
Upon optmisation (in 5 steps), Gaussview provides the both the Total Energy curve (Fig. 1.1.1) and RMS (Root Mean Square Gradient) graph (Fig. 1.1.2).
 |
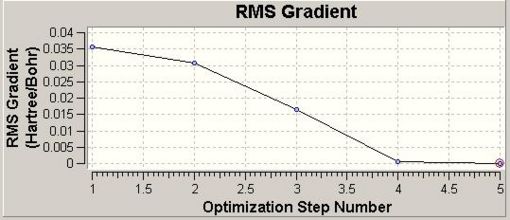 |
The Total Energy curve shows the Gaussian traversing the PES of BH3 and finding the minimum energy structure at -26.46 a.u. As each geometry is optimised the energy gap between successive optimisations reduces, hence the RMS Gradient graph shows the gradient approaching 0. When the gradient is within a specific limit to 0 the calculation is complete.
Calculation of the Molecular and Natural Bond Orbitals
Molecular Orbitals of BH33
Using the .chk (checkpoint) file from the gemometry optimisation, a new Gaussian input file was prepared by adding the keywords "pop=full)for the NBO analysis of BH3. Below is the details of calculation:
# b3lyp/3-21g pop=(nbo,full) geom=connectivity

BH3 MO analysis

0 1
- Output log: AZR07_BH3_POP.LOG
- Results summary: AZR07_BH3_POP_SUM.txt
The MOs can be visualised via the .chk file from the calculation and the lowest energy MOs of BH3 are calculated up to the eighth highest in energy. The illustrations are captured and displayed below (Fig. 1.1.3a-h):
These calcuations of the MOs are in good agreement with the predictions of MO theory, using the LCAO approach. The MO diagram of BH3 is illustrated below (Fig. 1.1.4) where the MO from Gaussview are placed next to the LCAO MOs for clear comparison and indeed, a very good resemblence is seen.
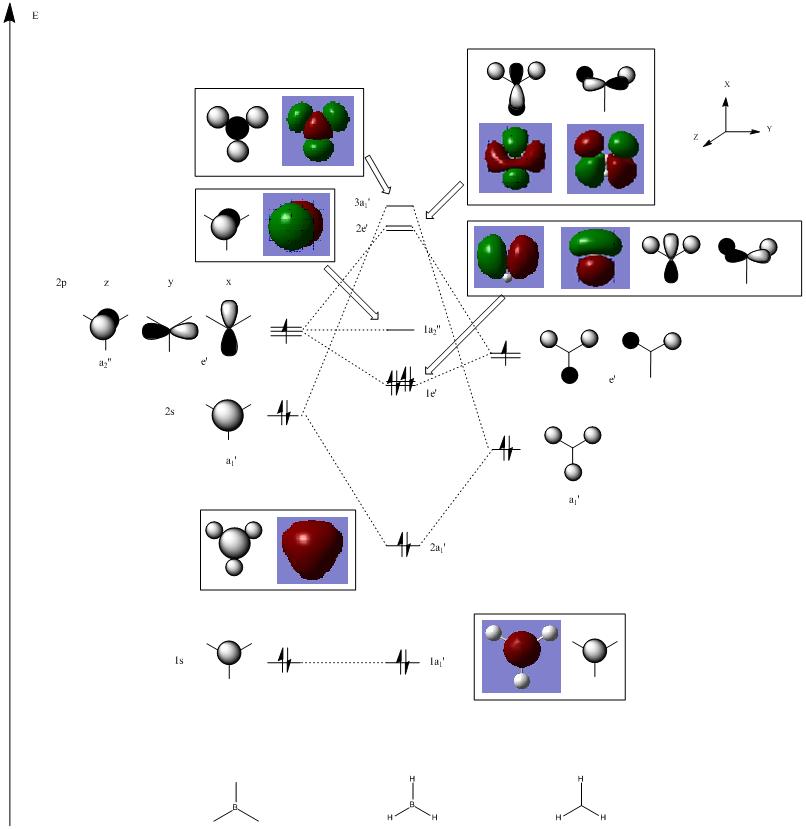
Upon comparing the computed MOs with those from the LCAO approach, it can be inferred that the Gaussian method used (B3LYP, 3-21G)not only provide MOs that agree well with teh LCAO, but also provide more details on the blending and shapes (and deformations if any) of the ortibals in 3D. For HOMO-3, HOMO-2 and LUMO, LUMO+3, both sets of orbitals gave good descriptions of the MOs. For HOMO however, one can see that the LCAO is inferior in the sense that it did not approximate how the blending or orbitals would affect the size of the MOs. For LUMO+1 and LUMO+2, it is apparent that the computed MOs provided far more details than the LCAO, both regarding the blending across the molcule and also the resulting repulsions that arise from the MOs.
Natural Bond Orbital Analysis of BH3
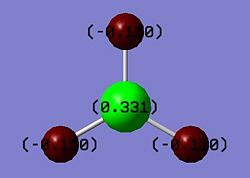
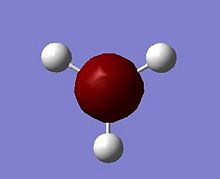
From the NBO output the charge distribution can be visualised and examined on Gaussview, where the atoms of BH3 are coloured according to the assignment of a spectrum coordinated to the degree of positive/negative charges of the atom relative to each other (Fig. 1.1.5). The numerical values of these charges can also be displayed and read 0.331 for B atom and -0.110 for H atoms.
The NBO analysis gives much more information than the charge distribution, for example the orbital contribution of each atom to form each bond. Such information can be found in the "Natural Population" section in the BH3 log file (AZR07_BH3_NBO.txt).
Under the "Bond orbital/Coefficients/Hybrids" section which describes the bonding in the molecule, it can be found that for each B-H bond, 55.52% of the elcectron density comes from the H atom, while 44.48% comes from the B atom. Furthermore, one can see that the B orbitals have a hybridisation of 33.33% sAO and 66.67% pAO. Thus B has formed 3 sp2 hybridised orbitals which each interact with the sAO of the H atom.
It can also be seen that orbital 4 is the core (CR) 1sAO of the B atom with 100% coefficient.
In order to consider the "empty" pAO that is orthogonal to the plane of the molecule, the LUMO (also the lowest energy orbital) is studied from the "Natural Bond Orbitals (Summary)" section, where it can be seen that orbital 8 is the one with a low occupancy and the lowest energy. In fact orbital 8 is the only unoccupied orbital with a negative energy (-0.045), which is unusual for its kind, as normally unoccupied orbitals have postive energies. Thus it can be inferred that BH3 has Lewis acid character, as it is happy to accept electron density into low lying empty orbital. Further probing into orbital 8 confirms that the 2pzAO is indeed unoccupied, as expected, while the 2ps and 2py are only partially occupied.
In the "Second Order Perturbation Theory Analysis of Fock Matrix in NBO Basis" section, where it outlines the interactions between the variuos MOs (e.g. mixing), one can see that there is no second order interactions in the case of BH3, as the energies of the E(2) column are too small to cause any suspicions (1.51 kcal/mol cf. 20.0 kcal/mol as a reference point).
Calculation of the Vibrations
In order to carry out a Frequency analysis, the log file of the Optimisation calculation was prepared to be submitted to Gaussian. Again, the method has to be consistent as before, so DFT B3LYP and 3-21G were used:
# freq b3lyp/3-21g geom=connectivity pop=(full,nbo)

BH3 frequency analysis

0 1
- Output log: AZR07_BH3_FREQ.LOG
- Summary: AZR07_BH3_FREQ_SUM.txt
From the results file one can see that the frequency test was the right calculation as the total energy remained the same as for the optimised struture. It has also been noted that BH3 belongs to the D3h point group. 6 vibrations are determined in this calculation, and each one has a symmetry associated to the point group of the molecule.
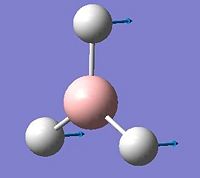
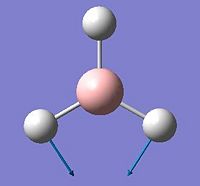
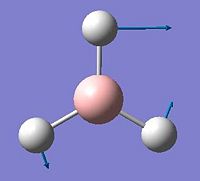
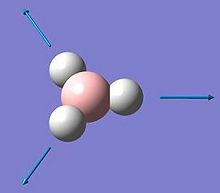
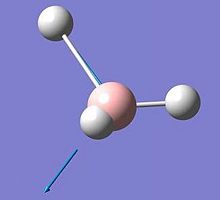
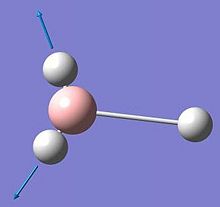
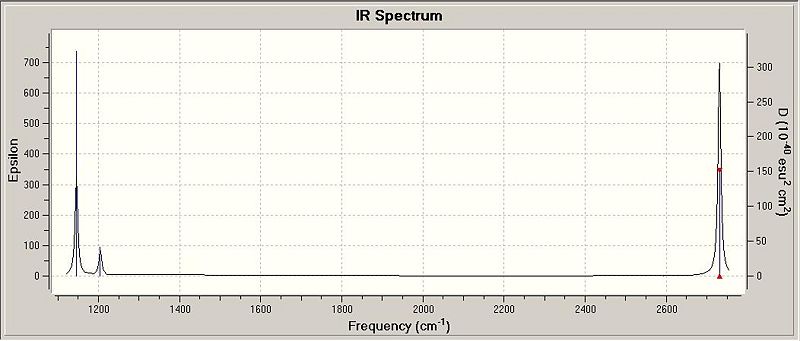
From the tabulated data above, it can be seen that there are 6 vibrations in the BH3 molecule, thus one would expect to find 6 peaks on the coordinated IR spectrum. However, this is apparently not the case, as can be seen in Fig. 1.1.5, where only 3 peaks are observed at 1145, 1204 and 2731 cm-1. The expected peak at 2593cm-1 is not observed since the A1' vibration is completely centriosymmetric, and therefore does not have any changes in the overall dipole moment of the molecule, and hence an IR intensity of 0. The other 5 vibrations are all IR-allowed, however only 3 peaks are seen because there are 2 sets of doubly degenerate vibrations at 1205 and 2737 cm-1.
Analysis of a Molecule of BCl3
Optimization of the Geometry
BCl3 was prepared in GuassView and the B-Cl bond length was defined at 1.87 Å. The symmetry of the molecule was fixed with very tight tolerance (0.0001) to D3h point group. The method used this time is different to before, a pseudo-potential basis set was used in this calculation,DFT-B3LYP/LanL2MB:
# opt b3lyp/lanl2mb geom=connectivity

BCl3 optimisation

0 1
- Output log: AZR07_BCL3_OPT.LOG
- Results summary:Nm607_BCl3_opt_results_summary.txt
The B-Cl bond lengths, post-optimization, were all 1.86(592) Å, and all H-B-H bond angles were 120.0° as would be expected from the restricted symmetry.
Calculation of the Vibrations
The frequency analysis was completed via the log file from the optimisation calculation. No additional keywords were necessary and the purpose of this frequency test was to confirm that the optimised strucutre was indeed a minimum - if all the frequencies are postive in value, which is indeed the case. The calculation executed used DFT-B3LYP/LanL2MB:
# freq b3lyp/lanl2mb geom=connectivity

BCl3 frequency analysis

0 1
- Output log: AZR07_BCl3_FREQ_LOG
- Results summary: AZR07_BCl3_FREQ_SUM.txt
Anologue to the BH3, 6 vibrations (214, 214, 377, 417, 939 and 939 cm-1) are observed for BCl3 which also have the same symmetry element as BH3. Also, all these frequencies are positive therefore proving that the structure we have optmised is indeed a minimum, rather than a transition state.
Answers to Questions on BCl3
The method and basis set used for both the geometry optimisation and the frequency analysis were DFT B3LYP/LanL2MB as instructed. The basis set needs to be consistent through a series of calculations in order to ensure the results are valid and sensible. If the first calculation employed a relatively small basis set, then using a larger basis set in the sequal calculation would cause a problem, as not enough details were provided from the original calculation.
Basis sets determine the number of functions used to descripe the electronic structure. The larger the basis set, the more funtions are used in the calcuation and the more detailed and better approxmimations it will make the output results of a particular system. Larger basis sets however, will also acquire longer computing time and power.
The optimised BCl3 has B-Cl bond length at 1.86Å, and all H-B-H bond angles were 120.0°. These values are in good agreement with the literature values used[1].
The symmetry of BCl3 is D3h which is what one would expect. The ground state of the molecule has trigonal planar geometry.
GaussView sometimes do not display the bonds, although the bonds do exist. This can be seen from the early steps of the geometry optmisation (steps 1-4) that no bonds are drawn between the B and H atoms. This is because GaussView has a default value for bond lenght for each bond order, and as a result would only display the bond if the value falls in between this pre-defined range specific for that atom-atom pair. In case of the early stages of the BCl3 optimisation, Gaussview does not recognise the B-Cl bonds since the atomic interaction was too weak as the atoms are further apart from each other as they were when the structure is optimised.
One definition of a bond can be described as the attractive association between atoms or ions that is stable under the conditions of examination[2]. A bond differentiates from Van der Waals forces as a bond is stable, i.e. permanent and attractive, while Van der Waals interadtions are transient and can be repulsive on atomic time scales.
The geometry optimisation took 12 seconds to complete and the frequency analysis only took 3.9 seconds. These are very short time scales firstly because the structure was very small and simple, and secondly becuase the method used was very simple and the basis sets were relatively small.
Cis-/trans-isomerism of Mo(CO)4(PCl3)2
Introduction
Vibrational spectra of the isomers of Mo(CO)4L2 where L=PPh3 show variations of the CO IR absorption bands; where 4 carbonyl absorption bands are expected from teh complex with cis ligands and 1 band is expected from teh trans ligands. Thus it can be inferred that the number of CO vibrational bnads active is related to the symetry of the comlex.

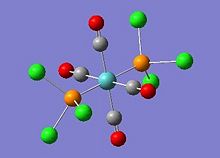
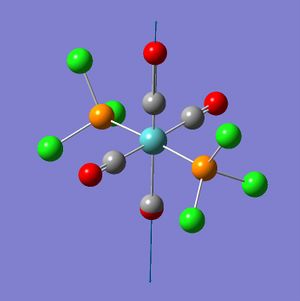
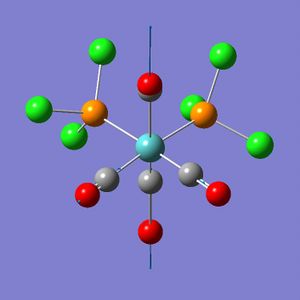
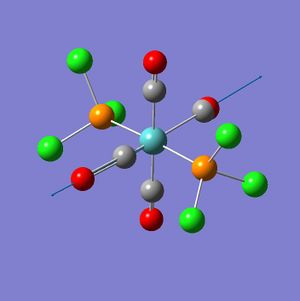
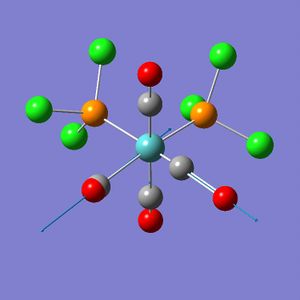
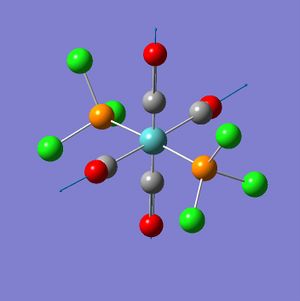
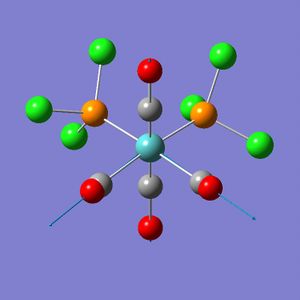
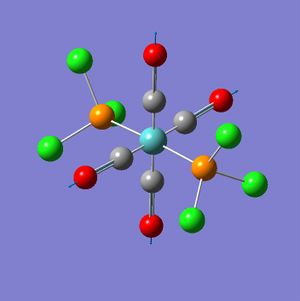
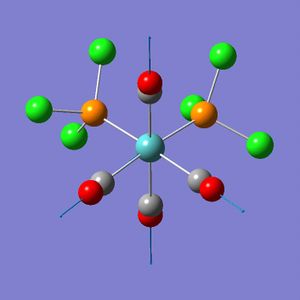
In this exercise a complex of Mo(CO)4(PCl3)2 is investigated; the cis- and trans- isomers are illustrated in Fig. 1.1.7 and Fig. 1.1.8 respectively. Question on why conformers have different vibrations will be addressed. The aim of this exercise is to use computational simulations to predict the relative thermal stability and the spectral characteristics of the cis-/trans- isomers. From the results one should be able to indentify which isomer is more stable and what the vibrational modes look like.
Geometry Optimisation of Mo(CO)4(PCl3)2
Initially both cis- and trans- Mo(CO)4(PCl3)2 were prepared in GuassView and were subjected to DFT-B3LYP/LanL2MB geometry optimization where the additional keywords "opt=loose" were used to allow the weak method to converge at a less critically defined minimum.
The results of the first trans-isomer optimisation is publshed on D-space and can be found here,:D-space reference: [1]
Similary the initial optmisation for the cis- isomer was prepared using the above command and keywords; the result is deposited on D-space can be seen following the link here, :D-space reference: [2]
The trans-isomer had the two PCl3 groups in a staggered conformation, while the two groups on the cis-isomer did not have any particular symmetry to them.
In order to achieve more accurate optimisation of the isomers, the .out files of the cis- and trans-isomers were edited via GaussView: for the cis-isomer the PCl3 groups were rotated such that one Cl was synperiplanar to one of the co-cis-carbonyls, and one Cl on the other PCl3 group was antiperiplanar to the same carbonyl. This was done by firly adding in the P-Cl bonds (which GaussView did not display), and modifying the torsion angles to 0° and 180° respectively.
The trans-isomer structure was also modified to diplay the eclipsed confomration with respect to the PCl3 groups, as well as having one Cl atom on each group to have a dihedral angle of 0° with one of the carbonyl groups.
Finally, the modified isomeric structures are subjected to a DFT-B3LYP/LanL2DZ geometry optimization with additional keywords "int=ultrafine scf=conver=9", which is a stronger method and a larger basis set with incresed electronic convergence.
The code for the modified optimisation:
# opt b3lyp/lanl2dz geom=connectivity extrabasis int=ultrafine scf=conver=9

trans/cis optimization b

0 1
The log file for the trans- isomer can be found at :D-space reference: [3]
The log file for the cis- isomer can be found at :D-space reference: [4]
Frequency Analysis of Mo(CO)4(PCl3)2
The vibrational frequencies was calculated in this upon completed optimisation jobs (this has the added advantage of checking the effectiveness of the optimisation since negative vibration frequencies are indications of incomplete optimisation).
The code for the frequency analysis:
# freq b3lyp/lanl2dz geom=connectivity extrabasis int=ultrafine scf=conver=9

trans/cis frequency analysis

0 1
Log file for cis-isomer can be found at :D-space reference: [5]. Log file for trans-isomer can be found at :D-space reference: [6]
From reading the log files of these calculations, it was found that while the cis-frequency analysis converged, the trans-frequency analysis did not converge fully:
Convergence data from the trans-isomer frequency analysis:
| Item | Value | Threshold | Converged? | |
| Maximum | Force | 0.000067 | 0.000450 | YES |
| RMS | Force | 0.000019 | 0.000300 | YES |
| Maximum | Displacement | 0.013785 | 0.001800 | NO |
| RMS | Displacement | 0.002700 | 0.001200 | NO |
Convergence data from the cis- isomer frequency analysis:
| Item | Value | Threshold | Converged? | |
| Maximum | Force | 0.000008 | 0.000450 | YES |
| RMS | Force | 0.000003 | 0.000300 | YES |
| Maximum | Displacement | 0.003195 | 0.001800 | YES |
| RMS | Displacement | 0.000731 | 0.001200 | YES |
A closer look at the convergence data of the trans-isomer shows that the forces are well converged, and it is only the displacement that did not quite converge. This is not ideal however not significant enough to cause a problem either, since it is the force that is the most important and in this case the values are very well below the threshhold. Thus no further optimisations nor frequency analysis were necessary for the trans-isomer. A possible reason behind this observation could be that the geometry of the optimised trans-isomer lacks an inversion centre, as the P-Mo-P bond angle is 176°, while it was initially defined as 180°. This distorted geometry could be causing a slight problem during the frequency analysis as the log file did not display any symmetry label.
Results Discussion and Answers to Questions on [Mo(CO)4(PPh3)2]
Energy and Geometry
Reading from Table 1.1.3, the cis- and trans-isomers displayed some small differences in their total energies, with the trans-isomer having a slightly more negative energy and thus more stable of the two.
| Table 1.1.3 - Energies of isomers of [Mo(CO)4(PCl3)2] | |||
|---|---|---|---|
| Isomer | Energy / Eh | Energy / kJ mol-1 | Relative Energy / kJ mol-1 |
| Trans | -623.57707196 | -1637201.602 | -2.7330 |
| Cis | -623.57603103 | -1637198.869 | 0.0000 |
The trans-isomer is the more stable[3], and this is shown in the calculated relative energies of the cis- and trans-isomers. The difference is very small, below 3 KJ/mol. However if the substituents were bulkier, e.g. PPh3 then the trans- conformation would be significantly more favoured than the cis- form, as the steric hindrance plays an more significant role in determining the relative energy of the isomers. On the other hand, if the substituents were smaller, then the cis-isomer would be favoured due to electronic factors.
In terms of the geometry of the two isomers, the cis-isomer belongs to C2v point group, while the trans-isomer belongs to the D4h point group. For the trans-conformation, trans-[Cr(CO)4(PPh3)2] is used as a literature reference because the exact match for the trans- complex in this case could not be found. Chromium should be very comparable to molybdenum since they are both in the same group.
| Table 1.1.4 - Geometric parameters of trans- Mo(CO)4(PPh3)2 | ||
|---|---|---|
| Parameter | trans- Cr(CO)4(PPh3)2, lit.[4] | trans- Mo(CO)4(PCl3)2, calc |
| P-M (avg.) / Å | 2.3656(16) | 2.41(346) |
| M-C (avg.) / Å | 1.8716 | 2.04(583) |
| P-M-P / ° | 176.69(6) | 176.6(34) |
| P-M-C (avg.) / ° | 89.54(15) | 89.7(15) |
From reading Table 1.1.4, it can be seen that the values did not match exactly between the two, however are very good agreement. The bond lengths are longer for Mo complex because of its longer covalent radius relative to Cr (1.54 Å vs. 1.39 Å[5]).This is as expected and can be explained since the metals are different.
Cis- Mo(CO)4(PCl3)2 is used as a literature reference for the cis-isomer of Mo(CO)4(PPh3)2, and as expected a larger discerpency is observed between the two:
| Table 1.1.5 - Geometric parameters of cis- Mo(CO)4(PCl3)2 | ||
|---|---|---|
| Parameter | cis- Mo(CO)4(PPh3)2, lit | cis- Mo(CO)4(PCl3)2, calc |
| P-Mo (avg.) / Å | 2.577(2) | 2.47(584) |
| Mo-C (avg.) / Å | 2.041(4) | 2.03(374) |
| P-Mo-P / ° | 104.62(7) | 94.1(47) |
| P-Mo-C (trans) / ° | 163.7(2) | 175.28(8) |
| P-Mo-C (cis) / ° | 80.6(2) | 89.30(6) |
The large differences are expected because the substituents of the literature complex are much larger and bulkier than those of the Mo complex. Overall the results are comparable and are good indidcations of the accuracy of the computational approximations.
Vibrations
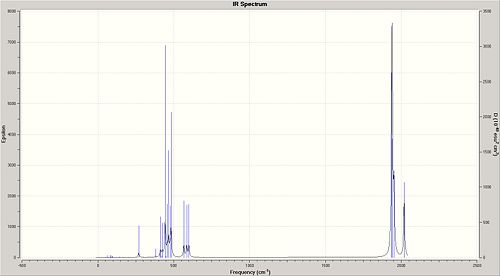
The IR spectra of the cis-/trans- isomers of the Mo(CO)4(PCl3)2 complex are illustrated in Fig. 1.1.9a and Fig. 1.1.9b respectively.
 |
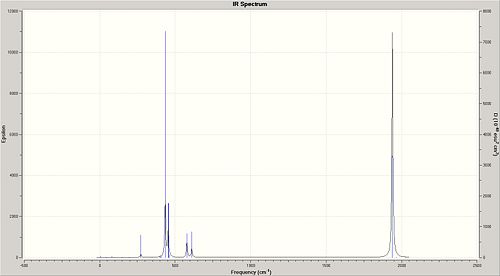 |
The region of interest on the IR Spectra is 1700-2100 cm-1, and as previously said, it is expected that there should be three peaks for the cis-isomer and one for the trans-isomer. However, it came as a surprise that all of the four cis-isomer carbonyl vibrations are IR active! However this may not be seen very clearly on the spectrums since the two absorptions are very close(1938 and 1941cm-1; On the other hand, a single peak is observed for the trans-isomer; this is likely to be a result of a similar type of overlap of two near-identical energy absorptions.
The literature[6] values for Mo(CO)4(PPh3)2 compare very poorly with the predicted values. For instance, the literature lists, for C=O strechin frequencies, at 1897, 1908, 1927 and 2023 cm-1 for the cis-isomer and 1901 for the trans-isomer; these do not really match the vibrations observed on the spectra above for Mo(CO)4(PCl3)2. However this is not to say that the predictions are wrong, since the major reason behind these differences should arise from the fact that the Cl groups do not resemble the sterics of the PPh3 substituents and hence causes the discrepancies in the data obtained.
Some low energy frequencies are also observed upon completion of the calculations. Table 1.1.8 below summarises these information. Such low energy vibrations of the cis- and trans-isomers are expected to be typical at room temperatures.
| Table 1.1.8 - Low energy vibrations of Mo(CO)4(PCl3)2 | ||||
|---|---|---|---|---|
| Isomer | Frequency / cm-1 | IR Intensity | ||
| trans | 4 | 0 | ||
| 7 | 0 | |||
| cis | 12 | 0 | ||
| 20 | 0 | |||
Mini-Project: Strcture of Ammonia Borane - the Fuel of the Future
Introduction
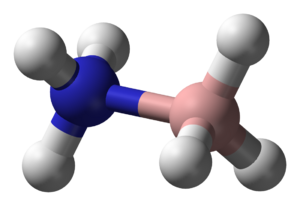
Hydrogen is going to be the fuel of the future, however ways of storing hydrogen safely are still being extensively explored. Ammonia borane (NH3BH3)is being investigated because it has a high hydrogen content and is a stable solid at room temperature[7].
In this mini project, the molecular structure will be probed using the DFT B3LYP method and a basis set of 6-31G for increased accuracy. The optimised structures will be compared to ethane analogues and the following questions will be addressed:
- Is ammonia borane staggered or eclipsed?
- What is the energy difference between these conformers?
- How does this energy difference compare to that of ethane?
- What can on e say about the bonding in this compound relative to the organic ethan analogue?
- Ammonia borane is isoeletronic with ethane. But whereas ethane has an extremely low melting point, the former melts around 110°C. What is the explanation?
Geometry Optimisation of Ammonia Borane
Ammonia borane can be drawn as both staggered and ecliplsed conformer using GaussView. Both conformers were prepared, the eclipsed form has the hydrogens torsion angle at 0°, while the staggered form has the torsion at 60°. Both were subjected to geometry optmisation using DFT-B3LYP/6-31G:
# opt b3lyp/6-31g geom=connectivity

Ammonia borane eclipse/staggered optimisation

0 1
The log file for the staggered conformer can be found at D-space reference: [7] The log file for the eclipsed conformer can be found at D-space reference: [8]
The molecule adopts a structure like ethane. The post-optimisation B-N bond lengths were 1.71 Å and 1.68 Å eclipsed and staggered conformations respectively, which are in close agreement with literature value at 1.58(2) Å[8] The B-H and N-H distances are 1.15 and 0.96 Å, respectively. The total energy of the eclipsed conformer was -83.1911 a.u., and -83.1942 a.u. for the staggered form. Immediately one can tell that the staggered conformation is the more stable of the two, by approximately 8.14 KJ/mol. This is as one would have expected since the staggered form takes the full advantage of the minimal steric hindrance between the hydrogens and hence a reduction in the energy.
In order to draw comparisons between ammonia borane and its isoelectronic ethane, geometry optimisations of the two ethane conformers were carried out, using the same method as mentioned above:
# opt b3lyp/6-31g geom=connectivity

Ethane eclipse/staggered optimisation

0 1
The log file for the staggered ethane conformer can be found at D-space reference: [9] The log file for the eclipsed ethane conformer can be found at D-space reference: [10]
Comparing ammonia borane to the organic analogue of ethane, the staggered conformation of ethane is more stable by 12.5 kJ/mol than the eclipsed conformation, which is the energy maximum for ethane. In the eclipsed conformation the torsional angle is minimised[9].
Its similarity to ethane is tenuous since borane-ammonia is a solid and ethane is a gas: their melting points differing by 286 °C (ammonia borane at 104°C and ethane at -182°C). This difference is consistent with the highly polar nature of ammonia borane. The H atoms attached to boron are hydridic and those attached to nitrogen are somewhat acidic. Fig. 2.1.2 shows the resonance form of ammonia borane.

Ammonia borane also exhibits an unusual bonding system that is responsible for some unexpected physical properties. Its melting point, for example, is much higher than anticipated from similar compounds. The hydrogens bonded to nitrogen are protic in character while those bonded to boron are hydridic, leading to a network of N–Hδ+· · ·δ−H–B dihydrogen bonds. These bonds have a substantial interaction energy (26 kJ mol−1)and lead to unusually short H· · ·H distances. Orthorhombic BH3NH3 has H· · ·H distances between 2.0 and 2.2 Å, which is considerably shorter than the sum of van der Waals radii for two hydrogen atoms, 2.4 Å. The structure of the solid indicates a close association of the NH and the BH centers. The compound is a solid at room temperature primarily due to di-hydrogen bonding and dipole-dipole interactions[10]. The dihydrogen bonding is illustrated in Fig. 2.1.3.
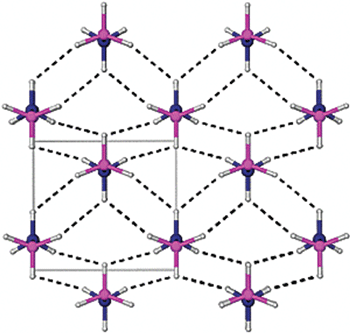
Single crystal diffraction is a common method used to study the solid state structure of ammonia borane.
NBO Charge Distribution of Ammonia Borane
The staggered ammonia borane was subjected to NBO analysis using the same method, with the additional keywords "pop=full":
# b3lyp/6-31g pop=(nbo,full) geom=connectivity

Ammonia borane NBO analysis

0 1
The output log file is deposited on D-space and can be found at[11].
 |
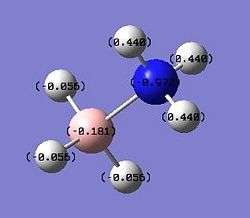 |
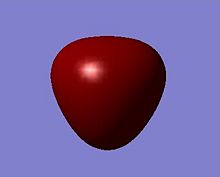
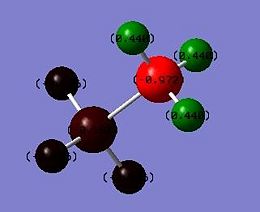
This result arises from the strongly polar N–H bond in BH3NH3, which shifts electron density away from the hydrogen atom and gives apparent hydrogen positions closer to nitrogen than the true nuclear position. The polarity along the N–H bond inBH3NH3 is substantial; calculations using DFT result in charges of −0.972 and -0.181 e for the N and H atoms, respectively. This agrees well with the previous statement which says that the H atoms attached to boron are hydridic and those attached to nitrogen are somewhat acidic.
Molecular Orbitals of Ammonia Borane
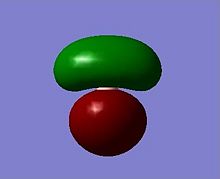
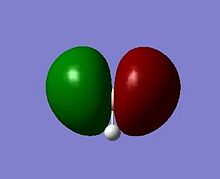
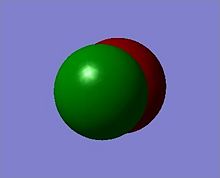
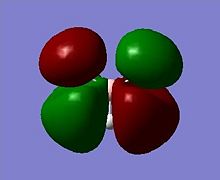
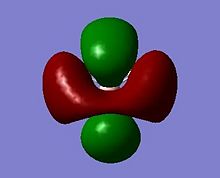
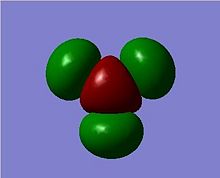
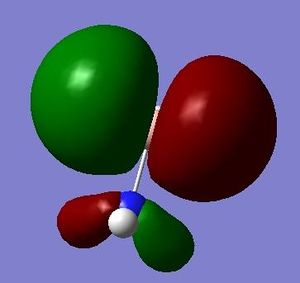
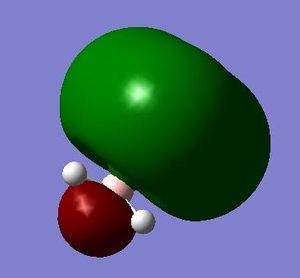
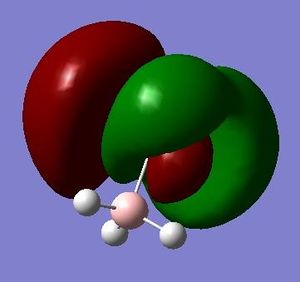
The HOMO and LUMO are of prime interest here, but additional molecular orbitals are shown below.
 E=-0.26651 a.u. |
 E=-0.26648 a.u. |
 E=0.02561 a.u. |
 E=0.10360 a.u. |
What can be seen from the MOs of ammonia borane is that the HOMO and LUMO are largely p-orbital based, having nodes across the molecule.
References
- ↑ W. Gerrard and M. F. Lappert, Reactions Of Boron richloride With Organic Compounds, Chemical Reviews, 1958, 58, 1081–1111
- ↑ Gilbert N. Lewis, The Atom and the Molecule, Journal of the American Chemical Society, 1916, 38, 772
- ↑ A.D. Allen and P.F. Barrett. Phosphine-substituted carbonyl halide com- plexes of chromium and molybdenum. Canadian Journal of Chemistry,46:1649 1653, '1968'.
- ↑ D. W. Bennett, T. A. Siddiquee, D. T. Haworth, S. E. Kabir, F. K. Camellia, J. Chem. Crys., 2004, 34, 353-359.DOI:10.1023/B:JOCC.0000028667.12964.28
- ↑ B. Cordero, V. Gómez, A. E. Platero-Prats, M. Revés, J.Echeverría, E. Cremades, F. Barragán, S. Alvarez, Dalton Trans., 2008, 2832 - 2838.
- ↑ D. J. Darensbourg, R. L. Kump, Inorg. Chem., 1978, 17, 2680-2682.
- ↑ Frances H. Stephens, Vincent Pons, R. Tom Baker "Ammonia–borane: the hydrogen source par excellence?" Dalton Transactions, 2007, pp. 2613-2626.
- ↑ T. F.; Siegbahn, P. E. M.; Richardson, T. B.; Crabtree, R. H. Study of the N-H...H-B Dihydrogen Bond Including the Crystal Structure of BH3NH3 by Neutron Diffraction, Journal of the American Chemical Society, 1999, 121, 6337-6343.
- ↑ The magnitude of hyperconjugation in ethane: A perspective from ab initio valence bond theory. Mo, Y.R. et al. Angew. Chem. Int. Ed. 2004, 43, 1986-1990.
- ↑ http://availabletechnologies.pnl.gov/media/87_723200830003.pdf

