Cleese+palin=awesome
Analysis of BCl3
BCl3 |
| B –Cl Bond Distance (Angstroms) | Cl-B-Cl Bond Angle |
|---|---|
| 1.75 | 120° |
| File Type | Calculation Type | Calculation Method | Basis Set | Final Energy (a.u.) | Dipole Moment | Dipole Moment | Calculation Time |
|---|---|---|---|---|---|---|---|
| *.fch | FOPT | RB3LYP | 6-31G(D) | -1405.6 | 0.00 Debye | C3V | 2 min 1 sec |
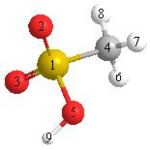
Analysis of MsOH
MsOH |
| O=S Bond Distance (Angstroms) | O-S Bond Distance (Angstroms) | C-S Bond Distance (Angstroms) | O=S=O Bond Angle | O=S-O Bond Angle | O=S-C Bond Angle | O-S-C Bond Angle |
|---|---|---|---|---|---|---|
| 1.46 | 1.65 | 1.79 | 121° | 108° | 110° | 98.2° |
| File Type | Calculation Type | Calculation Method | Basis Set | Final Energy (a.u.) | Dipole Moment | Dipole Moment | Calculation Time |
|---|---|---|---|---|---|---|---|
| *.log | FOPT | RB3LYP | 6-31G(D) | -664 | 3.24 Debye | C1 | 12 min 29 sec |
| Center Number | Atomic Number | X Coordinate (Andstroms) | Y Coordinate (Andstroms) | Z Coordinate (Andstroms) |
|---|---|---|---|---|
| 1 | 16 | -0.096016 | -0.150536 | 0.042265 |
| 2 | 8 | -0.258470 | -1.295094 | -0.842542 |
| 3 | 8 | -0.663179 | -0.154131 | 1.390368 |
| 4 | 6 | 1.639372 | 0.303008 | 0.095692 |
| 5 | 8 | -0.669265 | 1.199440 | -0.714381 |
| 6 | 1 | 1.752912 | 1.196375 | 0.710672 |
| 7 | 1 | 1.984013 | 0.479616 | -0.924415 |
| 8 | 1 | 2.174201 | -0.541204 | 0.535902 |
| 9 | 1 | -1.483792 | 1.454029 | -0.240117 |
BH3 Vibrational analysis
| No. | Form of the Vibration | Frequency (Hz) | Intensity | Symmetry of D3H point group | |||
|---|---|---|---|---|---|---|---|
| 1 |
|
1087.36 | 65.0232 | A2 | |||
| 2 |
|
1138.32 | 5.0169 | E' | |||
| 3 |
|
1138.32 | 5.0179 | E' | |||
| 4 |
|
2522.5 | 0 | A1' | |||
| 5 |
|
2681.45 | 70.4995 | E' | |||
| 6 |
|
2681.45 | 70.4981 | E' |
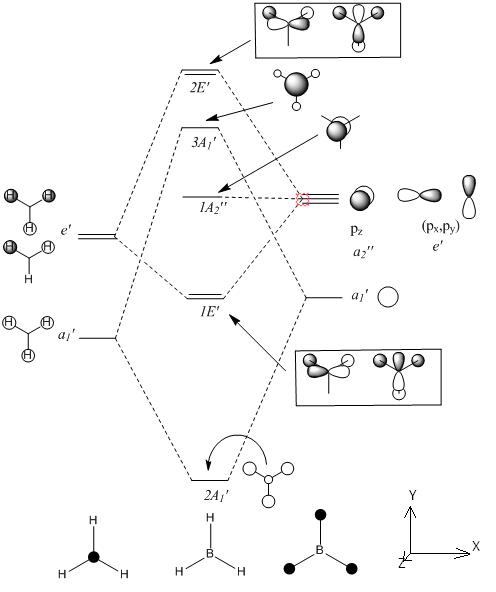
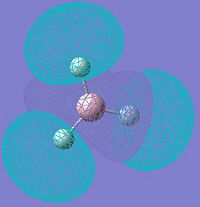
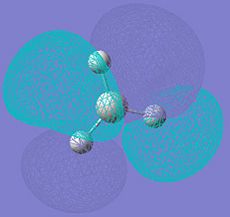
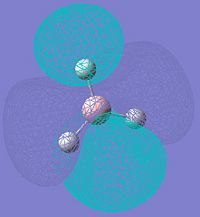
MOs of BH3
| MO No. | Quantitative MOs | Predicted Qualitative MOs |
|---|---|---|
| 1 | 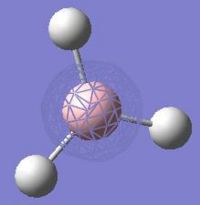
| |
| 2 | 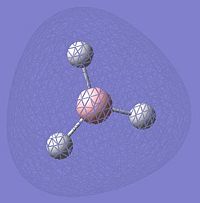
| |
| 3 and 4 | 
|
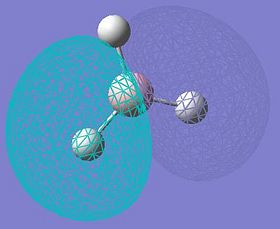 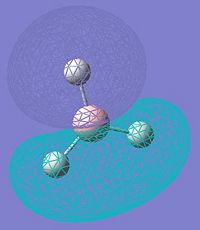
|
| 5 | 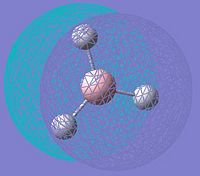
| |
| 6 | 
|
|
| 7 and 8 | 
|
|
Isomers of Mo(CO)4(piperidine)2
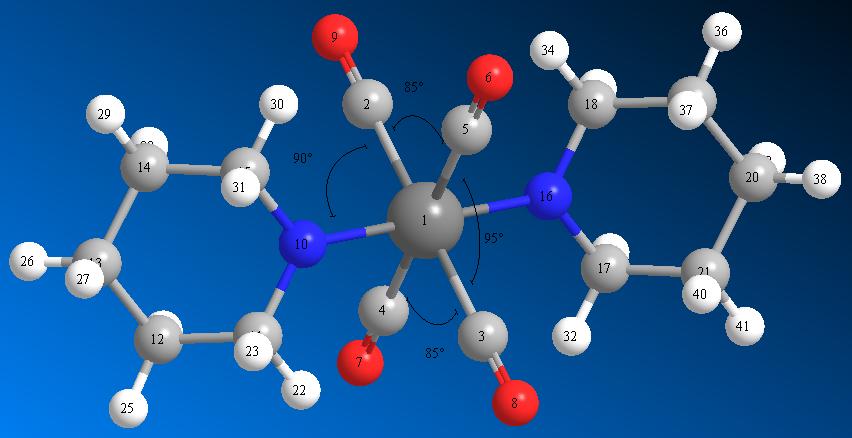
Trans Mo(CO)4(piperidine)2
The Trans isomer of Mo(CO)4(piperidine)2 was inputted into GaussView, and it's structure minimised with a DFT (Dencity Functional Theory) method (using the functionals of Electron Dencity calculations to minimise geometry). [1]
Bond angle measurements |
| Mo - N Bond Length | 2.068 Angstroms | Literature M - N Bond length | 2.038 - 2.082 Angstroms [2] |
|---|
| Mo - C3 Bond Length | 2.065 Angstroms | ||
|---|---|---|---|
| Mo - C4 Bond Length | 2.065 Angstroms | ||
| Mo - C5 Bond Length | 2.066 Angstroms | ||
| Mo - C2 Bond Length | 2.066 Angstroms | Literature Mo - C Bond Length | 2.005 - 2.016 Angstroms [3] |
| C2 - Mo - N10 Bond Angle | 90.1° | ||
|---|---|---|---|
| C2 - Mo - N16 Bond Angle | 89.9° | Literature Value for Bond Angle | 87.2° - 92.0°[3] |
| C2 - Mo - C5 Bond Angle | 85° | ||
|---|---|---|---|
| C3 - Mo - C4 Bond Angle | 85° | ||
| C3 - Mo - C5 Bond Angle | 95° | ||
| C4 - Mo - C2 Bond Angle | 95° | Literature Value for Bond Angle | 87.9° - 92.1°[3] |
There is good agreement between the literature values and the values which come out of the calculations and analysis. The Mo-N bond length sits comfortably within the literature values. Both the C-N bond angles are, again, in the middle of the literature values.
There is an oddity, however, when the C-Mo-C bond angles and lengths are looked at. The Literature predicts bond angles ranging from 87.9° to 92.0°, when in-fact, we see that the angles are much less similar (85° to 95°). This is most likely a failing in the literature; the quoted values are for Mo(CO)4(PPh3)2 not Mo(CO)4(piperidine)2. Since PPh3 has a much more dominant structure (larger, and closer to the Mo) the directing effect of the ligands (in terms of sterics) would be greater, i.e. the larger ligands clash more with the substituents. Hence the CO in Mo(CO)4(piperidine)2 would be expected to take up angles closer to normal octahedral (90°). The reason that this is not the case is due to interactions from the nitrogens. The larger angle is the angle that sits between the p-orbital on the nitrogens (which have aligned with one another). The p-orbitals house (are the site of) the nitrogens’ lone pairs. In the case of PPh3; there is no lone pair to affect the angles, so we see values much closer to normal octahedral (90°).however, due to the presence of these lone pairs we see much more distorted CO bond angles.
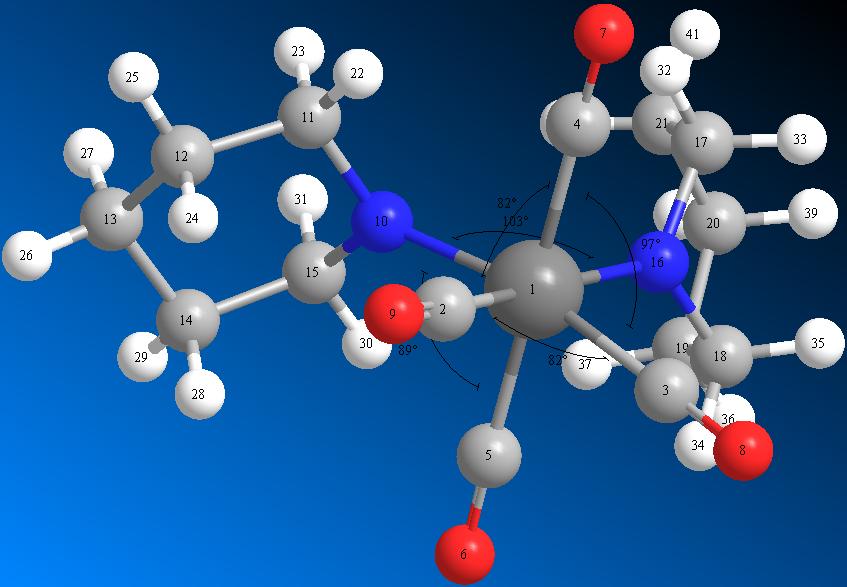
Cis Mo(CO)4(piperidine)2
The Cis isomer of Mo(CO)4(piperidine)2 was inputted into GaussView, and it's structure minimised with a DFT (Dencity Functional Theory) method (using the functionals of Electron Dencity calculations to minimise geometry). [4]
Bond angle measurements |
| Mo - N Bond Length | 2.031 Angstroms | Literature M - N Bond length | 2.237 - 2.339 Angstroms [5][6] |
|---|
| Mo - C3 Bond Length | 2.126 Angstroms | ||
|---|---|---|---|
| Mo - C2 Bond Length | 2.126 Angstroms | ||
| Mo - C5 Bond Length | 2.078 Angstroms | ||
| Mo - C4 Bond Length | 2.081 Angstroms | Literature Mo - C Bond Length | 1.972 - 2.059 Angstroms [7] |
| N10 - Mo - N16 Bond Angle | 103.4° | Literature Value for Bond Angle | 104.6° [7] |
|---|
| C4 - Mo - N10 Bond Angle | 91.5° | ||
|---|---|---|---|
| C4 - Mo - N16 Bond Angle | 89.0° | Literature Value for Bond Angle | 80.6 - 94.0° [7] |
| C2 - Mo - C5 Bond Angle | 97.0° | ||
|---|---|---|---|
| C3 - Mo - C4 Bond Angle | 96.6° | ||
| C3 - Mo - C5 Bond Angle | 82.7° | ||
| C4 - Mo - C2 Bond Angle | 82.0° | Literature Value for Bond Angle | 83.0 - 93.4 [7] |
In the cis conformation, we see a much greater effect of the interaction from the Nitrogen Lone Pairs. The distortion of the CO ligand angles is less pronounced (when compared to literature) as in the cis-conformer, we see a much greater effect of sterics interaction and a much lesser degree of electronic interaction. As the two piperidine ligands are so close together, there is a high degree of steric repulsion; the literature predicts a bond angle very similar to the one obtained (104.6°).
However, in the other cases, we are looking at a slightly different molecule, with two PPh3 ligands (instead of piperidine ligands) again, we would expect a much smaller steric interaction between the PPh3 ligand, on the CO, then the piperidine ligand; as the PPh3 is so large that, in this case, it’s bulky groups are directed away from (or lie outside of) the shorter Mo-CO bond. Since the piperidine is much closer to the CO ligands, even though it’s much smaller than PPh3, we expect a larger interaction. And this is observed, as all the calculated values lie outside of the literature values; the C-Mo-C bond angles are all more distorted than for PPh3 and the lengths are all longer.
IR Analysis
Cis-Isomer of Mo(CO)4(piperidine)2
Trans isomer of Mo(CO)4(piperidine)2
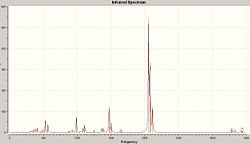
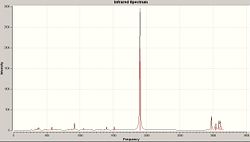
Unfortunatly, there was no available literature values for comparison of the proposed molecule. However, there are many values that are well known, for example, we know there is a C=O bond (which is common) and absorbes in the region of 1800. and indeed we see a large peak in both spectra around 1800 (2050 Hz in the Cis, and 1900 Hz in the trans).
We are also looking for adsorbtions centered around the 3100 Hz region to indicate a pyridine molecule is present; and again we can see adsorbances in these regions in both spectra (centered around 3300 Hz in the Cis and 3050 in the Trans).
Comparing these spectra to each other, they are very similar. The Cis molecule give a spectra which looks almost identical (in terms of frequencies of peaks) to the trans, except that the trans appears to be offset by about 200 Hz to the left (lower frequencies).
It is also observed that the intencities are much lower for the Cis than the Trans (600 to 3000, respectivly). implying that the Trans isomer exhibits much larger changes in dipole moment.
Relative Energies
| Total Energy of Cis-Conformer | -1011 a.u. |
|---|---|
| Total Energy of Trans-Conformer | -1023 a.u. |
as can be seen; the Trans isomer is lower in energy than the Cis, meaning that the trans is lower in energy and the thermoynamically more favoured product. This is to be expected, from tthe comparisons, we were able to see, that the Trans Conformer had bond angles much closer to normal octahedral, implying that the molecule was less sterically strained. Similarly, the Trans conformer maitained shorter bond length (on average) than it's cis form (also implying a molecule lower in energy).
As additional analysis, it would be a good idea to start editing the conformation of the ppiperidine rings, and investigating the effect on the total energy.
Since the Cis conformer was more effected by the orientation of the ring (steric interactions), where as the trans conformer was more effected by the Nitrogen Lone Pair(electronic interactions); the cis conformer would be the better starting point. By comparing the energies of the boat-boat, boat-chair and chair-chair conformers; we would get a feel for how much the cis isomer is under the steric effect of the piperidine rings (boat and chair conformations apply to the piperidine rings in all cases). With this data, we could get a quite good quantitative understanding of this effect.
With additional time, it would also be interesting to do a similar set of analysis on the Trans conformer. we know that the steric effects are minimised by the placements of the rings (as far from the CO ligands as possable), however, with the addition of a suitable substituent to the 4 position of the piridine ring, it would be possible to significantly "denature" the lone pair p-orbital of the opposing Nitrogen. Since the steric effect of changing the ring conformation would be minimal in the trans isomer, this would give us another good quantitative understanding, but this time on the electronic influence.
Between these two sets of analysis, we would get a very good understanding of the degree of both steric and electronic effects on very similar molecules; this might allow for better/faster predictions in the future.
Ammonia
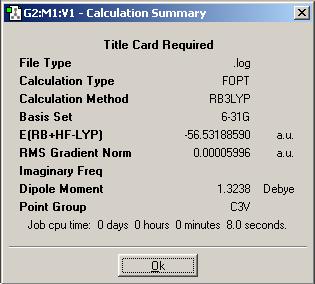
A molecule of Ammonia was inputted into Gaussview, and DFT minimised useing a 6-31G basis set and the B3LYP method.
Summary of DFT Minimisation of Ammonia
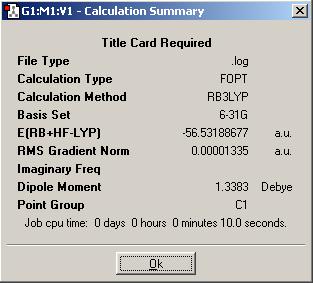
Then, a molecule of ammonia was taken and one of it's bonds elongated to 1.01A.
Summary of DFT Minimisation of Modified Ammonia
Finally, a molecule of preset parameters was inputted into Gaussview.
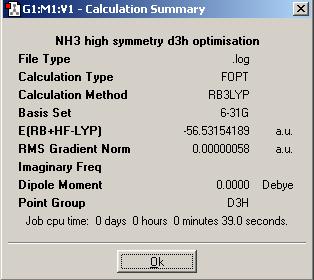
Summary of DFT Minimisation of Preconstructed Ammonia
| Ammonia | Modified Ammonia | Preconstructed Ammonia | |||||||||
|---|---|---|---|---|---|---|---|---|---|---|---|
|
|
|
AS can be seen, there is no change to the general structure of the first two molecules, the elngation of the bond has kept the same basic conformation. however, in the third structure, the symmetry has made the molecule planar.
| Job Time of Ammonia (C3v) | Job Time of Modified Ammonia (C1) | Job Time of Preconstructed Ammonia (D3h) |
|---|---|---|
| 44 s | 56 s | 2 min 17 s |
If these results are representitive of all calculations, then it is apparent that the symmetry as a large influence on the calculations. It seems to take the trend that the higher the degree of symetry, the longer the calculations. Since C1 is a sub-group of C3v which is a sub-group of D3h, we are able to simply see that the more complicated the symmetry group (D3h) the longer the calculation.
We do see, however, that even though C1 is a sub-group of C3v, the C3v calculation takes less time; but we must also consider that this first structure of ammonia was constructed using a template from GaussView, and would already be mostly minimised. Hence we are expecting a shorter than typical calculation time.
It is also possible to have the molecule "break" symmetry during ia calculation. Although GaussView is meant to retain the molecular symmetry unless told otherwise, it has an annoying tendency to change the symmetry if you have a molecule with a high degree of symmetry (but i very much doubt this is an intended function and is most likely to do with a rounding error made during the minimisation).
However, you can also tell GaussView to "Ignore Symmetry" allowing the program to find the optimal minimisation without retaining it's symmetry; there by allowing one to input a molecule with an incorrect symmetry (due to an error in calculation) and still end up with a correct result.
The implications of all this, are that if you submit a high symmetry molecule into a minimisation, the calculation time will be much greater than if you were to submit a molecule of similar size, but a lower degree of symmetry.
| Energy of Ammonia | -56.53188590 a.u. | -148,424.4664 kJ/mol | ΔE= | 0.0023 kJ/mol |
|---|---|---|---|---|
| Energy of Modified Ammonia | -56.53188677 a.u. | -148,424.4687 kJ/mol | ΔE= | - |
| Energy of Preconstructed Ammonia | -56.53154189 a.u. | -148,423.5632 kJ/mol | ΔE= | 0.9055kJ/mol |
ΔE values are the difference between the energy of the molecule and the lowest energy isomer (the modified ammonia with the slightly elongated bond).
The enrgy difference is very low (as shown); since the energy of RT (RT = Standard experimental conditions) is around 2.8 kJ/mol, then the energy difference here (0.9055 kJ/mol at the most) is insignificant; a molecule of NH3 would be completely free to change conformation between any of the above proposed symmetry conformations.
Compareing Calculation Methods
Two molecules (standard Ammonia and a preconstructed Ammonia molecule) were minimised using a 6-311G+(d,p) basis set and the B3LYP method in order to determine the time taken for different levels of calculations.
| Time Taken for Ammonia | Time Taken for Modified Ammonia |
|---|---|
| 30 s | 2 min 23 s |
Both the molecules above show similar scan times at this level as they do at the lower level of calculations. The lower level calculations took 44 s and 2 min 17 s for ammonia and the modified ammonia respectivly. At the higher level calculations, the times were 30 s and 2 min 23 s.
There is clearly not a sizeable increase, at this simple level of molecule, in calculation time. The case is almost certainly that, due to the size and simplicity of the molecules, the calculations minimise after very few iterations, meaning that there is not time for the more complicated calculations to draw away (in terms of time) from the more simple calculations.
| Barrier Hight of Inversion (E(D3h)-E(C3v) | (-56.42664911 a.u.)-(-56.4344451 a.u.) | 20.5 kJ/mol |
|---|---|---|
| ΔE from Lower Level Calculation | 0.9032 kJ/mol |
As can be seen, there is a significant difference between the two sets of calculations; the simpler levels give a value of approximatly a kJ/mol, where as the higher level calculation predicts a value of over 20 times that (over 20 kJ/mol). And infact, the higer level prediction is much closer to the experimentally determined barrier of 24.3 kJ/mol (these are about twice RT of each other; and the energy difference is almost insignificant.
IR Analysis
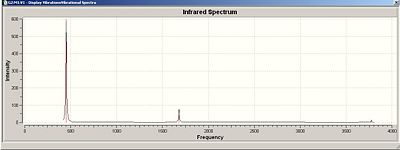
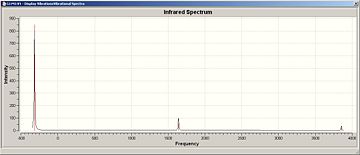
Now we looked at the different results seen after an IR analysis on these ammonia molecules of different symmetry (D3h and C3v).
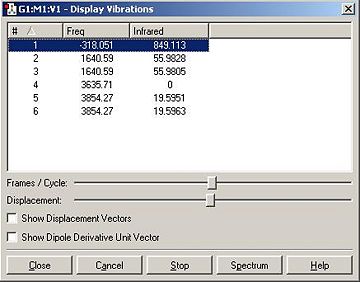
| IR Spectrum of Ammonia C3v | IR Spectrum of Modified Ammonia D3h |
|---|---|
|
|

|
|
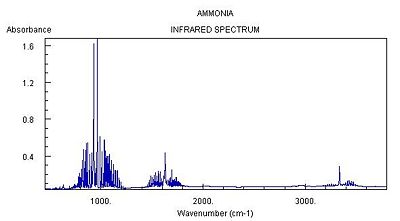
| Literature IR Spectrum of Ammonia [10] |
|---|
|
| Main Peaks in IR Spectrum of Ammonia C3v (Hz) | Main Peaks in Literature IR Spectrum of Ammonia (Hz) [11] |
|---|---|
| 452 | 932 |
| 1680 (degenerate) | 1626/1627 |
| 3575 | 3336 |
| 3775 (degenerate) | 3343 (degenerate) |
Vibration Pairs
| Frequency of Vibration (Ammonia) (Hz) | Frequency of Vibration (Modified Ammonia) (Hz) |
|---|---|
| 452 | -318 |
| 1680 (degenerate) | 1640 (degenerate) |
| 3575 | 3635 |
| 3775 (degenerate) | 3854 (degenerate) |
The two calculated spectra are very similar, they both have the same general pattern (as can be seen). In both spectra, the peaks occur in the same reregions, except for the negative (transition) frequency in the modified ammonia, which is shofted from aproximatly 450 Hz to -300 Hz.
Clearly this is a little odd, there is a negavtive frequency present. However we are expecting a negative frequency in the analysis of this molecule. As we are starting with a non-optimised structure (planar ammonia) then we are expecting it to exhibit a frequency of conversion, or rather it will show a vibration which takes it thought it's more favoured conformation. This negative frequency corresponds to this vibration.
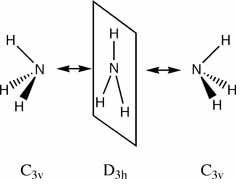
The inversion path is the motion/path of one extreme conformation(C3v), through the transition state(D3h) to the other extreme conformation (C3v):
In this case, the inversion path corresponds to the vibrations at 452 Hz and -318 Hz in the C3v and D3h Ammonia, respectivly.
Exploring the Stabilities of Allotropes of Sulpher
When i consider interesting bonding (the criteria for this mini project), my mind wanders to sulpher. Sulpher's ability to form allotropes is second only to carbon, and it is perfectly happy to form large, complicated conformations. Now, we will look at some of these more interesting (in my oppinion) allotropes.
Minimisation
It is important to pick a method and basis set appropriate for the calculations. Now, since most of the molecules that have been chosen are small, and don't have large, bulky substituents (indeed, they are all sulpher); a relativly high method and basis set were to be chosen.
In the end, an MP2 method was selected, with the LANL2DZ basis set. Since our experience with various methods and basis sets was very imited, there were not that many options to choose from (assuming the method was one that had been used before); and this seemed to be a good balance between calculation time and accuracy or results.
As such, all files were prepended with this string, and sumitted to the SCAN server:
# opt rmp2=full/lanl2dz geom=connectivity
Now, it would be entirely possible to run all of these calculations on a laptop, none of them are extraordinarily complicated, and the molecules are all fairly small with a high degree of symmetry. However, if rn on the laptop, then the results cannot be published to "D-Space" and therefore couldn't be easily referenced.
Selection of Samples
Sulpher's tendency to form allotropes is second only to carbon, therefore there is an almost infinite array from which to pick samples. Unfortunatly, we don't have infinite time so a clever selection of more interesting examples is crucial.
To this end, S8 was chosen; as the most abundant naturally occuring form of sulpher, this was an obvious starting point. The idea is to look at allotropes of both smaller and larger sizes, so a range of allotropes on either side of Sulpher were chosen:
| S3 | S4 | S5 | S6 | S7 | |||||||||||||||
|---|---|---|---|---|---|---|---|---|---|---|---|---|---|---|---|---|---|---|---|
|
|
|
|
|
| S8 | S10 | S12 | S20 | ||||||||||||
|---|---|---|---|---|---|---|---|---|---|---|---|---|---|---|---|
|
|
|
|
Minimisation Calculations
The desired method and basis set are MP2 and LANL2DZ respectivly. The starting point of this project was to create and optimise S8; if any meaning comparison of molecule is to take place, then all the minimisations have to be of the same method and to the same level of precision and S8 seemed like a good molecule to test out the selected calculation (as it is expected to have the lowest energy and sits in the middle (in terms of size and complexity of bonding) of the range of selected allotropes.
The first step was to create the molecule (in it's general S8 crown conformation) in GaussView. As this was a purely a preliminary step, done in order to test the viability of the method, the sulpher was pre-optimised on the laptop using DFT method and LANL2DZ basis set. As the calculation took very little time to fully optimise (28 minutes) it was determined that the allotropes could all be SCAN-ed at a higher level and basis set, without having to pre-optimise.
As such, the other allotropes were all created in GaussView and prepended with the appropriate code;
# opt rmp2=full/lanl2dz geom=connectivity
Then, these were all submitted to teh SCAN servers.
Minimisation Analysis
Once all the allotropes had been returned, the following data was compiled:
| S3 | S4 | S5 | S6 | S7 | S8 | S10 | S12 | S20 | |
|---|---|---|---|---|---|---|---|---|---|
| Energy of Allotrope (a.u.) | -29.72542860 | -39.63596832 | -49.58141277 | -59.51212018 | -69.43315241 | -79.35903323 | -99.18591194 | -119.03050393 | -198.38761880 |
| Energy of 8 Sulpher (of Allotrope)# | -79.26780963 | -79.27193661 | -79.33026043 | -79.34949357 | -79.35217418 | -79.35903323 | -79.34872955 | -79.35366927 | -79.35504752 |
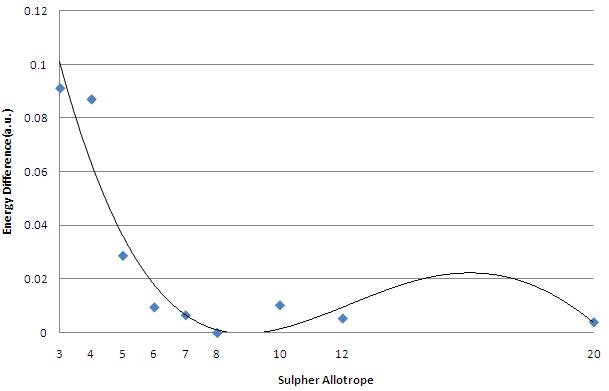
| Energy Difference between S8 and Allotrope | 0.091236294 | 0.087096591 | 0.028772798 | 0.009539657 | 0.006590469 | - | 0.010303678 | 0.005363963 | 0.003985710 |
# The energy was taken, and then multiplied by teh appropriate fraction, to give the energies of 8 sulpher, for comparison
For Calculated Data saved to "D-Space"; click on the appropriate allotrope
This data all looks very good, we know that S8 sulpher is the most stable (or at least that was our starting hypothesis), and this data seems to support that.
As can bee seen, we see a sharp drop nin energy from S3 down to S7. here, it is clear that as more Sulpher atoms are being added to the bonding structure, the stability of the allotrope increases. this trend continues to a maximum stabilisation of S8.
Therefore; the hypothese is true for cases when the allotrope of sulpher containtes 8 or fewer sulpher atoms.
Now we consider the other case, if the number of sulphers is greater than 8. For these cases the effect seen on the lowe allotropes in not quie mirrored. Although the energy does not becomre more stable than the S8 allotrope, neither does the energy shoot up as we move away from it. Instead it appears that one the alotropes "find" their lowest energy at S8, they stay at roughy that level.
This is partly to do with the repulsion between the S-S bonds and the lone pairs on the Sulpher. The reason that sulpher forms these rings instead of double bonds, is due to poor overlap of its π orbitals; as such is much prefers (is more stable) to form two single bonds instead of a double. But also we see this high tendency to catenate (form rings) coming from the high bond energy of S-S. This energy is 265 kJ/mol, which is beaten only by C-C (330 kJ/mol) and H-H (435 kJ/mol)[13]. Because of this, S-S bonds are strong, and therefore form more stable compounds with itself.
So what we are seeing (with the energies) is that; from S3 to S7 the repulsion between the bonding and lone pair electrons is being minimised by the S-S bond length and S-S-S bond angles changing.
| S3 | S4 | S6 | S8 | S10 | S12 | S20 | |
|---|---|---|---|---|---|---|---|
| Bond Length (S-S) | 2.403 | 2.408 | 2.325 | 2.304 | 2.304 | 2.266 | 2.317 |
| Bond Angle (S-S-S) | 60.0° | 85.5° | 101.8° | 106.9° | 108.2° | 103.7° | 105.4° |
(*all bond lengths in Angstrums)
What we are seeing, is a general decrease of Bond Length from S3 to S6. But as we start to near S8 this trend stops. S7, in fact, exhibits the longest bond length of all tested allotropes. if we look at the other side of S8, the bond length seems to fluctuate both above and below the equilibrium bond length (2.304 Angstrums)
Therefore, bond lengs does not appear to be a partcularly useful method pof comparison of the allotropes. Instead let us look at bond angles.
S8 exhibits a bond length of 106.9°, as we move from S3 to S6 we see a general increase in bond angle, as more Sulpher are added to the allotropic ring, the bond become less strained and thier angles approach the normal (106.9°). As we move to larger allotropes, we see the bond angle staying around the equilibrium angle.
From all this data, we see an interesting pattern. As expected, the molecule's bonds get shorter and it's angles larger as you begin to move from the smaller allotropes towards S8. This is mainly becaue of repulsion between the bonding electrons and the lone pairs on the Sulpher; the angles are approching a normal tetrahedral arrangement (109°) as this minimises this interaction.
Discrepancies
It is true, that in all the calculations, we do not see the bond lengths and angles suggested in literature[14] for a fully minimised Sulpher.
| Bond Length (Angstrums) | Bond Angle | |
|---|---|---|
| Calculated S8 | 2.304 | 106.9° |
| Literature S8 | 2.048 5 ± 0.002 | 107.9° ±f 0.6° |
Now the reasons for this are not entirely known. Every care was taken to try and replicathe these literature values once this discrepancy was noticed. The S8 allotrope was reconstructed and re-run through scan ,however the same values were obtained. Next, the Gaussian Input File was opened and manually edited to have values of bond length, S-S-S bond angle, and dihedral angle all set to the values highlighted in litherature. However, once this molecule was run under the same method and basis set as above, the molecule moved away form this more favoured state to values which were similar to those recorded (the bond lengths were slightly closer to literature, but were still 0.2 A out).
At this point, a new approch was attempted, the symmetry was set to S8 to try and force the molecule to fully minimise, but this failed as well.
After consideration of all this, i came to the conclusion (which was agreed with by Dr Hunt) that the problem was that the calculations weren't complicated enough. When a structure has several conformations which all have a very similar, low energy (i.e.when it is really a resonance of several forms) it yends to be very har to properly minimise. The solution to this would most likely be a much higher level calculation, with a significantly better basis set, however this was not attempted for two reasons; the first is that there is a time constraint on thi project, and these calculations (although individualy would not take long) would have to be repeated across all allotropes, meaning that the range of data would be significantly less (more time per calculatio = less calcuations). The second reason is simply a lack of experience in this kind of chemistry; withouy detailed knowlage on individule methods and basis sets, i'd imagine it would be very challenging to select an appropriate combination which would get you (in essence) literature results, but would still take an appropriate amount of time.
I suppose at this point you have work out which is better, faster calculations that give you good results, or calculations that take far too long (because your choise in method and basis set were poor) but that give you great results.
This form of analysis (comparing bond lengths and angles) is only applicable in molecules where the bond lengths and angles are all roughly equal. If we look at S5 and S7; we see a range of bond length and angles:
| S5 | S7 |
|---|---|
 |
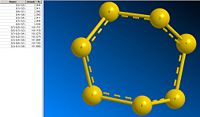 |
This range of data makes them less suitable for comparison with the more regular allotropes.
IR/Vibrational Calculations
After minimisation, there are other paramaters that can be compared in a set of molecules; to get a more complete picture of similarities of the bonding in these allotropes a virational analysis was called for.
Since we know that Sulpher is most naturally abbundant in it's S8 Crown form, the allotropes which were selected for this analysis were those which most resembled this (ones which maintained a nice cyclic conformation}. As such; minimised S6, S8 and S10 were all submitted to the SCAN server after being prepended with the appropriate code;
# freq rmp2=full/lanl2dz geom=connectivity
Vibrational Analysis
Since all the selected allotropes are highly symmetric, we are expecting to see fairly simple sets of visible vibrations (i.e. only a few vibrations will change the dipole of the molecule).
Once all the analysis had been completed, this data was returned;
| S6 | S8 | S10 |
|---|---|---|
 |
 |
 |
(to view the calculation data in "D-Space"; click the appropriate allotrope)
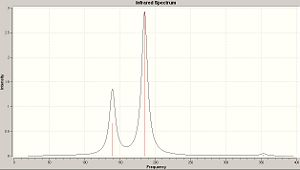
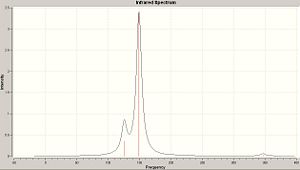
The IR spectra above are all very similar. Each of the allotropes exhibits three peaks; a central peak at large intencity, and then a peak on either side of lesser intencities.
| S6 Peaks | S8 Peaks | S10 Peaks |
|---|---|---|
| 119.6 (degenerate) | 139.4 (degenerate) | 125.8 (degenerate) |
| 236.8 | 185.0 | 149.3 |
| 344.0 (degenerate) | 352.8 (degenerate) | 346.9 (degenerate) |
So in-fact, we are seeing a large central peak, with a set of degenerate peaks on either side.
The first thing that we see is that as the allotrope increases in size, the large, centeral peak is moving to lower frequencies.
The second thing to notice is the distence btween the peaks; as allotropic size increases, the distance between the central peak and the peak at lower frequency decreses, and that the distance between the central peak and the peak at higher intencity increases.
What seems to be the case is that as you move from the more simple symmetry of S6 toward the higher, more complicated, symmetries of S8 and S10; the vibrational spectra lose their symmetry. Looking at the S6 spectrum, there is a high degree of symmetry in the vibrations (by which i mean; there is a roghly equal frequency between each of the three peaks). Where as S10 exhibits vibrations which occur with much less regularity, in fact the two vibrtion which occur at the lower frequencues are partially overlapping as they are so close.
Molecular Orbitals
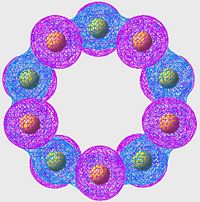
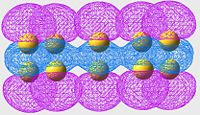
As we near the more stable allotropes, it is interesting to look at their MOs. with enough time, we start to see very similar patterns arising: similar pairings of energy leves and similar conformations of MOs that are just more stable (better overlap).
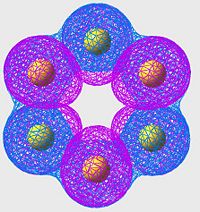
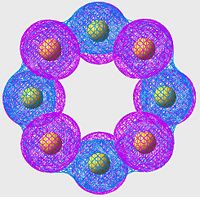
After a short look through the actualised MOs (calculated on GaussView by analysisg the Formatted CheckPoint File form SCAN); certain arrangements crop up in each on the allotropes:
HOMO of S8
| S6 | S8 | S10 |
|---|---|---|
 |
 |
 |
 |
 |
 |
(click on individule MOs to make them larger)
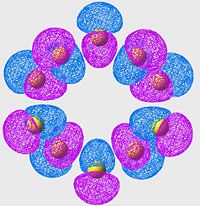
All of these orbitals have a similar arangement; they all consist of p-orbitals, one centered on each sulpher, with alternating phase. The effect of this is a large amount of overlap (bonding) across the S-S bonds (S-S bonds are strong, and this is a good example of why: excellent orbital overlap = strong bonds)
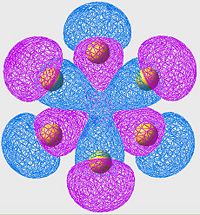
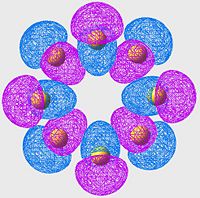
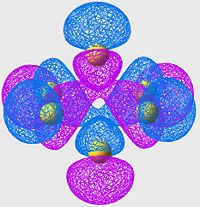
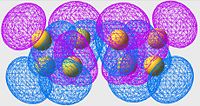
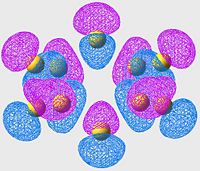
Highest Energy Bonding Orbital of S8 (unoccupied)
| S6 | S8 | S10 |
|---|---|---|
 |
 |
 |
 |
 |
 |
(click on individule MOs to make them larger)
Again we see a similar MO arrangement acoss all three molecules. Now we see a different set of p-orbitals, again arranged, one to a sulpher, in a phase alternating pattern. However here we see that the orbitals overlap not along the bonds but over them.
This is a similar characteristic that we see in π-bonds when forming a double bond. As we move towards the larger allotropes, we see a worsening of this overlap, indeed by S10 there is almost no overlap, and the arrangement looks much more like an antibonding orbital than a π-bonding system.
From literature[13], we are expecting very little π-bond like interactions as there is poor p-orbital overlap; and this is exactly what we are seeing in this set of MOs. Tendancy to form π-bond interactions decreases as we move to larger allotropes.
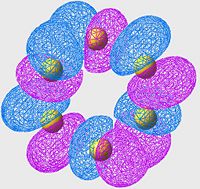
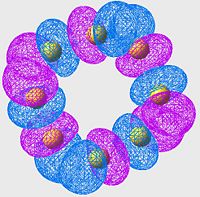
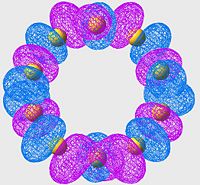
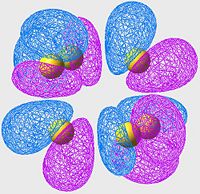
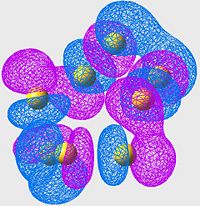
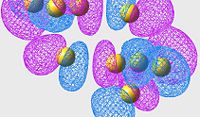
Lowest energy Anti-Bonding Orbital of S8(unoccupied)
| S6 | S8 | S10 |
|---|---|---|
 |
 |
 |
 |
 |
 |
(click on individule MOs to make them larger)
In this case, we are no longer looking at bonding orbitals, so we are looking specifically for areas of poor overlap instead of good overlap. The first thing to notice is; if we look at the location of the S-S bonds (or at least where they should be if the minimisations had been perfect) we see two orbital lobes out of phase, and the resulting node (just as we are expecting in an antibonding orbital, nodes in the locations of the bonds instead of overlap).
This set of orbitals really don't tell us anything new, they were more included to show how similar the different allotropes' orbitals are (even in the antibonding region).
Although it is hard to see without proper 3D rendering, the orbitals are arranged in a "wave" pattern along the bonds. this is the case for all the molecules, even thoughnit's easiest to see in the S8 case.
Again, there's nothing new or interesting ,really, about this exceptfor the pattern that these orbitals make (much more like art than science). Although, scientifically, the symmetry of this pattern most likely minimises the antibonding character of the arrangement, which is why these cases are the lowest energy antibonding orbitals.
References
- ↑ Data for Minimised Trans Isomer of Mo(CO)4(piperidine)2: http://hdl.handle.net/10042/to-1217
- ↑ A Bis(diazadiene) Adduct of MoCl2: Mononuclear, Octahedral, Undistorted and Diamagnetic François Stoffelbach, Bertrand Rebière, Rinaldo Poli
- ↑ 3.0 3.1 3.2 Crystal structures of trans- [ M, (CO) 4(PPh3) 2 ] and 1,4-bis(diphenylphosphino)-2,5-difluorobenzene: Reference
- ↑ Data for Minimised cis Isomer of Mo(CO)4(piperidine)2: http://hdl.handle.net/10042/to-1240
- ↑ Preparation and characterization of chromium, molybdenum and tungsten compounds containing amino acid ester derivatized diimine ligands. Crystal structure of Mo(CO)4(pyca-β-ala-OEt): Reference
- ↑ cis-Tetracarbonyl[(4-fluorophenyl)diphenylphosphine-P](piperidine-N)molybdenum(0): http://journals.iucr.org/c/issues/2001/06/00/bm1444/bm1444bdy.html
- ↑ 7.0 7.1 7.2 7.3 Steric contributions to the solid-state structures of bis(phosphine) derivatives of molybdenum carbonyl. X-ray structural studies of cis-Mo(CO)4[PPh3-nMen]2 (n = 0, 1, 2): http://pubs.acs.org/doi/pdf/10.1021/ic00131a055
- ↑ IR Data for cis Isomer of Mo(CO)4(piperidine)2: http://hdl.handle.net/10042/to-1236
- ↑ IR Data for Trans Isomer of Mo(CO)4(piperidine)2: http://hdl.handle.net/10042/to-1239
- ↑ IR Data for ammonia: http://webbook.nist.gov/cgi/cbook.cgi?ID=C7664417&Units=SI&Type=IR-SPEC&Index=1#IR-SPEC
- ↑ Additional IR data for ammonia: Reference
- ↑ Hunt Reserch Group: http://www.ch.ic.ac.uk/hunt/teaching/teaching_comp_lab_year3/9d_nh3_inversion.html
- ↑ 13.0 13.1 Inorganic Chemistry; Shriver & Atkins FOURTH EDITION: ISBN 0-19-926463-5
- ↑ The Chemistry of Homonuclear Sulphur Species: http://www.rsc.org/ejarchive/CS/1973/CS9730200233.pdf

