
Cd1017
Molecules (Part 1)
BH3
Summary Table
RB3LYP/6-31G(d,p) level

Item Table
Item               Value     Threshold  Converged?
 Maximum Force            0.000018     0.000450     YES
 RMS     Force            0.000009     0.000300     YES
 Maximum Displacement     0.000069     0.001800     YES
 RMS     Displacement     0.000035     0.001200     YES
Frequency analysis log file CD1017_BH3_FREQ.LOG
Low Frequencies
Low frequencies ---  -10.2414   -3.2799   -0.0054    0.4829    0.8273    3.3826
Low frequencies --- 1162.9526 1213.1532 1213.1559
Jmol
Vibration |
MO Diagram

| 1 |  |
B 1s orbital | 5 |  |
1a2' '; LUMO |
| 2 |  |
2a1' | 6 |  |
3a1' |
| 3 |  |
1e'; HOMO | 7 |  |
2e' |
| 4 |  |
1e'; HOMO | 8 |  |
2e' |
There are differences between real and LCAO MO diagrams. However, the differences are not significant and the LCAO MO diagram is a good approximation. Therefore, the LCAO MO diagram can be made use for qualitative analysis and qualitative MO theory is useful.
NH3
Summary Table
RB3LYP/6-31G(d,p) level

Item Table
Item               Value     Threshold  Converged?
 Maximum Force            0.000005     0.000450     YES
 RMS     Force            0.000003     0.000300     YES
 Maximum Displacement     0.000011     0.001800     YES
 RMS     Displacement     0.000006     0.001200     YES
Frequency analysis log file CD1017_Y2_NH3_FR.LOG
Low Frequencies
Low frequencies ---  -11.6206  -11.5851   -0.0032    0.0244    0.1403   25.5610
Low frequencies --- 1089.6630 1694.1734 1694.1737
Jmol
Vibration |
NH3BH3
Summary Table
RB3LYP/6-31G(d,p) level

Item Table
Item               Value     Threshold  Converged?
 Maximum Force            0.000305     0.000450     YES
 RMS     Force            0.000073     0.000300     YES
 Maximum Displacement     0.000953     0.001800     YES
 RMS     Displacement     0.000400     0.001200     YES
Frequency analysis log file CD1017_Y2_NH3BH3_FR.LOG
Low Frequencies
Low frequencies ---   -0.1396   -0.0777   -0.0066   12.6768   12.6866   16.2703
Low frequencies ---  263.6093  632.9886  638.9918
Jmol
Vibration |
The Association Energy of B-N Dative Bond
E(BH3) = -26.61532363 a.u. E(NH3) = -56.55776863 a.u. E(NH3BH3) = -83.22469002 a.u. 1 a.u. = 2625.5 kJ/mol
ΔE=E(NH3BH3)-[E(NH3)+E(BH3)] = -0.05159777 a.u. = -135.47 kJ/mol
Hence, the association energy of the B-N dative bond is -135.47 kJ/mol, while the dissociation energy of a B-N covalent bond is 398.21 kJ/mol. Therefore, the dative bond is relatively a weak bond.
Correct calculation and listed energies. However, the accuracy of the final energy value hasn’t been considered. The comparison made is good but the literature value hasn’t been referenced, to improve you could also have considered some other bond dissociation energies for comparison. Smf115 (talk) 22:24, 13 May 2019 (BST)
Ethane
Summary Table
RB3LYP/6-31G(d,p) level

Item Table
Item               Value     Threshold  Converged?
 Maximum Force            0.000232     0.000450     YES
 RMS     Force            0.000067     0.000300     YES
 Maximum Displacement     0.000394     0.001800     YES
 RMS     Displacement     0.000129     0.001200     YES
Frequency analysis log file CD1017_Y2_ETHANE_FR.LOG
Low Frequencies
Low frequencies ---  -27.3596  -27.3086  -11.7407   -0.0074   -0.0069   -0.0045
Low frequencies ---  312.4650  827.5190  827.5191
Jmol
Vibration |
Compare NH3BH3 to Ethane
 |

|
| C: -0.687 | N: -0.962
B: -0.171 |
| H: +0.229 | H(NH3): +0.436
H(BH3): -0.059 |
| l(C-C) = 1.52958 | l(B-N) = 1.66788 |
The C-C bond has a bond enthalpy of 346 kJ/mol; However, the B-N bond of NH3BH3 is only 135 kJ/mol, though ethane and NH3BH3 are isoelectronic. As C-C and B-N bond have similar bond length, the charge distribution might be an explanation: The electron density of ethane is high on the carbon atoms, making both C atoms negatively charged (-0.687). The lone pair of ammonia is donated to borane, and all atoms of borane are negatively charged, but the B atom is not highly charged (-0.171). Therefore, even though N atom is more highly charged (-0.962), the interaction between B and N atom is weak.
Thus, the bond association/dissociation energy can be manipulated by introducing different subtituents, which change the electron density on the bonding atoms.
Nice to see the optional analysis being done. Good charge calculation, you could consider electronegativity and the resulting bond character to develop the analysis more. Smf115 (talk) 22:26, 13 May 2019 (BST)
NI3
Summary Table
RB3LYP/6-31G(d,p) level

Item Table
Item               Value     Threshold  Converged?
 Maximum Force            0.000064     0.000450     YES
 RMS     Force            0.000038     0.000300     YES
 Maximum Displacement     0.000486     0.001800     YES
 RMS     Displacement     0.000277     0.001200     YES
Frequency analysis log file CD1017_Y2_NI3_FR.LOG
Low Frequencies
Low frequencies ---  -12.7375  -12.7314   -6.2899   -0.0039    0.0188    0.0633
Low frequencies ---  101.0325  101.0332  147.4122
Jmol
Vibration |
l(N-I) = 2.18362
Good first section, although you did miss out the BH3 vibrational analysis, all of the necessary structure information is present and you've successfully implemented the pseudopotential for NI3. Smf115 (talk) 22:28, 13 May 2019 (BST)
Bifluoride Ion [HF2]-
Bifluoride ion can be regarded as the Lewis base of the hydrogen fluoride dimer (HF)2; however, it is even stable in a (relatively) basic environment. Because its bond enthalpy (> 155 kJ/mol) is much greater than that of a typical hydrogen bond (~ 30 kJ/mol), it is also a rare example of "strong hydrogen bonding". However, according to the MO theory, the three atoms of bifluoride ion are held together by a 3c-4e bond.
- comment**MO theory and 3c-2e bonds belong to different models of bonding!
Bond Dissocation Energy of Bihalides
D(X-H-X) =[E(H+) + 2E(X-)] - E([HX2]-)
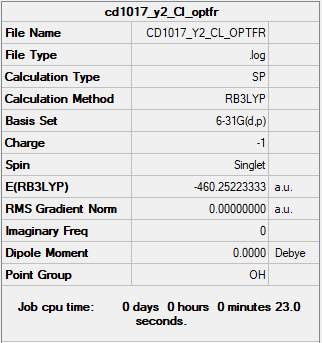
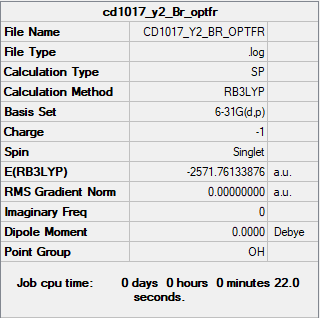
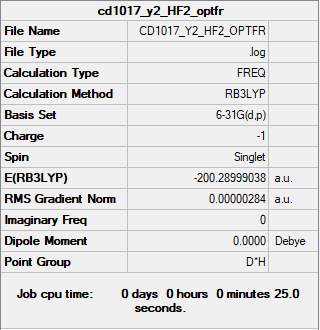
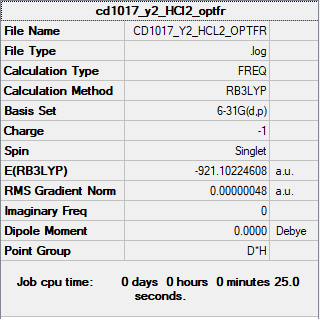
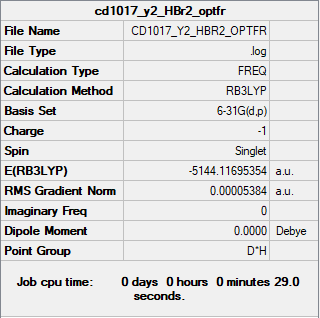
| H+: 0.00000000 | F-: -99.75408878 | Cl-: -460.25223333 | Br-: -2571.76133876 | [HF2]-: -200.28999038 | [HCl2]-: -921.10224608 | [HBr2]-: -5144. 11695354 |
| [HF2]- | 0.78181282 a.u. | 2052.6 kJ/mol |
| [HCl2]- | 0.59777942 a.u. | 1569.5 kJ/mol |
| [HBr2]- | 0.59427602 a.u. | 1560.3 kJ/mol |
The bond dissociation energies obtained by the calculation (RB3LYP/6-31G(d,p) level) are extremely high, showing that this method of calculation has limited accuracy in some certain situations.
The error may come from the energy calculation for the hydrogen ion. Its energy, as calculated, is 0 since it doesn't have any electron. Also, the hydrogen 1s orbital is very close to the nucleus and therefore low in energy, stabilising the bihalide ions significantly. Hence, the low energy of the bihalides can be another source of error.
- comment**Well spotted to identify that there is something wrong, you are correct in that the energy of H+ is not zero, but as it has no electrons electronic structure methods cannot be used, one normally takes an experimental literature value for this number. It would have been nice if you had approached the literature and hence found out what to do.
Charge Distribution of Bihalides
- comment**quantities given in tables do need to be defined, what is I(H-X)? Data point missing for I(H-F)? Given your focus on the 3c-2e bond, it would have been nice to see a description of what this might look like, or a chemdraw diagram
| [F-H-F]- | [Cl-H-Cl]- | [Br-H-Br]- | |||

| |||||
| qH | qF | qH | qCl | qH | qBr |
| 0.528 | -0.764 | 0.249 | -0.625 | 0.162 | -0.581 |
| l(H-F): | l(H-Cl): 1.57747 | l(H-Br): 1.72864 | |||
| X | F | Cl | Br |
| l(H-X) | 1.15056 | 1.57747 | 1.72864 |
| qHqX/l(H-X)2 | -0.305 | -0.063 | -0.031 |
The trend is obvious: From bifluoride to bibromide, the electron density decreases as the electronegativity decreases and the bond length increases. Also, as mentioned, the bond strength decreases as the interaction is getting weaker going down the series.
As calculated above, the Coulomb interaction between hydrogen and halogen atoms is getting weaker, from H-F to H-Br. Therefore, the 3c-4e bonds of bohalides become weaker, from bifluoride to bibromide.
Vibrational Frequencies of Bihalides
- comment**Too many dp for the frequencies and intensities, please take a look at the "accuracy" web-page again! A bit obvious but it would be appropriate to point out that the bending modes are degenerate.
| Mode | F-H-F | Cl-H-Cl | Br-H-Br | ||||
| Frequency | IR | Frequency | IR | Frequency | IR | ||
| 1 | Symmetric Bond Stretching | 615.75 | 0.0000 | 327.28 | 0.0000 | 197.34 | 0.0000 |
| 2 | Asymmetric Bond Stretching | 1556.14 | 2363.069 | 747.41 | 5061.3665 | 999.75 | 5227.9586 |
| 3 | Bond Bending | 1242.51 | 100.3369 | 829.55 | 42.9233 | 682.86 | 10.6666 |
| 4 | Bond Bending | 1242.51 | 100.3369 | 829.55 | 42.9233 | 682.86 | 10.6666 |
Vibrations at 617, 1363, and 1427 cm-1 for bifluoride ion were predicted (Janssen 1986), and bands at 748, 1094, and 1359 cm-1 were observed for RbHBr2 at 15 K (Ault 1976). The values for bifluoride ion were close to the ones listed above, while the bands for RbHBr2 deviated a lot from the prediction, which might be the result of the influence of the cation.
Mode 1, 3, and 4 show a clear trend of the decreasing bond strength, which match the prediction in the previous section.
MO Diagram of Bifluoride
- comment**A simple MO diagram, also one of the model answers from the MOs course, so it would have been nice to see you take this a little further, primarily as practice for the LCAO part of the exam coming up. Take another look at your LUMO, the LCAO is not quite correct, this is the mixed MO, some more discussion of this would have been nice. What do you predict the effect of the halide substitution to be on the MO diagram.

Above is the LCAO MO diagram for the bifluoride ion, and for each orbital, a picture of the corresponding "real" MO is attached.
The H 1s orbital has a higher energy than F 2p orbital since H has a lower electronegativity value than F; however, the orbital overlapping of the F22- fragment rises the energy of its HOMO. The MO diagram of the F22- fragment is similar to that of F2, but the stabilisation and destabilisation are not as significant, due to the longer distance between two F atoms.
The 1s orbital of H has a σg+ symmetry, and so does the π-bonding pz orbitals of the F22- fragment. They are close in energy and therefore mixing happens, which result in the total stabilisation of the molecule.
As shown above, there's a good match between the calculated (or "real") MOs and LCAO MOs, which again proved the usefulness of the LCAO MO theory, as a simplified but not over-simplified model for various applications.
- comment**A well set out project, with good tables and graphics and all necessary files. A few issues with definitions, missing data, reporting data to the right accuracy. Some good points highlighting were things are not as expected (ie dissociation energies). The interpretation is lacking depth and the MOs section could have been better developed. Overall a good attempt.
Appendix
RB3LYP/6-31G(d,p) level
- comment**Files present and optimised and frequency analysis carried out, it would have been good to see some comment on the large positive but formally "zero" frequencies that you have obtained
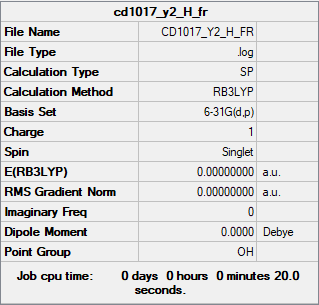
The summary table and the log file for H+.
The summary table and the log file for F-.
The summary table and the log file for Cl-.
The summary table and the log file for Br-.
The summary table and the log file for HF2-.
The summary table and the log file for HCl2-.
The summary table and the log file for HBr2-.
| H+ | Item Value Threshold Converged? Maximum Force 0.000000 0.000450 YES RMS Force 0.000000 0.000300 YES Maximum Displacement 0.000000 0.001800 YES RMS Displacement 0.000000 0.001200 YES |
| F- | Item Value Threshold Converged? Maximum Force 0.000000 0.000450 YES RMS Force 0.000000 0.000300 YES Maximum Displacement 0.000000 0.001800 YES RMS Displacement 0.000000 0.001200 YES |
| Cl- | Item Value Threshold Converged? Maximum Force 0.000000 0.000450 YES RMS Force 0.000000 0.000300 YES Maximum Displacement 0.000000 0.001800 YES RMS Displacement 0.000000 0.001200 YES |
| Br- | Item Value Threshold Converged? Maximum Force 0.000000 0.000450 YES RMS Force 0.000000 0.000300 YES Maximum Displacement 0.000000 0.001800 YES RMS Displacement 0.000000 0.001200 YES |
| HF2- | Item Value Threshold Converged? Maximum Force 0.000006 0.000450 YES RMS Force 0.000004 0.000300 YES Maximum Displacement 0.000022 0.001800 YES RMS Displacement 0.000016 0.001200 YES |
Low frequencies --- -6.4041 -6.4041 0.0014 0.0018 0.0018 615.7466 Low frequencies --- 1242.5056 1242.5056 1556.1359 | |
| HCl2- | Item Value Threshold Converged? Maximum Force 0.000001 0.000450 YES RMS Force 0.000001 0.000300 YES Maximum Displacement 0.000007 0.001800 YES RMS Displacement 0.000005 0.001200 YES |
Low frequencies --- -4.1683 -4.1683 0.0029 0.0030 0.0030 327.2772 Low frequencies --- 747.4058 829.5454 829.5454 | |
| HBr2- | Item Value Threshold Converged? Maximum Force 0.000114 0.000450 YES RMS Force 0.000081 0.000300 YES Maximum Displacement 0.000982 0.001800 YES RMS Displacement 0.000694 0.001200 YES |
Low frequencies --- -3.8549 -3.8549 0.0190 0.0190 0.0208 197.3375 Low frequencies --- 682.8576 682.8576 999.7517 |