CalPat96
Computational Labs
I will be using GaussView 5.0.9 to generate molecules and molecular orbitals and subsequently using these programmes to computationally deduce data about these different molecules. Optimization of these molecules by running my molecule through a secondary programme called Gaussian 09W provides a log file for each molecule, which can be seen within this report as links complimenting each JSmol image. The programme aims to minimise energy about the bond between atoms, through optimization methods, providing molecules at equilibrium, that is the most stable form energetically so that data deduced from the programme is accurate.
NH3
The molecule is NH3
The calculation method used was RB3LYP
The basis set was 6-31G(d,p)
The final energy is -56.55776873 a.u.
RMS gradient is 0.00000485 a.u.
Point Group C3v
Geometry
N-H Bond length is ~ 1.01798 Angstroms
H-N-H Bond angle is ~ 105.7 degrees
Table showing force and displacement energies of NH3
| Item | Value | Threshold | Converged? |
|---|---|---|---|
| Maximum Force | 0.000004 | 0.000450 | Yes |
| RMS Force | 0.000004 | 0.000300 | Yes |
| Maximum Displacement | 0.000072 | 0.001800 | Yes |
| RMS Force | 0.000035 | 0.001200 | Yes |
RMS (Root Mean Squared)
Predicted change in Energy=-5.986285D-10. Optimization completed. Stationary point found.
Image of optimized NH3
Figure 1 shows a Jmol image of NH3 produced on GaussView.
Fig 1. A Gaussview image of an optimised NH3 molecule. |
The optimisation file is liked to here
Bond frequencies of NH3
Table of bond frequencies for NH3 shown in figure 2.

Questions about bond frequencies of NH3
1. How many modes do you expect from the 3N-6 rule? 3(4)-6 = 6 vibrational modes 2. Which modes are degenerate (ie have the same energy)? Modes 2 and 3 (bending) and modes 5 and 6 (stretching) 3. Which modes are "bending" vibrations and which are "bond stretch" vibrations? 1,2 and 3 are bending and 4,5 and 6 are stretching 4. Which mode is highly symmetric? Mode 4 5. One mode is known as the "umbrella" mode, which one is this? Mode 1 6. How many bands would you expect to see in an experimental spectrum of gaseous ammonia? 4 bands. As modes 2 and 3 and 5 and 6 are degenerate. Modes 4,5,6 would produce such small peaks it is unlikely that you would see them on the IR spectrum.
NBO Charges on NH3
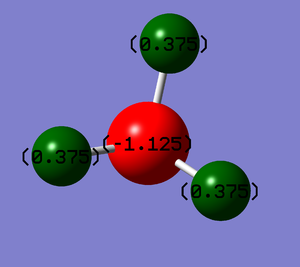
Because nitrogen is more electronegative than hydrogen, I would expect nitrogen to have a negative charge, pulling those electrons in the bond towards it, and hydrogen to have a positive charge. This is shown in figure 3.
N2
The molecule is N2
The calculation method used was RB3LYP
The basis set was 6-31G(d,p)
The final energy is -109.52412868 a.u.
RMS gradient is 0.00000365 a.u.
Point Group D∞h
Geometry
N2 triple Bond length is ~ 1.10550 Angstroms
No bond angle has been calculated as there are not three atoms in this linear molecule.
Table showing force and displacement energies of N2
| Item | Value | Threshold | Converged? |
|---|---|---|---|
| Maximum Force | 0.000006 | 0.000450 | Yes |
| RMS Force | 0.000006 | 0.000300 | Yes |
| Maximum Displacement | 0.000002 | 0.001800 | Yes |
| RMS Force | 0.000003 | 0.001200 | Yes |
RMS (Root Mean Squared)
Predicted change in Energy=-1.248809D-11. Optimization completed. Stationary point found.
Image of optimized N2
Figure 4 shows a Jmol image of N2 produced on GaussView.
Fig 4. A Gaussview image of an optimised N2 molecule. |
The optimisation file is liked to here
Bond frequencies of N2
Table of bond frequencies for N2 shown in figure 5.

Questions about bond frequencies of N2
1. How many modes do you expect from the 3N-5 rule? 3(2)-5 = 1 vibrational mode 2. Which modes are degenerate (ie have the same energy)? There is only one mode 3. Which modes are "bending" vibrations and which are "bond stretch" vibrations? There is one stretching mode 4. How many bands would you expect to see in an experimental spectrum of gaseous nitrogen? No band, which is expected as there is no dipole moment and one of the IR selection rules is that a dipole moment must be present.
NBO Charges on N2
No charges can be identified for this molecule and that's expected due to N2 being a homonuclear diatomic molecule, where the electron density is distributed evenly between the two atoms.
H2
The molecule is H2
The calculation method used was RB3LYP
The basis set was 6-31G(d,p)
The final energy is -1.17853936 a.u.
RMS gradient is 0.00000004 a.u.
Point Group D∞h
Geometry
H2 triple Bond length is ~ 0.74205 Angstroms
No bond angle has been calculated as there are not three atoms in this linear molecule.
Table showing force and displacement energies of H2
| Item | Value | Threshold | Converged? |
|---|---|---|---|
| Maximum Force | 0.000000 | 0.000450 | Yes |
| RMS Force | 0.000000 | 0.000300 | Yes |
| Maximum Displacement | 0.000000 | 0.001800 | Yes |
| RMS Force | 0.000000 | 0.001200 | Yes |
RMS (Root Mean Squared)
Predicted change in Energy=-6.835428D-15. Optimization completed. Stationary point found.
Image of optimized H2
Figure 6 shows a Jmol image of H2 produced on GaussView.
Fig 6. A Gaussview image of an optimised H2 molecule. |
The optimisation file is liked to here
Bond frequencies of H2
Table of bond frequencies for H2 shown in figure 7.
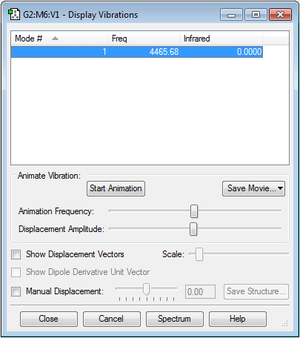
Questions about bond frequencies of H2
1. How many modes do you expect from the 3N-5 rule? 3(2)-5 = 1 vibrational mode 2. Which modes are degenerate (ie have the same energy)? There is only one mode 3. Which modes are "bending" vibrations and which are "bond stretch" vibrations? There is one stretching mode 4. How many bands would you expect to see in an experimental spectrum of gaseous hydrogen? No bands
NBO Charges on H2
No charges can be identified for this molecule and that's expected due to H2 being a homonuclear diatomic molecule, where the electron density is distributed evenly between the two atoms.
Haber-Bosch Process
N2 + 3H2 -> 2NH3
Energy values:
  E(NH3)= -56.55776873 a.u.
  2*E(NH3)= -113.11553746 a.u.
  E(N2)= -109.52412868 a.u.
  E(H2)= -1.17853936 a.u.
  3*E(H2)= -3.53561808 a.u.
ΔE=2*E(NH3)-[E(N2)+3*E(H2)]= -0.0557907 a.u. -146.47849401 KJmol-1
NH3 is more stable than N2 as the enthalpy of formation of NH3 is more negative, its more exothermic suggesting a more stable molecule. The reaction goes from 4 moles to 2, suggesting a decrease in entropy in the system, the entropy of the surrounding would increase, the programme does not take into account the energy involved with entropic changes. Thus, literature values stated [1]
- ↑ C.E Vanderzee et al,The Journal of Chemical Thermodynamics,Sep 1972, Vol 4(5) , pp.675–683 .
at -45.5638 KJmol, are lower than that of the computationally determined one.
Furthermore, GaussView doesn't take into conditions such as pressure changes involved with the formation of gaseous ammonia, which are required to shift the equilibrium to the right to favour product formation.
PH5
The molecule is PH5
The calculation method used was RB3LYP
The basis set was 6-31G(d,p)
The final energy is -344.25491049 a.u.
RMS gradient is 0.00000471 a.u.
Point Group D3h
Geometry
P-H Bond length is ~ 1.43316 Angstroms
H-P-H Bond angle is ~ 90.00000 degrees
Table showing force and displacement energies of PH5
| Item | Value | Threshold | Converged? |
|---|---|---|---|
| Maximum Force | 0.000009 | 0.000450 | Yes |
| RMS Force | 0.000004 | 0.000300 | Yes |
| Maximum Displacement | 0.000055 | 0.001800 | Yes |
| RMS Force | 0.000022 | 0.001200 | Yes |
RMS (Root Mean Squared)
Predicted change in Energy=-1.032824D-09. Optimization completed. Stationary point found.
Image of optimized PH5
Figure 8 shows a Jmol image of PH5 produced on GaussView.
Fig 8. A Gaussview image of an optimised PH5 molecule. |
The optimisation file is liked to here
Bond frequencies of PH5
Table of bond frequencies for PH5 shown in figure 9.
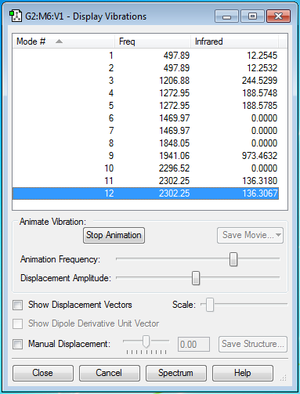
Questions about bond frequencies of PH5
1. How many modes do you expect from the 3N-6 rule? 3(6)-6 = 12 vibrational modes 2. Which modes are degenerate (ie have the same energy)? Modes 1 and 2, 4 and 5, 6 and 7 and 11 and 12. 3. Which modes are "bending" vibrations and which are "bond stretch" vibrations? 1-7 are bending modes and 8-12 are stretching modes 4. Which mode is highly symmetric? Mode 10 5. How many bands would you expect to see in an experimental spectrum of PH5? 5 bands. 3 degenerate modes and 2 separate energy modes. There are 4 modes which have no change in dipole (modes 6,7,8 and 10) which do not show any bands on the IR spectrum.
NBO Charges on PH5

We would expect the hydrogen's to have a negative charge as they are more electronegative, pulling that electron density in the P-H bond towards them, making the phosphorus more positive. The charges on the hydrogen's differ due to their distances away from the phosphorus and their respective planes. This is shown in figure 10.
PH5 Molecular orbitals
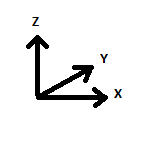
The following five molecular orbitals shown here are orientated respective to this axis, shown in figure 11. GaussView was used to generate these orbitals. The display has been altered to "transparent" to clearly identify the atoms involved and to distinguish orientation more clearly. The molecular orbitals in PH5 are generated from H5 orbitals and the 3s and 3p orbitals of phosphorus. The H5 orbitals are created from combining H2's and H3's respective orbitals.
This orbital is buried within the 2s orbital of phosphorus and is too low in energy to be involved in bonding. On GaussView the orbital can only be seen if the molecule is shown as the wire frame structure. The 1s orbital for phosphorus is shown in figure 12.
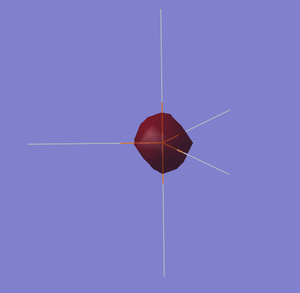
Figure 13 shows a bonding orbital created from the fully bonding H5 orbital and the 3s of the phosphorus. This bonding orbital has electron density distributed around all 5 atoms.
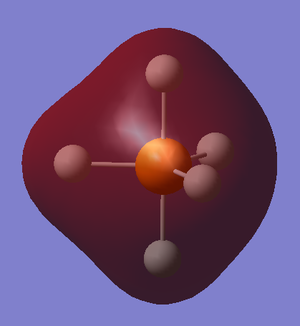
Figure 14 shows a filled H5 non bonding molecular orbital which isn't involved in the bonding of PH5, this can clearly be seen as there is only overlap of electron density between the hydrogen's 1s orbitals and no overlap with the phosphorus. This is also the HOMO in PH5.
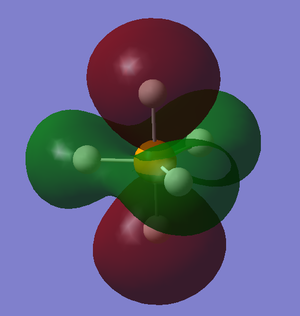
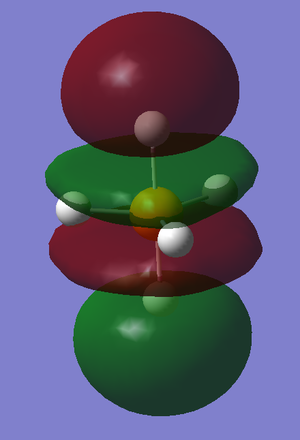
Figure 15 shows a bonding orbital produced by combining the phosphorus 3pz and the axial H5 orbital. There are three molecular orbitals of this type, degenerate in energy, which is expected due to the 3 phosphorus 3p orbitals available for bonding in PH5.

Figure 16 shows the anti-bonding orbital produced by combining the phosphorus 3pz and the axial H5 orbital, out of phase.
PH5 Molecular orbital diagram
Figure 17 shows a predicted MO diagram for PH5.

