CP3MDag7518
General remarks: Please do get in the habit of defining all your quantities (What is V? what is r1?), giving proper references (you only have very little, and they are given only in the text - the wikis have a reference section function, please make use of that), and also labelling and referencing your Figures (i.e. adding a caption with e.g. 'Figure 1', but also referring to every figure in the text). These general points are important if you want to communicate science clearly. Fdp18 (talk) 14:41, 9 May 2020 (BST)
Exercise 1: H+H2 system
On a potential energy surface diagram, how is the transition state mathematically defined? How can the transition state be identified, and how can it be distinguished from a local minimum of the potential energy surface?
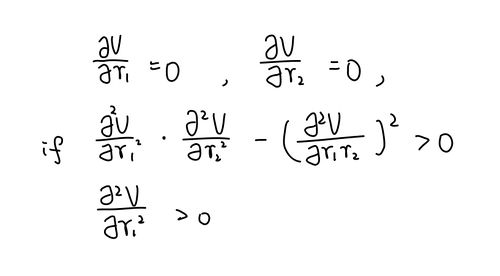
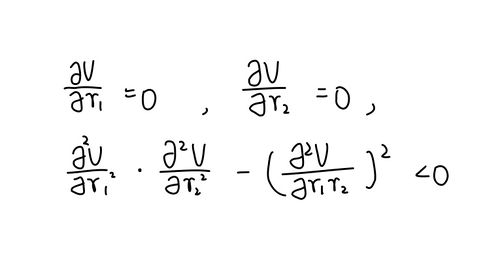
Transition state is the saddle point on this potential energy surface. As the saddle point, it should meet the requirements:
f'(r1)=0
f'(r2)=0
f''(r1) x f''(r2) - [f''(r1r2)]2 < 0
I think you are using the determinant and definiteness to decide whether the point is a transition state. However, to the best of my knowledge, that would give you any saddle point - not just the first order saddle point that are transition states. Fdp18 (talk) 13:49, 9 May 2020 (BST)
where f'(ri) is the first partial differentiation of potential energy with respect to ri, f''(ri) is the second partial differentiation of potential energy with respect to ri, f''(rirj) is the second partial differentiation of potential energy with respect to the mixed ri and rj.
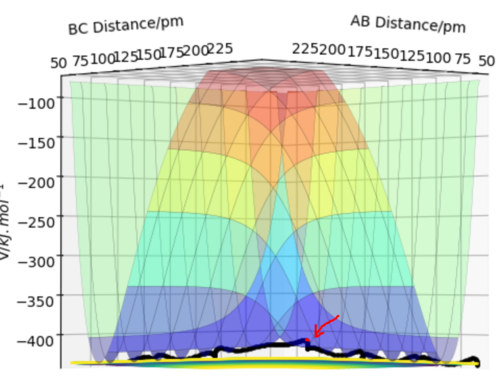
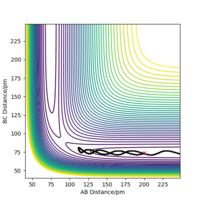
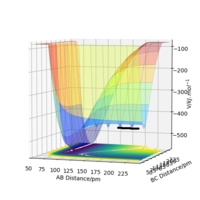
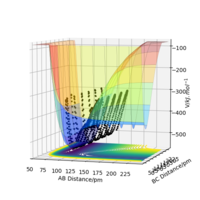
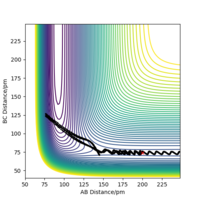
Transition state is the point with the highest potential energy on the black line which is the reacting route. (red point below gives where the transition state is)
There appears to be a lot of vibration in the shown black line. Think of a better way of representing this, maybe a different angle? Furthermore, the system is symmetric, so the transition state must be located in the middle. Fdp18 (talk) 13:51, 9 May 2020 (BST)
The difference between the local minimum is that local minimum is the point with the lowest energy potential on this surface, in other words the lowest energy this system can have, and follow the requirements below:
Saddle point is "the maximum on the minimum energy path", the maximum energy this system has when reaction happens, which is definitely not the minimum number.
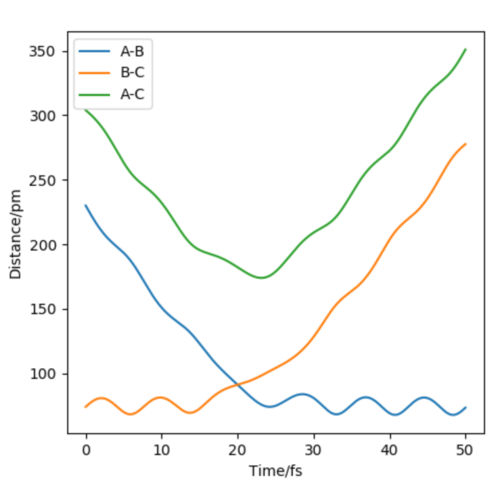
Report your best estimate of the transition state position (rts) and explain your reasoning illustrating it with a “Internuclear Distances vs Time” plot for a relevant trajectory.
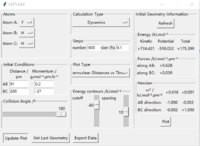
At the transition state, it is expected that the distance between atom A and B is the same as the distance between atom B and C. As distance vs time graph above shows, r1=r2 around 20 fs after the reaction starts. And the corresponding distance is approximately 70 pm. Tests were held to input same distance for BC and AB, and 0 g.mol-1.pm.fs-1 in lepsgui.py. The guess of distance starts from 75 pm where three atoms are still moving through the change in distance with time. But with the increase of setting distance, the amplitude decreases. Until when the input distance is 90.8 pm, there is no change in distance between AB and distance between BC. So the best estimation of transition state position (rts) is 90.8 pm.
That might seem trivial, but I like that you explained step by step what you did. Fdp18 (talk) 13:54, 9 May 2020 (BST)
| r | Internuclear Distances vs Time |
|---|---|
| 75 pm | 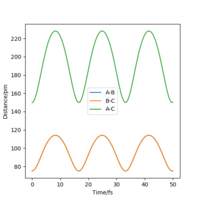
|
| 85 pm | 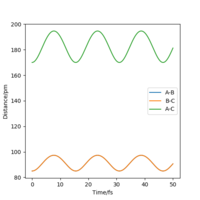
|
| 90.8 pm | 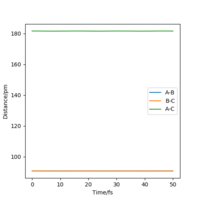
|
Comment on how the mep and the trajectory you just calculated differ.
| plot | Dynamics | MEP |
|---|---|---|
| Internuclear Distances vs Time | 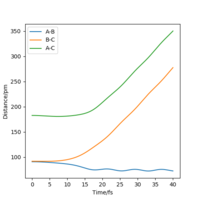 |
|
| Momenta vs Time | 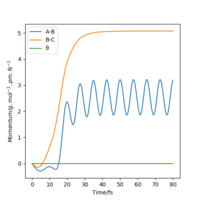 |
|
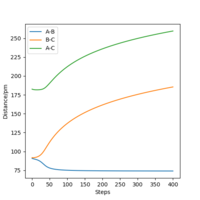
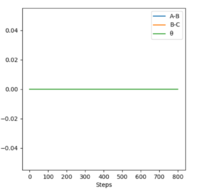
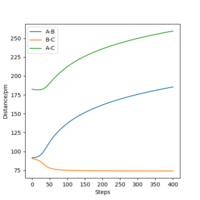
From the resulting "Internuclear Distances vs Time" graphs above, MEP ignores the vibrations of the product, in this case, the stretching of H2 molecule, with a smooth line after the reaction. Also the time taken for completing the reaction in MEP is shorter with around 5 fs, but over 15 fs in Dynamics.At the same time, the momenta in MEP keep at zero which corresponds to no vibration in hydrogen molecule in MEP.
While from "Internuclear Distances vs Time" graphs, both two calculations give the result of forward reaction, forming C hydrogen atom and AB hydrogen molecule.
| plot | Dynamics | MEP |
|---|---|---|
| Internuclear Distances vs Time | 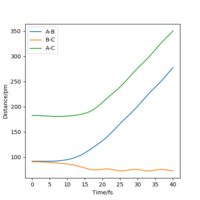 |
|
| Momenta vs Time | 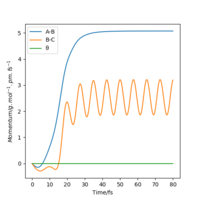 |

|
If we shift the initial settings for r1 and r2, graphs look similar to the previous ones but all the information about AB now becomes the information about BC and vice versa. This is because now the from transition state, it goes back to the reactants side. But for this system, the forward reaction and backward reaction are symmetrical, so the values did not change.
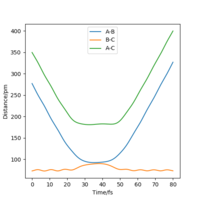
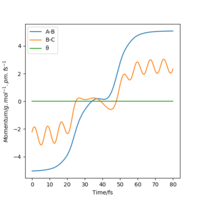
At 40 fs for the route above (backward with initial r1 of 90.8 pm and r2 of 91.8 pm), r1=72.6 pm,r2=277 pm, p1=2.21 g.mol-1.pm.fs-1, p2=5.04 g.mol-1.pm.fs-1. If we use these values for initial settings but with sign change for momenta, we can get the graphs below.
| Internuclear Distances vs Time | Momenta vs Time |
|---|---|
 |
|
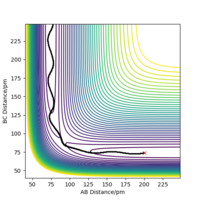
From these two graphs, we can see that reactant hydrogen atom is approaching to reactant hydrogen molecule and atom has no inluence on molecule initially, when molecule is vibrating. While when the distance between the atom and molecule is small enough, system ttends to transition state, in which r1 and r2 are getting closer and closer until nearly the same. But they didn't reach real transition state mode so that the reaction didn't happen, in which the reactant atom and reactant molecule again get away from each other and back the the original position.
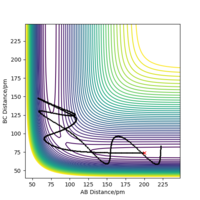
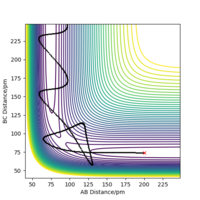
Complete the table above by adding the total energy, whether the trajectory is reactive or unreactive, and provide a plot of the trajectory and a small description for what happens along the trajectory. What can you conclude from the table?
We have a first conclusion that trajectories with initial setting r1=74 pm, r2=200 pm and with -3.1<p1/g.mol-1.pm.fs-1<-1.6 and p2=-5.1 g.mol-1.pm.fs-1 are reactive. And a hypothesis appears that all trajectories with same position settings but higher values of momenta will be reactive since they have more than sufficient energy (from higher kinetic energy) to overcome the activation energy. However, the table above shows that this hypothesis is wrong. Combining the range of p1 in the previous conclusion and the hypothesis, if total energy were larger than -413.977 kJ/mol, this trajectory would be reactive, which supports the first and third row of the table above. But in terms of the second row, even energy of this trajectory is larger than requirement, reaction still failed. Also for the last two rows, even the forth has larger energy compared with fifth, but the fifth trajectory is reactive instead of forth (though fifth is different from the previous reactive trajectory, which re-crosses the transition state). In such cases, kinetic energy this system has is not the only thing determining whether this trajectory is reactive or not. Also what is known from the last two tests is that only if the system crosses the transition state for odd-number times, the trajectory can be reactive. Otherwise the reaction cannot happen.
The last part doesn't really add any value - naturally, to get to the other side of something, one has to cross the barrier an odd number of times. Fdp18 (talk) 14:02, 9 May 2020 (BST)
Given the results you have obtained, how will Transition State Theory predictions for reaction rate values compare with experimental values?
Overall, the experimental rate constant should be lower than the value calculated from Transition State Theory. Since Transition State Theory simplifies the model which firstly only considers the translation in the system and secondly does not allow the recross (if molecular systems have crossed the transition state in the direction of products, it cannot turn around). However, there should be vibrations in the system and according to the table above, recrossing can definitely happen in real examples.In such a case, the reaction path will be higher than the minimum values on the potential surface, while Transition State Theory assumes that transition state (or transition point) as a saddle point on the potential surface which is the maxminimum you can say transition state here, since you have defined it before. Fdp18 (talk) 14:04, 9 May 2020 (BST)
point (maximum in minimum energies). That is why the activation energy in experiment is higher than the estimation by Transition State Theory. Thus, the experimental rate constant is lower that the value calculated from Transition State Theory. At the same time, Transition State Theory implies classical mechanics and ignores effect of tunneling which is of vital importance for light particles such hydrogen.
(literature.chapter 10 of J. I. Steinfeld, J. S. Francisco, W. L. Hase Chemical Kinetic and Dynamics 2nd ed., Prentice-Hall, 1998.)
Exercise 2: F-H-H system
By inspecting the potential energy surfaces, classify the F + H2 and H + HF reactions according to their energetics (endothermic or exothermic). How does this relate to the bond strength of the chemical species involved?
| A | B | C | r1(BC)/pm | r2(AB)/pm | p1/g.mol-1.pm.fs-1 | p2/g.mol-1.pm.fs-1 |
|---|---|---|---|---|---|---|
| F | H | H | 74 | 200 | 0 | 0 |
The table above defines a system with a H2 molecule and a F atom, in which 74 pm is the bond length of H2. Following graph gives how energies change with distances between three atoms. As the graph shows, when BC (distance between H2 molecule) gets large and AB gets shorter, energy is more negative. So for H2+F reaction, it is exothermic.
| A | B | C | r1(BC)/pm | r2(AB)/pm | p1/g.mol-1.pm.fs-1 | p2/g.mol-1.pm.fs-1 |
|---|---|---|---|---|---|---|
| F | H | H | 200 | 70 | 0 | 0 |
The table above defines a system with a HF molecule and a H atom. Following graph gives how energies change with distances between three atoms. As the graph shows, when AB (distance between HF molecule) gets large and BC gets shorter, energy is more positive. So for H+HF reaction, it is endothermic.
In such cases that H+HF is lower in energy than H2+F system, HF should be more stable and stronger than H2 and therefore HF has a shorter bond length.
Or since for the reaction of H2+F to H+HF, energy of this reaction should be bond energy of H2 minus bond energy of HF. Since this reaction is exothermic (negative) so that bond energy of HF should be larger than bond energy of H2 and therefore bond length of HF should be shorter.
Locate the approximate position of the transition state.
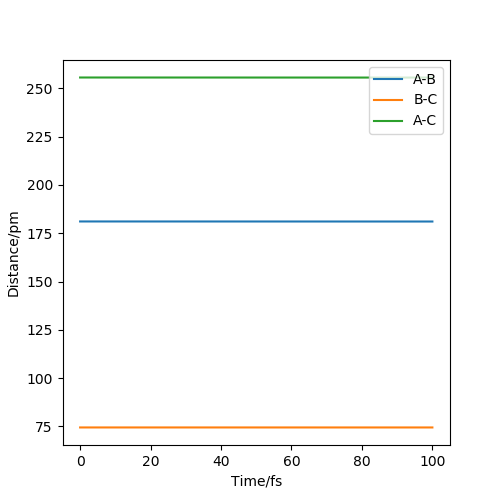
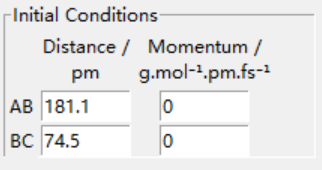
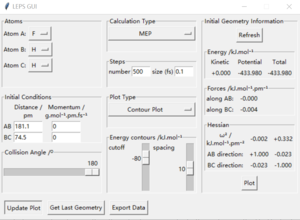
Hammond postulate is used first. Since reaction from H+HF is endothermic, so the structure of transition state should be closer to products H2. Tests were held with constant zero momenta and 74 pm between H and H, changing distances between H and F until internuclear distance does not change with time. The best estimated rts between HF is 181.1 pm and between HH is 74.5 pm as the figures above show.
Report the activation energy for both reactions.
| H2+F | transition state | HF+H |
|---|---|---|
 |
 |
|
 |
 |
|
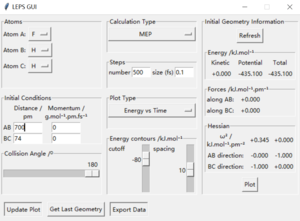
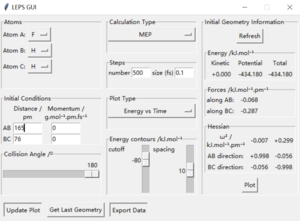
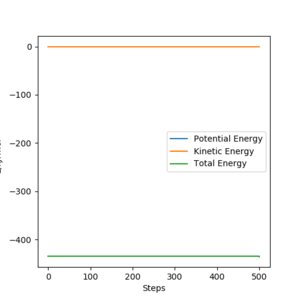
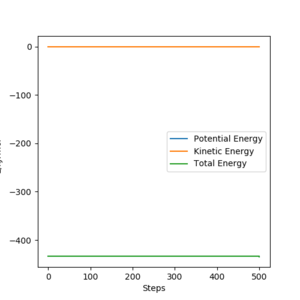
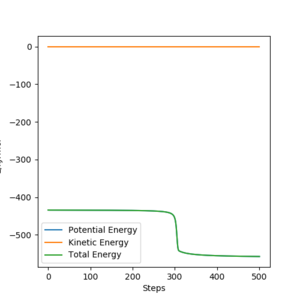
Energies for system of H2+F, transition state, and HF+H are shown by the table above. These were acquiring by changing the initial setting that distance between H and F is long enough to be seen as separated or between H and H. By substrating transition energy with energy for H2+F, activation energy for it can be calculated which is +1.12 kJ/mol. Similarly, by substrating transition energy with energy for HF+H, activation energy for it can be calculated which is +123.49 kJ/mol
| H2+F to HF+H | HF+H to H2+F |
|---|---|
| 1.12 | 123.49 |
In light of the fact that energy is conserved, discuss the mechanism of release of the reaction energy. Explain how this could be confirmed experimentally.
| p1/g.mol-1.pm.fs-1 | Reactive? | contour plot | Momenta vs Time |
|---|---|---|---|
| 3 | yes | 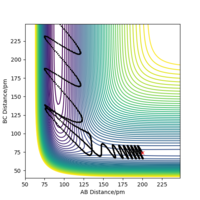
|
|
| 4 | yes | 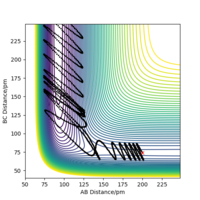
|
|
| -3 | no | 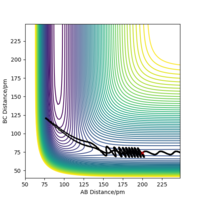
|
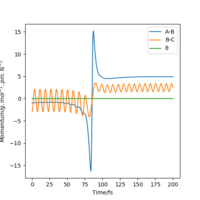
|
| 5 | no | 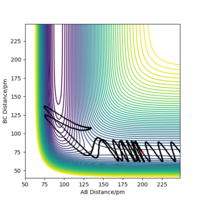
|
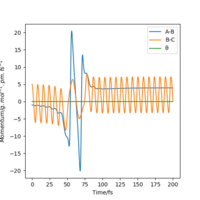
|
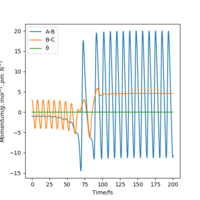
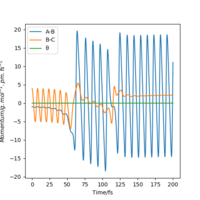
As the table above shows for F+H2 system which is exothermic. It suggests through the table that firstly only having sufficient energy is not enough for a reaction and secondly most energies released after the transition state goes to the vibration of HF from 'Momenta vs Time graph'.
| setting | contour plot | Momenta vs Time |
|---|---|---|
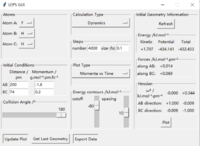 |
 |

|
As the table above shows, in which there is a large decrease in momentum between hydrogen molecule but only small increase in momentum between H and F, the translational energy of F atom is more significant.
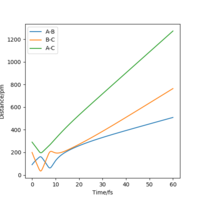
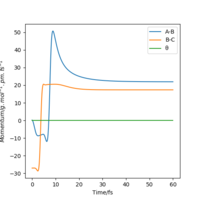
| setting | Intermolecular Distance vs Time | Momenta vs Time | Reactive? |
|---|---|---|---|
 |
 |
 |
no |
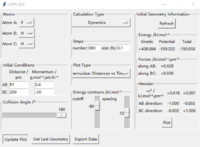 |
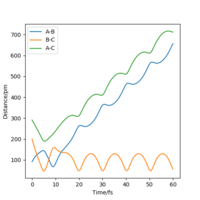 |
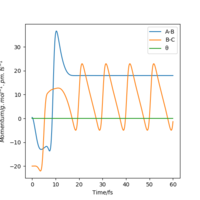 |
yes |
Similar tests were held for HF+H system. As the starting point a relatively high potential of hydrogen atom was set with a pretty low potential energy of HF. While there is no reaction. By slightly increasing the potential of HF ,and decrease, to a large extent, that of hydrogen to reduce the overall energy, there is a valid trajectory. In such a case, vibration is more crucial to bring the reaction.
How could this be confirmed experimentally / which kind of experiment would you need? Fdp18 (talk) 14:10, 9 May 2020 (BST)
Discuss how the distribution of energy between different modes (translation and vibration) affect the efficiency of the reaction, and how this is influenced by the position of the transition state.
For what is discussed above (which is included in the last question), when the reaction is endothermic and late transition state like HF+H, vibration is more effective factor for the reaction. However, for exothermic and early transition state like H2+F, transition is more effective factor for the reaction. At the same time, for H2+F, energies released are largely going to the vibration of product HF. Reversely, vibration of HF will contribute more to the efficiency of the reverse reaction (HF+H). Similarly, for HF+H, energies released are largely going to the translation of product F. Reversely, translation of F will contribute more to the efficiency of the reverse reaction (H2+F).
See also 'Bell-Evans-Polanyi principle'. Fdp18 (talk) 14:11, 9 May 2020 (BST)

