CP3MD:01346889
Molecular Dynamics report
Exercise 1: H + H2 system
Dynamics from the transition state region
Mathematical definition of the transition state
The transition state is defined as being a saddle point in the surface plot of the reaction. That is, it is a minimum with respect to one coordinate and a maximum with respect to the others.
and , where r1 and r2 can be interchanged.
Distinguishing it from a local minimum
To distinguish the transition state from a local minimum, one must check all coordinates. For a local minimum, it could be that the point is a minimum with respect to the other coordinate as well. The condition to be met is that the second derivatives of potential must be of opposite sign for both coordinates.
I think you mean direction not coordinate. Also, you should talk about orthogonal directions being maxima and minima on a TS point, not just two directions because there isn't just one direction where there is a minimum as if you turn the direction slightly there will still be a minimum, i.e the minimum isn't on an infinitely thin line. Otherwise this answer is all correct. Pu12 (talk) 14:53, 23 May 2019 (BST)
Estimation of the transition state position
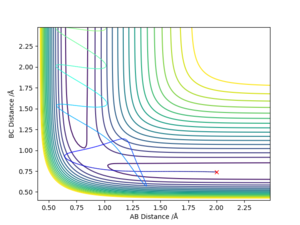
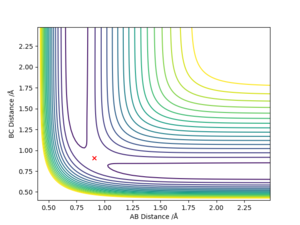
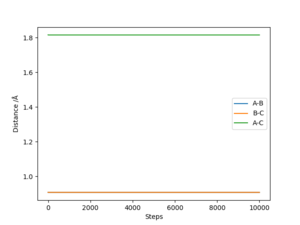
The transition state was estimated to have a position of r1= r2 = 0.908 Å.
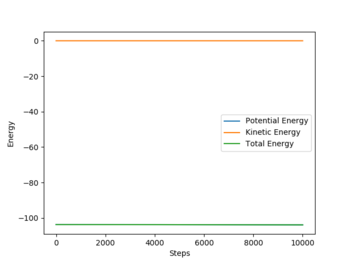
To determine it, the contour plot was first examined to find the region with lowest potential. Then, the internuclear distances against time plot was used as it is known that for the transition state, the internuclear distances must stay constant: no slope in the plot, and minimal variations due to vibrations. Thus after obtaining an initial guess with the contour plot, the value was more accurately determined by trial and error using the internuclear distances against time plot.
For the example reaction of H + H2 we have:
Differences between the mep and dynamics trajectories
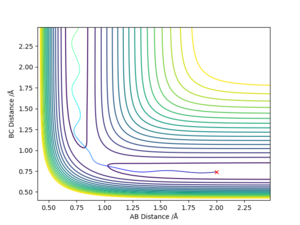
The main difference between the two types of calculations is that mep, because it wants to provide the shortest path possible, doesn't take into account the possible vibrations of the molecules. The reason why mep produces a straight line is that it resets the momentum to zero after each step of the calculation.
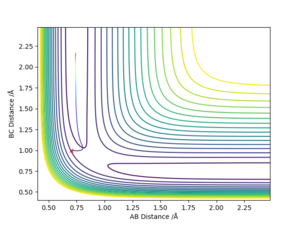
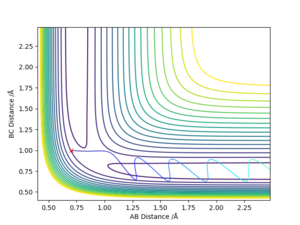
good. Pu12 (talk) 14:53, 23 May 2019 (BST)
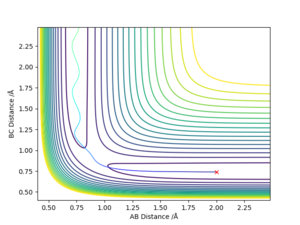
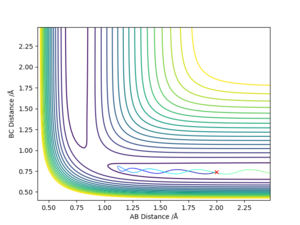
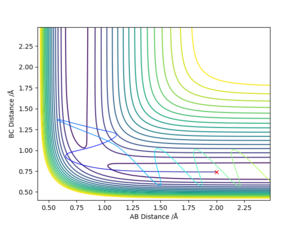
Reactive and unreactive trajectories
good, but should include discussion of vibration for each graph. Pu12 (talk) 14:53, 23 May 2019 (BST)
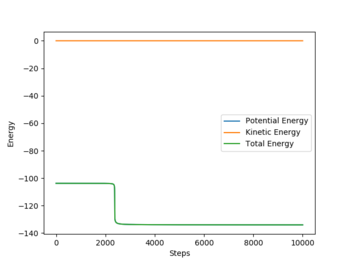
This data reflects the importance of initial momenta: even if there is enough energy to overcome the activation energy, it is not certain that the reaction will be successful.
Transition State Theory
According to Bligaard and Nørskov[1], the main assumptions of transition state theory are that: - quantum-tunnelling effects are negligible - the Born-Oppenheimer approximation is applied - an incoming flux of reactants should be thermally equilibrated - once the system/reaction reaches the transition state with a velocity towards the products side, it will not go back to the initial state So how would using these assumptions compare to the results that you have just reported, regarding rate? Pu12 (talk) 14:53, 23 May 2019 (BST)
Exercise 2: F-H-H system
In this exercise, r1 refers to rFH -the distance between the F atom and the H atom-, and r2 refers to rHH - the distance between the two H atoms-. Energies are in kcal/mol.
PES inspection
Classification of the F + H2 and HF + H reactions
The energetics of the reaction can be determined by looking at the surface plot.
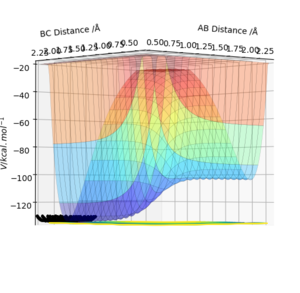
It can be seen that it takes up energy to go towards F + H2 and energy is gained going towards HF + H. The first reaction is endothermic, the latter is exothermic.
This explanation is confusing, what is the first reaction? The one that is first in the question F +H2-> HF + H or the first reaction that you have said that's "going towards F + H2", please be more clear in the future. It looks like you mean the latter and that HF + H -> F+ H2 is endothermic as it requires an input of energy, this is correct well done. Pu12 (talk) 14:53, 23 May 2019 (BST)
Using the contour plots of the reaction, computed using the mep method, by looking at both ends of the reaction, the experimental bond lengths of H-F and H-H could be determined.
It was found that H-F = 0.920 Å, and H-H= 0.741 Å.
The energetics of the reactions reflect the fact that the HF bond is stronger than the H2 bond, as it is more favourable energetically to form HF because it is a stronger and more stable bond.
Location of the transition state positions
The position of transition state was found using three types of plots: the surface plot, the contour plot of the reaction and the Internuclear Distances vs Time plot. The first one was used to obtain a rough first guess of the location of the transition state by examining where the saddle point of the plot could be. Next, the internuclear distances against time plot was used when adjusting the values of our initial guess. The transition state would have as a condition that all distances stay constant: that means no slopes and minimal vibrations. Finally, the guesses were further checked by looking at the contour plot: if the set distances were those of the position of the transition state, giving atoms no momenta, then there would be no trajectory.
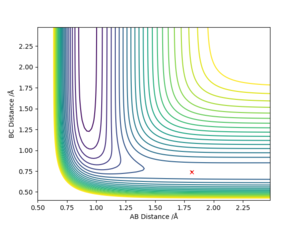
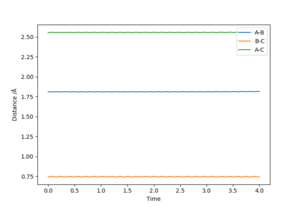
Thus, the position of the transition state for the reaction is r1=1.81263 Å and r2= 0.74150 Å.
Activation energies of the reactions
The activation energy is defined as the difference between the energy of the reactants and the transition state. Using a plot of energy against time, the difference in energy between the end and the beginning of a reaction was determined. In this case, the starting position was slightly offset compared to the transition state and towards the reactants side.
For the F + H2 reaction: Ea= 103.912 - 103.748 = 0.164 kcal/mol
For the HF + H reaction: Ea= 133.975- 103.914 = 30.061 kcal/mol
All good. Pu12 (talk) 14:53, 23 May 2019 (BST)
Reaction dynamics
Mechanism of release of the reaction energy
F + H2
A set of reactive conditions is r1 = 2, r2 = 0.8, p1=-4 and p2=0.6, with a total energy of -91.395 kcal/mol.
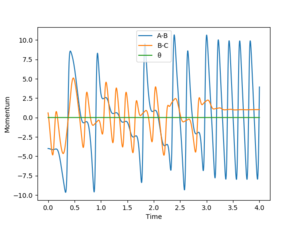
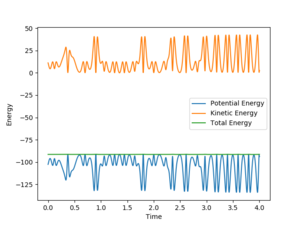
From these plots it can be seen that momentum increases overall through time, and that the kinetic energy contribution to the total energy also increases over time. That means that potential energy is being converted to kinetic energy. The latter goes either into motion of particles or vibrations: through that we eventually obtain thermal energy.
To investigate on the mechanism, a possible way would be to use calorimetry and measure the increase of temperature -when forming HF-, or decrease -when forming H2.
| pHH | Etot | Reactive? | Description of the dynamics |
|---|---|---|---|
| -3 | -96.159 | no | The F atom approaches the molecule which seems to dissociate at one point but ends up leaving where it came from |
| -2.9 | -96.699 | no | The F atoms collides with the hydrogen molecule four times but the initial molecule leaves where it came from |
| -2.8 | -97.219 | no | The F atoms collides with the hydrogen molecule two times but the initial molecule ends up leaving where it came from |
| -2.7 | -97.719 | yes | The F atom has to collide two times with the hydrogen molecule before the HF molecule is formed |
| -2.6 | -98.199 | no | The F atom collides once but the initial hydrogen molecule ends up leaving from where it came from |
| -2.5 | -98.659 | no | The F atom collides once but the initial hydrogen molecule ends up leaving from where it came from |
| -2 | -100.659 | yes | The F atom has to collide once with the hydrogen molecule before the HF molecule is formed |
| -1.5 | -102.159 | yes | The F atom has to collide three times with the hydrogen molecule before the HF molecule is formed |
| -1 | -103.159 | yes | The F atom has to collide two times with the hydrogen molecule before the HF molecule is formed |
| 0 | -103.659 | yes | The F atom has to collide three times with the hydrogen molecule before the HF molecule is formed |
| 1 | -102.159 | no | The F atom collides twice but the initial hydrogen molecule ends up leaving from where it came from |
| 1.5 | -100.659 | yes | The F atom has to collide once with the hydrogen molecule before the HF molecule is formed |
| 2 | -98.659 | no | The F atom collides once but the initial hydrogen molecule ends up leaving from where it came from |
| 2.5 | -96.159 | no | The F atom collides once but the initial hydrogen molecule ends up leaving from where it came from |
| 2.6 | -95.599 | no | The F atom collides once but the initial hydrogen molecule ends up leaving from where it came from |
| 2.7 | -95.019 | no | The F atom collides thrice but the initial hydrogen molecule ends up leaving from where it came from |
| 2.8 | -94.419 | yes | The F atom has to collide nine times with the hydrogen molecule before the HF molecule is formed |
| 2.9 | -93.799 | yes | The F atom has to collide twice with the hydrogen molecule before the HF molecule is formed |
| 3 | -93.159 | no | The F atom collides once but the initial hydrogen molecule ends up leaving from where it came from |
HF + H
The set of initial conditions chosen are: r1=0.9, r2=2, p1=-5, p2=,-18
By slowly decreasing the momentum of the incoming H atom, we obtain a reactive situation when p2 =-12.
The Polanyi rules[2] imply that vibrational energy is more efficient when it comes to promoting a late-barrier reaction compared to translation energy.
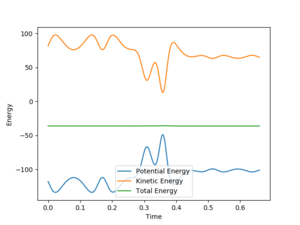
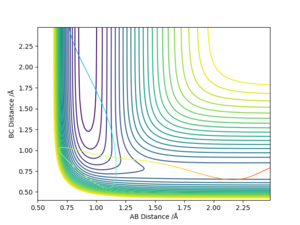
From the plots we can see that at the start of the reaction (HF +F) we store more energy in vibration in the HF bond than we do at the end of the reaction (F + HH) in the HH bond.
Is your reaction late barrier or early barrier? You imply this, but again, please be more clear in your explanations as a full answer is required. Pu12 (talk) 14:53, 23 May 2019 (BST)
This is a good report but some answers miss out parts. Pu12 (talk) 14:55, 23 May 2019 (BST)

