CP3MD01180512
H + H2 system Analysis
Transition states and Minima
The transition state is a transient state of a reaction coordinate, which can also be referred to as a saddle point on a potential energy surface. Analysing the potential energy surface of the H + H2 system, the total energy gradient for the transition state and the minimum were both found to be zero, as ∂V(ri)/∂ri=0. The transition state can be distinguished from the minimum point by taking the second derivative of the gradient.
where x and y are the critical points in question and z is the derivative of the critical points.
Using this determinant the critical point produced can be identified as a minima or a saddle point/ transition state. For if ∆ > 0 the point will be a saddle point but if ∆ < 0 and ((∂2z)/(∂x2)) > 0 then the point will be a local minima.[1]
Nf710 (talk) 13:51, 9 June 2017 (BST) This is correct but it needs to be in the basis of the normal modes. one of these will be the reaction coordinate.
Locating the Transition state
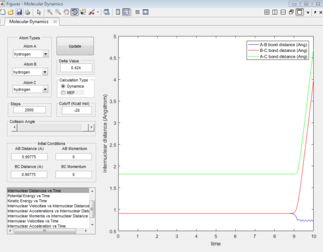
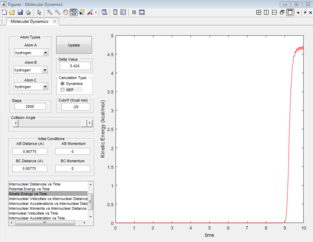
The force acting on the hydrogen molecule is equal to -∂V(ri)/∂ri. As the gradient of the potential energy surface at the transition state is equal to zero, the force will also be equal to zero at the Transition state. Therefore there would be no energy in the form of kinetic energy and all would be converted into potential energy. As the the H + H2 surface is symmetric, the distances between the three atoms is equal at the transition state and as there is not force acting on the atoms, the momentum for both bond distances is equal to zero. The bond distance where the transition state occurs was found to be 0.90775 Å. Looking at the inter-nuclear distance vs time plot at this value (Figure 1), the inter-nuclear distance is initially constant, void of any oscillations, indicating that there is no/little kinetic energy (Figure 2) as the complex is in its transition state. Beyond 9 seconds, the complex is no longer in its transition state as the the inter-nuclear distances are no longer constant, and oscillations can be seen for the A-B bond distance.
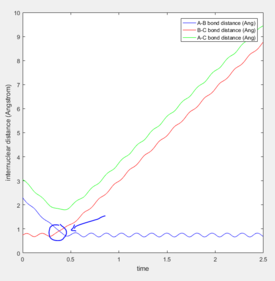
The estimation for the transition state bond length was achieved by optimising the value obtained when the the inter-nuclear distances of AB and BC intersect (Figure 3).
MEP and Dynamic Trajectories
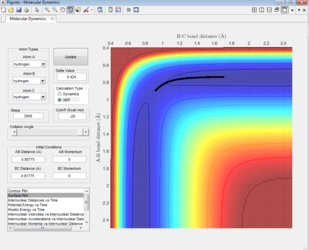
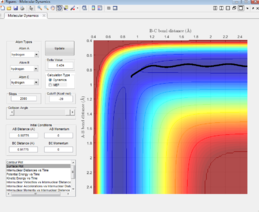
The minimum energy path (mep) is the lowest energy reaction path taken to permit the formation of products from reactants. The mep has a dependency on the transition state and can be mapped out by following the downhill gradient in both the forward and backward direction from the transition state. The reaction paths were run for a dynamic and a minimum energy path; the system used was the same as that of the transition state except that the bond length r1 was changed slightly to 0.91775 Å. The data obtained from these two reaction paths differed.
The Surface plot
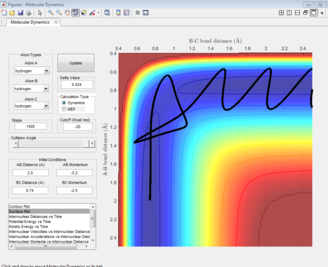
The black line on the surface plot illustrates the reaction path. For the MEP plot, the reaction is seen to start at the transition state and progresses slightly towards product formation. As the black line is shown not to be wavy, it indicates that the diatomic molecule is not vibrating.
For the dynamic plot, the reaction path also starts at the transition state, however, unlike the MEP plot, the reaction goes into completion and the product is formed (this can be inferred as the A-B bond length is small and the B-C bond length continues to increase). The reaction path for this plot is wavy, indicating vibrations of the diatomic molecule, this vibrational motion coincides with an inertial trajectory.
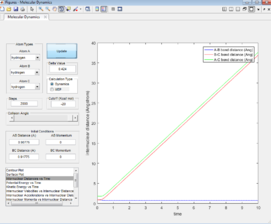
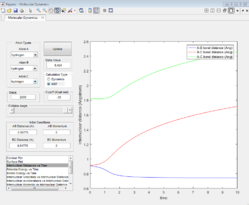
Inter-nuclear Distance vs. Time plot
For the MEP plot (Figure 7), all the bond distances are initially constant, however this quickly changes. the inter-nuclear distance for A-B gradually decreases for four seconds then plateaus. The decrease indicates the formation of the of the A-B and the plateau shows that the bond formed is static. The inter-nuclear distances for B-C and A-C show a gradual increase. The final distances vary from 0.78 to 2.41 Å.
For the dynamic plot (Figure 6), the A-B inter-nuclear distance, constant at 1 Å for over 6 seconds. The distances for B-C and A-C show a an exponential increase in inter-nuclear distance, reaching distances greater than 35 Å.
Reactive and Unreactive trajectories
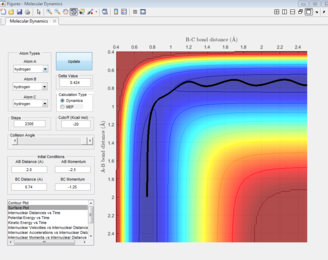
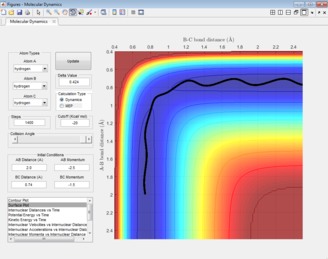
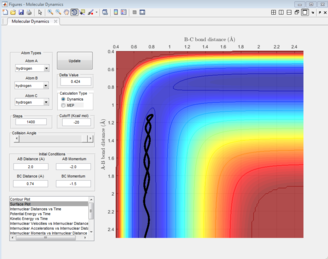
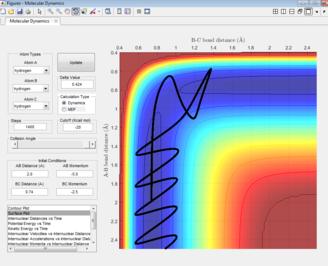
Reactions go into completion if there is enough energy in the system to overcome the activation barrier, which occurs at the transition point. looking at the surface plots produced using Matlab, it is possible to determine whether a trajectory is reactive, as the reaction path would move from the reactant channel to the product channel. It is possible to assume that trajectories stating from the same position but with greater values of momenta would be reactive as the activation barrier would be overcome due to the surplus of kinetic energy provided. This assumption was tested using r1 and r2 value of 0.74 and 2.0 respectively, and the values of p1 and p2 were varied according the the values seen in Table 1.
From the data seen in table 1, the assumption previously made is not always correct. In some cases, such as when the p1;momentum was increased in value from -2.0 to -2.5 and the p2 momentum remained at -1.5, the reaction became reactive. However, when the p momentum value was greater than -2.0 and -5.0 the reaction was seen to be unreactive.
Transition State theory (TST) is based on three main assumptions[2] :
1) The activated complex will be in equilibrium with the reactants and not the products
2) The reactant nuclei behave according to classical mechanics
3) The reaction system will pass through the lowest energy saddle point/transition state on the potential energy surface
These assumptions do not always match what occurs in reality. The second assumption would indicate that whenever atoms collide with enough energy to form a transition state, the reaction will therefore be reactive. Reaction d (table 1) forms a transition state and therefore should be reactive, however this does not occur as a result of barrier re-crossing which is not taken into account by TST, as the activated complex is not in equilibrium with the products.
The system has enough energy to cross the activation barrier and does so, however it recrosses the activation barrier and moves towards the reactants. This TST assumption also ignores the occurrence of tunneling (more prevalent with lower activation barriers) as it is a quantum mechanical property. Tunneling occurs when molecules with a small amount of energy are able to tunnel through the activation barrier resulting in product formation, although the energy produced by the collision of the molecules was not enough to overcome the barrier.
As TST ignores other pathways of reaction such as barrier re-crossing and assumes that energetic collisions will result in reactive reactions, the rates of reaction assumed by TST would be faster than the rates that are obtained experimentally.
F - H - H system Analysis
F + H2 and H + HF reaction energetics
The reaction of F + H2 is exothermic (energy is released from the system into the surroundings), as the reactants are higher in energy than the products. This is due to the stability if the H-F bond that is formed, as the difference in electronegativity between hydrogen and fluorine is great, so the bond formed is stronger than the H-H bond, and as the enthalpy of formation of the H-F bond is more negative than the positive enthalpy of dissociation for the H-H bond, the reaction is exothermic. However the reaction of H + HF is endothermic, which is due to the strength H-F bond. This strength would result in a very positive enthalpy of dissociation; the enthalpy supplied to the system through the formation of the H-H bond does not compensate the enthalpy required for H-F dissociation, as the H-H bond is weaker, energy is therefore taken up from the surroundings by the system, causing the reaction to be endothermic.
The position of the transition state
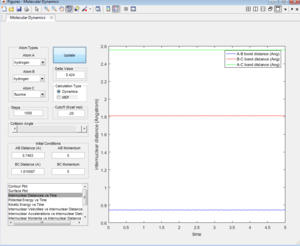
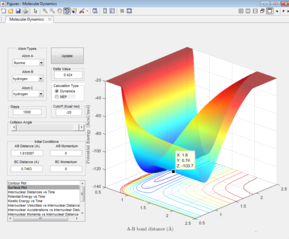
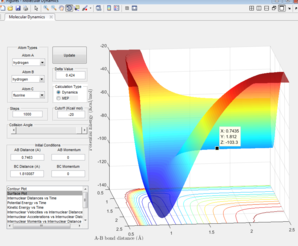
The Hammond's postulate states that the transition state of a reaction will resemble either the reactants or products depending on which one it is closer to. For exothermic reactions it resembles the reactants and for endothermic reactions it resembles the products[3] Therefore by looking at the H-H bond distance and optimatising for the F + H2 reaction, the transition state position was found. The transition state for the H + HF would also be the same as both reactions form the same [H-H-F]‡ complex. The point at which the transition state occurs for the F + H2 and the HF + H reactions can be seen in figures 8 & 9 where H-F = 0.7463 Å and H-H = 1.810087 Å.
Calculating activation energies
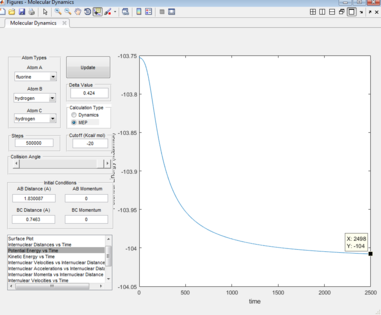
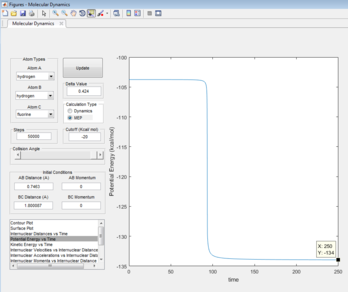
The activation energy is given as the difference in energy between the maxima of the transition state and the minima of the reactants. The energy of the transition state was found to be -103.75 Kcal/mol. MEP potential energy vs time plots were carried out for the two reactions, the bond lengths were altered slightly to resemble that of the reactants, which provided the reactant energies (Figures 11 & 12).
Activation energy = Energy of transition state - Energy of reactants
For the F + H2 reaction : -103.75 -(-104) = 0.25 Kcal/mol
For the HF + H reaction : -103.75 -(-134) = 30.25 Kcal/mol
Mechanism for the release of reactive energy
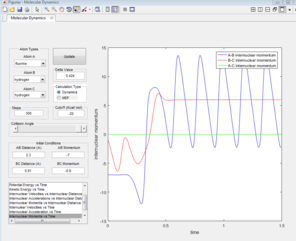
The set of conditions used to create a reactive trajectory for the F + H2 reaction were as follows:
rF-H = 2.3, rH-H = 0.81, pF-H = -7.0, pH-H = -0.9
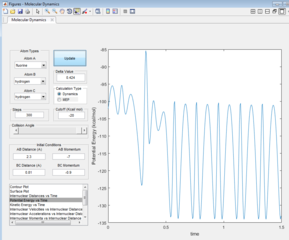
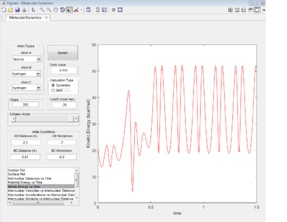
As F + H2 is an exothermic reaction, it is possible to assume, that its reaction path would result in the release of excess energy. Analysing the inter-nuclear momenta vs time graph produced (figure 13), it is seen that the H-H molecule vibrates with a smaller oscillation than the H-F molecule formed. The excess energy released by the reaction increases the amplitude of the product oscillations. As the law of the conservation of energy states that energy is not lost but conserved (converted to a different form), a decrease in the potential energy would be expected as the kinetic energy increases, which is seen in figures 14 & 15
This reaction can be analysed experimentally through calorimetry, which would indicate any changes in enthalpy as the reaction progresses; IR spectroscopy which would produce overtone bands for molecules with higher vibrational states and photochemically, by measuring photons released by vibrating molecules, to determine the vibration energies.
Nf710 (talk) 15:37, 9 June 2017 (BST) Very nice understanding of how the energy is converted using the graphs.
Polanyi's empirical rules
In chemical reactions, the reactants must overcome an activation barrier to allow product formation. Translational or vibrational energy initially deposited to the reactants can help it overcome the activation barrier. Polanyi's rules states that vibrational energy is more effective than translational when promoting a late transition barrier, where as translational energy is more effective than vibrational when the energy barrier is an early transition.[4]
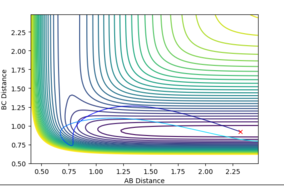
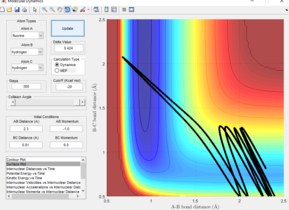
The F + H2 reaction is exothermic, therefore according to Hammond's postulate has an early transition state, and so an increase in translational energy over the vibrational energy would result in a reactive reaction. (p1=vibrational energy, p2 = translational energy)
Figure 16 shows a surface plot of a system that obeys Polanyi's rules, where p1=1.5, p2 = -5.5, producing a system with high translational energy and low vibrational energy. A system of high vibrational energy and low translational energy , where p1=6, p2 = -1.0, was seen not to produce a reactive reaction (Figure 17). This system obeys Polanyi's rules as only systems of high translational energy should cause a successful reaction when it is exothermic.
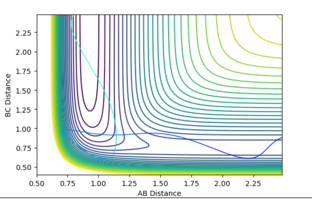
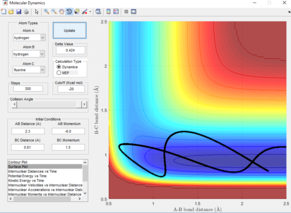
The HF + H reaction is endothermic, therefore according to Hammond's postulate has an late transition state, and so an increase in vibrational energy over the translational energy would result in a reactive reaction. (p1=vibrational energy, p2 = translational energy)
Figure 18 shows a surface plot of a system that obeys Polanyi's rules, where p1=8.6, p2 = -2.0, producing a system with high vibrational energy and low translational energy. A system of low vibrational energy and high translational energy , where p1=1.5, p2 = -6.0, was seen not to produce a reactive reaction (Figure 19). This system obeys Polanyi's rules as only systems of high vibrational energy should cause a successful reaction when it is endothermic.
Nf710 (talk) 15:44, 9 June 2017 (BST) Welldone for proving polyanis rules. You could have tried to get some examples hihc proove it at lower energy as some of the examples are quite choatic high energy examples. However the rest of the report is excellent well done.
Bibliography
- ↑ C. M. Bender and S. A. Orszag, Advanced Mathematical Methods for Scientists and Engineers I: Asymptotic Methods and Perturbation Theory, Springer New York, 2013.
- ↑ A. C. Lasaga, Rev. Miner. States), 1981, 8
- ↑ J. E. Meany, V. Minderhout and Y. Pocker, J. Chem. Educ, 2001, 78, 204.
- ↑ Z. Zhang, Y. Zhou, D. H. Zhang, G. Czakó and J. M. Bowman, J. Phys. Chem. Lett., 2012, 3, 3416–3419.

