CP2215MolecularReactionsDynamics
Introduction
This work follows a simple diatomic collision for two systems, a H + H2 system and F-H-H system, where the atoms will be represented by A,B and C respectively. These reactions can be followed on a potential energy surface with two geometrical dimensions (distance of A-B and B-C). By following reaction trajectories we can follow a path across the potential energy surface to indicate how the reaction proceeds, from starting material, passing through a transition state to the final product. By manipulating the potential energy surface and analyzing contour plots, 3D surface plots and inter nuclear momenta vs. time graphs we can gather further information about the energies and positions of the atoms (or molecules) associated each state along the reaction coordinate (starting material, TS and product). In this work we will take a classical approach to study the reactive trajectories.
Atom Diatomic collisions
H + H2
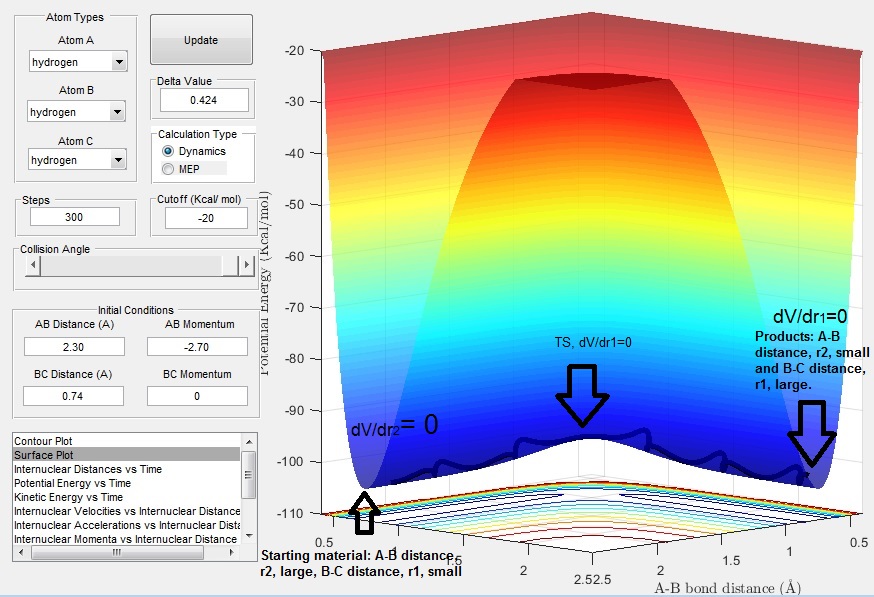
In this reaction we assume that the H (HA) atom and H2 (HB-HC) molecule are on a line, shown in the diagram below.
The distance between HB and HC is r1 , initially set at 0.74 A, and the distance between HA and HB is r2, initially set as 2.74 A. Momentum of the atoms involved is given by p1 and p2. The trajectory along this path is as follows: we begin with the reactants (HA and HB-Hc), as HA approaches HB-Hc a reaction may occur (i.e HA-HB forms and HC dissociates) if the trajectory passes through the TS of the surface plot, to form products HA-HB and HC. The trajectory is “wavy” due to bond vibrations (HA-HB and HB-HC) and more straight at the TS where the inter-nuclear distances between HA, HB and HC are equal.
What value does the total gradient of the potential energy surface have at a minimum and at a transition structure? Briefly explain how minima and transition structures can be distinguished using the curvature of the potential energy surface.
The TS is the potential energy maxima on the minimum energy path (mep) from reactions to products. We can look for the TS along the surface plot by looking at it in 3D and seeing where dV/dr2 = 0 and d2V/dr22 < 0 (corresponding the the reactants moving up the potential energy surface, or to look at it another way increasing in potential energy) . Each point on the surface plot tells us the position of the set of atoms (HA, HB, HC), the contours indicate the potential energy at these points, that is the darker the contour the higher the potential energy. We can look for the products by seeing where dV/dr2 = 0 and d2V/dr12 > 0, a minima. By looking at the contour plots and surface plots we can visualize this along the trajectory.
Report your best estimate of the transition state position (rts) and explain your reasoning illustrating it with a “Internuclear Distances vs Time” screenshot for a relevant trajectory.
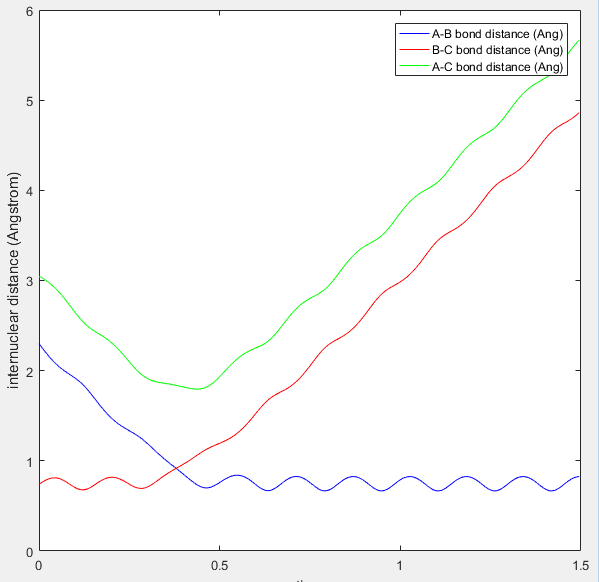
We can use an inter-nuclear distance vs. time (extent of reaction) plot to find r1 and r2 at the TS. We look at the crossing point where r1 (HB -HC) and r2 (HA - HB) are equal. The transition state position, trs, is estimated to be ~ 0.9 A at t=0.38 s.
(This is not the plot that you need to provide. You have to start a trajectory from the TS geometry with 0 initial momentum and see what happens to the distances vs. time Je714 (talk) 17:22, 8 May 2017 (BST))
Comment on how the mep and the trajectory you just calculated differ.
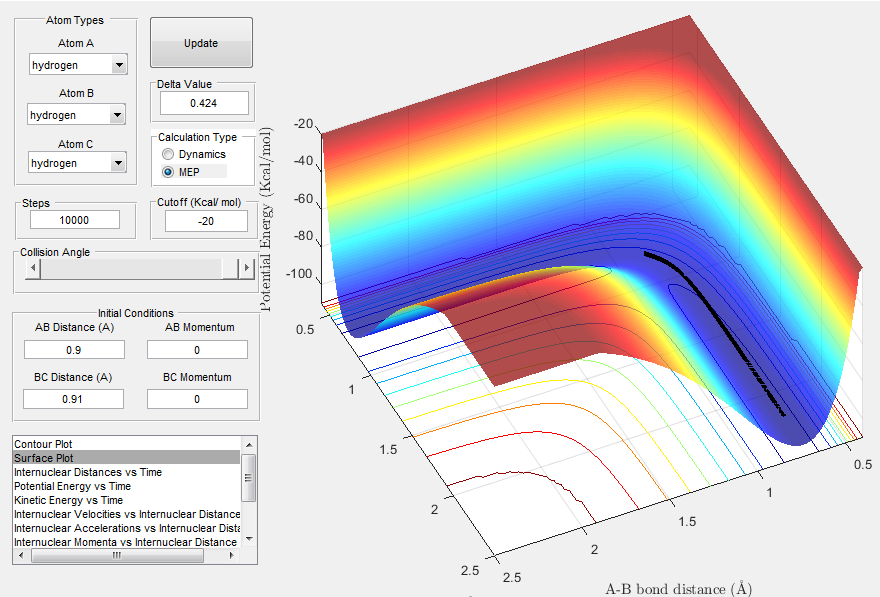
The minimum energy path of a bimolecular reaction is one that passes through a maximum on the potential energy surface, the maximum being the TS. Fig. 3 shows the mep (calculated with r1=rts + 0.01 and r2=r1 and p1=p2=0). We can see that the mep follows a straight path from the TS down to the products of minimum energy, without any oscillations.
(Your observations are correct, however you need to expand on why you don't observe these oscillations Je714 (talk) 17:22, 8 May 2017 (BST))
Complete the table by adding a column reporting if the trajectory is reactive or unreactive. For each set of initial conditions, provide a screenshot of the trajectory and a small description for what happens along the trajectory.
(You haven't provided the screenshots for every setting to prove your observations Je714 (talk) 17:22, 8 May 2017 (BST))
In some cases HA will come close to colliding with HB-HC but may just bounce off or not reach HB-HC , an unreactive trajectory, in other cases we may overcome a barrier and form the product HB-HA, a reactive trajectory. The barrier is the TS and can be overcome by changing the momentum of HA and HB-HC. A negative value of momentum is associated with a velocity that decreases the interatomic distance (e.g. between HA and HB as they come closer together).
We can investigate the effect of momenta on the reaction to determine whether the trajectory is reactive or unreactive. This is achieved by retaining the intial positions r1 and r2 (set to r1 = 0.74 A and r2 = 2.00 A) and changing the momenta p1 and p2 , the results are summarized in table 1.. Then by analyzing the inter-nuclear distance vs. time (extent of reaction) plots for each of these conditions we can look for a crossing point (where r1 (HB -HC) and r2 (HA - HB) are equal) which indicates the trajectory passing through the TS and reaching the products deeming the trajectory reactive.
| p1 (BC momentum) | p2 (AB momentum) | Trajectory |
|---|---|---|
| -1.25 | -2.5 | Reactive |
| -1.5 | -2.0 | Unreactive |
| -1.5 | -2.5 | Reactive |
| -2.5 | -5.0 | Unreactive (Barrier recrossing: the product forms but then converts back to reactants) |
| -2.5 | -5.2 | Reactive |
Table 1. shows how changes in dynamics deem a trajectory reactive or unreactive.
Here we can see that a small change in dynamics (cf. the last two rows of the table) can have a major effect on whether a trajectory is reactive or unreactive.
State what are the main assumptions of Transition State Theory? Given the results you have obtained, how will Transition State Theory predictions for reaction rate values compare with experimental values?
· TST assumes that there are no short lived intermediates and intermediates have enough time for their energies to be distributed in a Boltzmann distribution. 1
· TST is based on classical mechanics; the Born Oppenheimer approximation, thus atoms and molecules must collide with enough energy to overcome the high energy TS barrier. In quantum mechanics tunneling can occur which allows a reaction to progress passing straight through this barrier.2
· TST theory doesn’t consider the effect of temperature on the reactant molecules. H and H2 react by following a path of minimal energy on the potential energy surface. However, at higher temperature the molecules vibrate and motion can become complex leading to trajectories away from the saddle point as a consequence of the TS moving away from the saddle point as temperature rises. 3
(What about recrossing of the TS? You do observe and mention it in the previous exercise. In general, do you expect TST to over or under estimate rates? Je714 (talk) 17:22, 8 May 2017 (BST))
F-H-H system
In this system was consider an F radical colliding with a H2 molecule (HB-HC).
Classify the F + H2 and H + HF reactions according to their energetics (endothermic or exothermic). How does this relate to the bond strength of the chemical species involved?
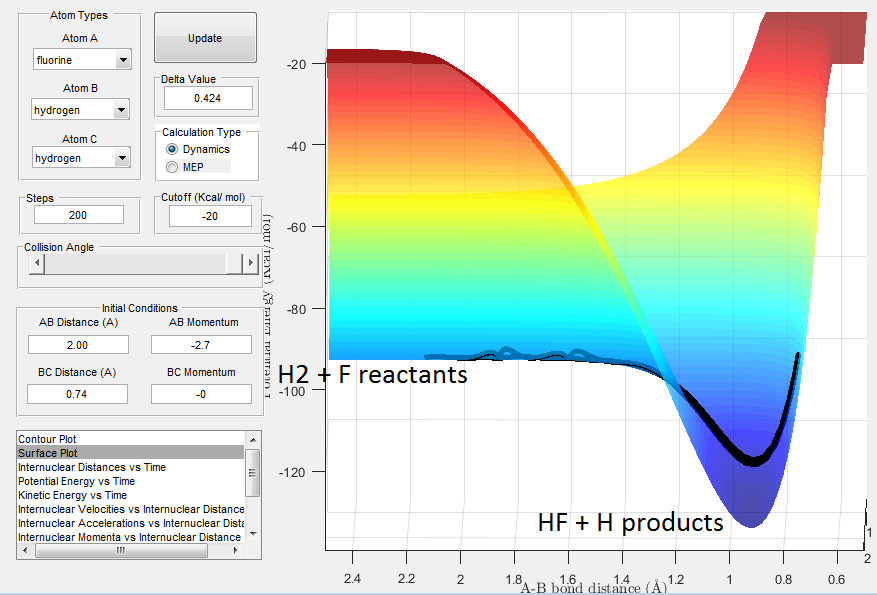
For this trajectory the distance and momentum parameters were set to: rF-HB=2.30 A, rHB-HC=0.74 A, pF-HB=-2.7 and pHB-HC=0.00. The trajectory is shown in Fig. 4 and corresponds to an exothermic, down hill reaction where the bond strength of the H-F bond (569 kJmol-1) > H-H bond (436 kJmol-1).
''Locate the approximate position of the transition state.''
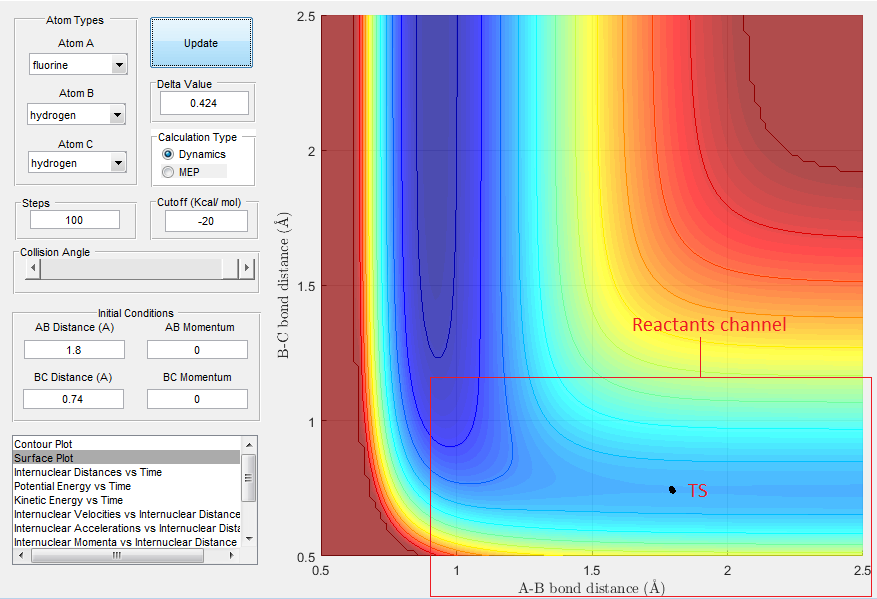
From Hammonds postulate it is predicted that the TS is very close to the starting material, i.e. where rHB-HC < rF-HB, as a result the reaction progresses quickly. The forward reaction is expected to have a low activation energy as it favours a strong H-F bond.From the surface plot, shown in Fig.5, the TS would be located in the region where the reactants channel narrows, shown in the blue. We can find the TS, where by keeping the momentum at 0 and varying the internuclear distances until we get to a position on the surface plot that is stationary. The rts was approximately found to be rHB-HC = 0.74 A and rF-HB = 1.80 A.
''Report the activation energy for both reactions.''
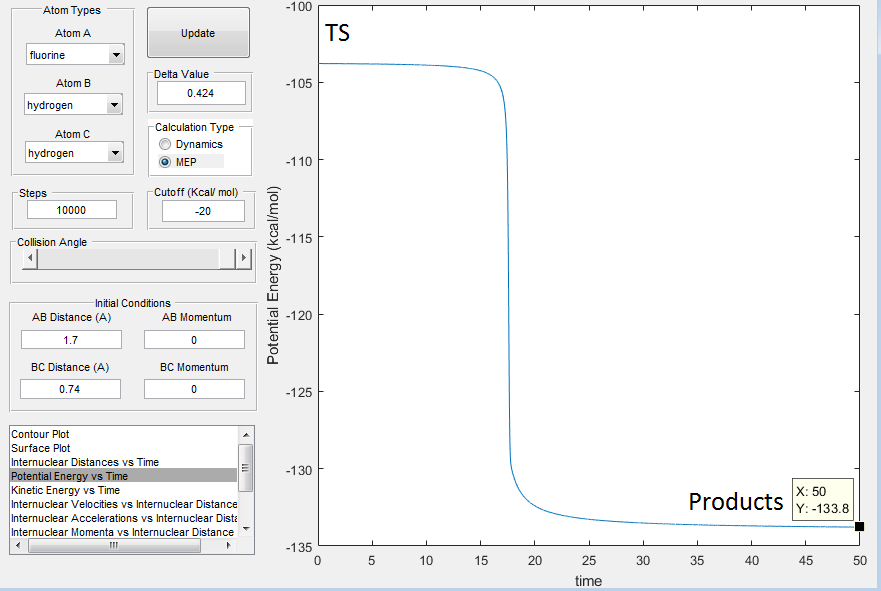
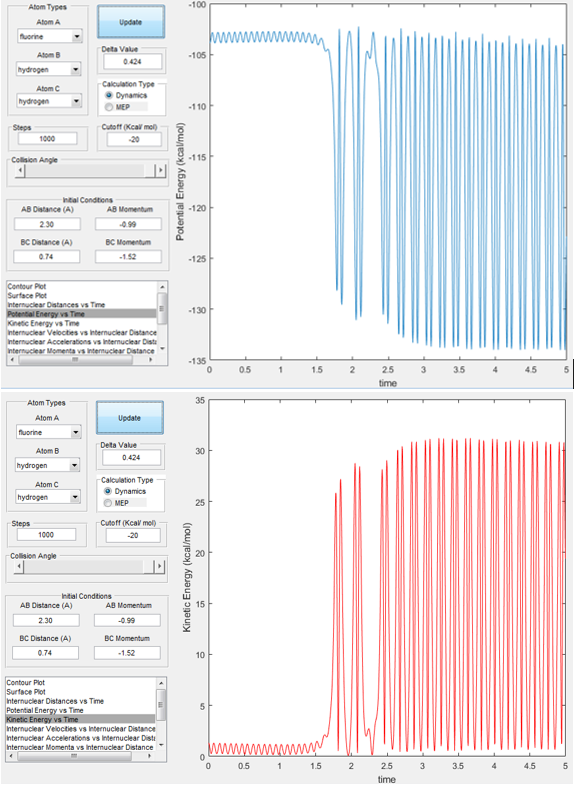
The approximate activation energies for the forward (exothermic) and backwards (endothermic) reactions from the surface plots of the reactions are shown in table 2. The activation energy has been found by a simple calculation of TS energy - reactants(or products) energy. The values tabulated into this equation have come from a potenial energy vs. time plot for both the forwards and backwards reactions. Fig. 6 shows the potential energy vs time plot for the backwards reaction.
| Reaction | Activation energy/ kcalmol-1 |
|---|---|
| Forward | 103.7-103.8 = 0.1 |
| Backward | 133.8 - 103.8 = 30.0 |
Table 2. Activation energies for the forward and backwards reactions of H2 + F.
''Identify a set of initial conditions that results in a reactive trajectory for the F + H2, and look at the “Animation” and “Internuclear Momenta vs Time”. In light of the fact that energy is conserved, discuss the mechanism of release of the reaction energy. How could this be confirmed experimentally?''
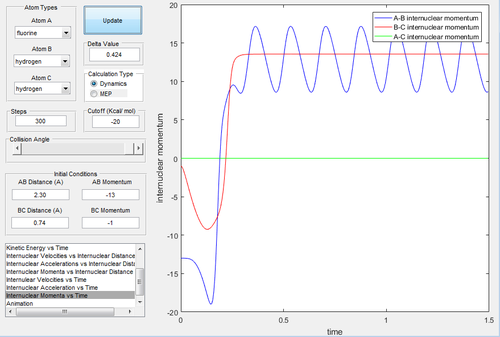
We would expect pHB-HC < pF-HB for the trajectory to be reactive as F is heavier than H, in this case the trajectory was found to be reactive when the conditions were set to: rHB-HC = 0.74 A and rF-HB = 2.3 A pHB-HC = -1 and pF-HB = -13. By analyzing a plot of intermolecular momenta vs. time, Fig 7. we can see a decrease in pF-HB as the the F-HB forms, it then oscillates after formation responding to vibrations. During the formation of this bond, kinetic energy is rapidly being converted into vibrational (potential) energy. The trajectory produced is shown in Fig. 8 and is rather unusual, the reactants don't pass directly through the TS but around it to through a number of higher energy intermediates and then down in energy to form products. Nonetheless the trajectory is reactive.
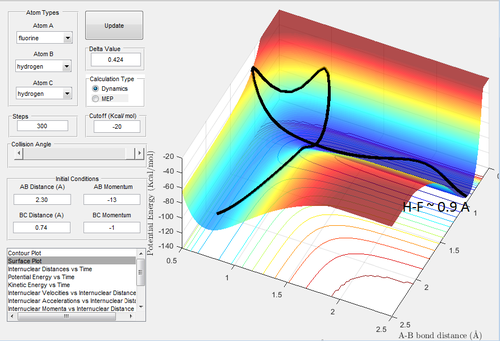
If we look at the kinetic energy vs. time plot and potential energy vs. time plot we see that there are not changes in energy during the course of the reaction the energy is conserved. This is indicated in Fig. 9 which shows that the potential energy vs. time plot is a mirror image of the kinetic energy vs. time plot. This reaction is an exothermic reaction and energy is released, this release of energy could be experimentally determined using calorimetry. Alternatively, when the F-HB bond forms kinetic energy has been successfully converted to potential energy. The vibrational energy of the H-F bond will be different from that of the H-H bond, therefore monitoring the change in vibrational energy by IR spectroscopy over the course of the reaction and looking for a difference in the vibrational energy would indicate the formation of a H-F bond.
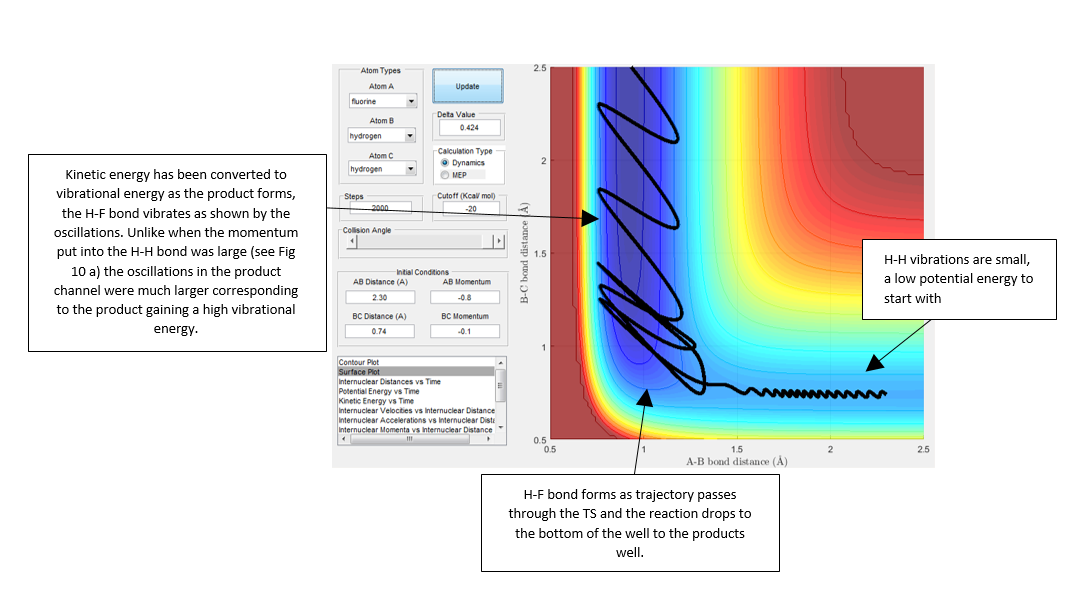
at the bottom of the well rHH = 0.74, with a momentum pFH = -0.5, and explore several values of pHH↵ in the range -3 to 3 (explore values also close to these limits). What ↵do you observe? Note that we pare putting a significant amount of energy↵ (much more than the activation energy) into the system on the H - H ↵vibration.''
Fig 10. shows the effect of changing the HB-HC momentum and how that effects whether the trajectory is reactive or not and how much vibrational energy the products gain (shown by the frequency of the oscillations in the products channel). Notice that at pHH = -2.54 and pHH =2.4 the trajectories are reactive and at pHH = 1.54 the trajectory is unreactive, i.e. the reactants do no have enough potential energy to cross the TS and fall into the product well.

- 'Setup initial conditions starting at the bottom of the entry channel, with very low vibrational motion on on the H - F bond, and an arbitrarily high value of pHH above the activation energy (an H atom colliding with a high kinetic energy).'
- 'Try to obtain a reactive trajectory by decreasing the momentum of the incoming H atom and increasing the energy of the H - F vibration.'
'The cases studied are an illustration of Polanyi's empirical rules. Discuss how the distribution of energy between different modes (translation and vibration) affect the efficiency of the reaction, and how this is influenced by the position of the transition state.'
From Fig. 12 we can see that by setting the conditions to rH-H=2.3 A, rH-F=0.9 A (typical H-F bond length) and momentum values to pH-F=-0.1 and PH-H to -9.7 (H colliding at fast speed with H-F) deems the trajectory reactive, passing through high energy intermediates to reach the products channel (H-H, F).
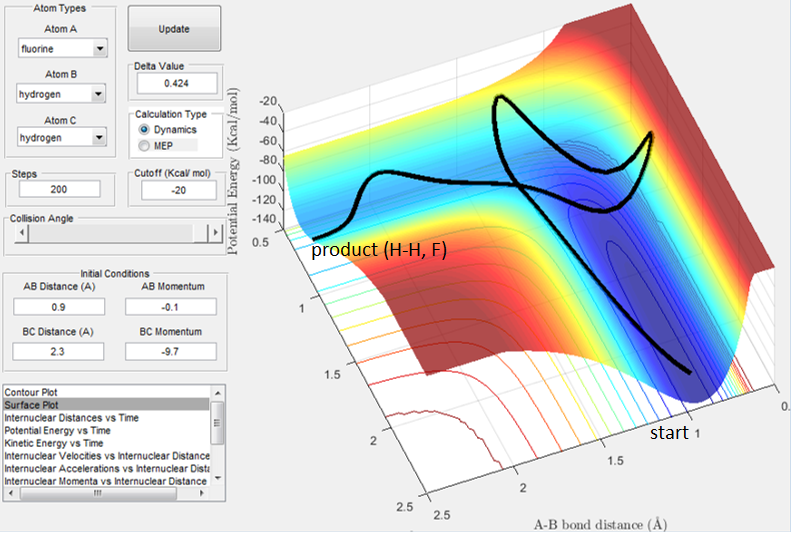
Polanyi's emprical rules state that vibrational energy is more efficient at promoting a late barrier reaction than tranlsational energy. 5 This is clearly shown in Fig. 13b, where a high vibrational energy (shown by the oscillations in the reactant well (the dark blue channel) ) allow the trajectory to pass over the high barrier TS to reach the products - as predicted by Polanyi's empirical rules. In this backwards reaction, translational energy is not the dominating factor to allow the trajectory to pass over the high energy barrier. This is shown in Fig. 13a. It would be interesting to try the reaction with the B and A atoms the other way around, i.e. H collides with F to form a new H-F bond, to see if that reaction trajectory passes through an early TS.

References
1. Henry Eyring, Journ. Chem. Phys., 1935, 3,pp. 107
2. N. Levine, Physical Chemistry, 6th Ed., Mc-Graw Hill, London, 2008
3. J.R.E.T Pineda et al, Philos Trans R Soc Lond B Biol Sci., 2006, 361(1472),pp. 1433–1438
4. T. L. Cottrell,The Strengths of Chemical Bonds, 2d ed., Butterworth, London, 1958
5. Z. Zhang et al, J. Phys. Chem. Let. , 2012, 3 (23), pp 3416–3419
