CID:01547604
General comment: there are no references given. This will become more and more important during your career, and at some point missing references will be treated as plagiarism. Fdp18 (talk) 15:16, 16 May 2020 (BST)
General comment: I see two issues based on this report. The first issue is one of general understanding - see the comments about the bond strength of HF vs HH, the selection rules, or the choice of trajectories in the last part. The second issue is expressing yourself. On many occasions while reading this report, I had the impression that you are trying to say the right thing. However, I had difficulties following you because of the wording you chose, missing definitions, or simply incorrect sentences. I recommend you give future reports to someone else to read, maybe find a 'report writing buddy' amongst your peers. If this person doesn't understand a sentence, then you need to rephrase it to be clearer. Fdp18 (talk) 16:00, 16 May 2020 (BST)
Molecular reaction dynamics
On a potential energy surface diagram, how is the transition state mathematically defined? How can the transition state be identified, and how can it be distinguished from a local minimum of the potential energy surface?
TS lies at maxima of energy profile diagram. Can find using second derivative <0 and ∂V(ri)/∂ri=0 What are V, ri? please define your quantities. Furthermore, there is more than one second derivative in this case. Do all of them have to be negative or just one? Fdp18 (talk) 15:14, 16 May 2020 (BST)
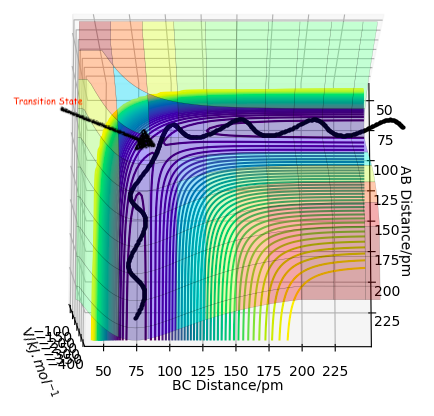
this is the transition state.
Hammond's postulate: TS bond lengths resemble Reactant or Product depending on whether reaction is exothermic or endothermic respectively, since it's closer in E to them. In this case TS is symmetrical, therefore expect AB = BC at TS. We can distinguish it from a minimum point using a saddle point curve. What is a saddle point curve? A saddle point is zero-dimensional. Fdp18 (talk) 15:17, 16 May 2020 (BST)
Where as we move along one direction this gives a negative curvature, whilst movement in the orthogonal direction gives a positive curvature, where curvature is found by the second derivative.
The wavy black line shows the trajectory represents the minimum energy, where the transition state is the saddle point.
This line might be one of the dynamics trajectories with lower total energy, but it is not the minimum energy pathway - which I can see from the vibration. Furthermore, the mathematical transition state will most likely not be encountered here - thus, the indicated position is only a guess for the transition state / saddle point. Fdp18 (talk) 15:19, 16 May 2020 (BST)
Report your best estimate of the transition state position (rts) and explain your reasoning illustrating it with a “Internuclear Distances vs Time” plot for a relevant trajectory.
Via hammond's postulate: TS bond lengths resemble Reactant or Product depending on whether reaction is exothermic or endothermic respectively, since it's closer in E to them. In this case TS is symmetrical, therefore expect AB = BC at TS as seen in the Figure below.
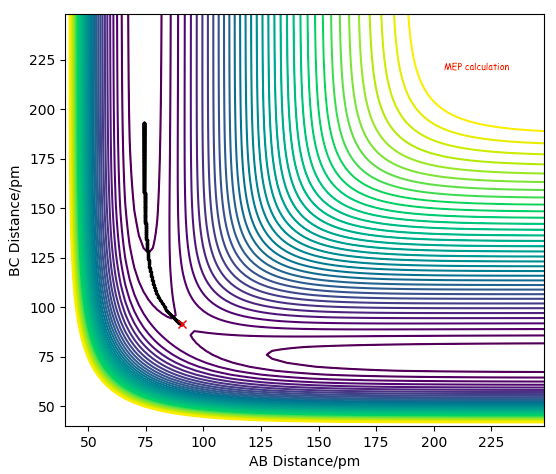
 BC=AC= 90.8 pm
The Force(r)=-dE/dr, therefore since at the TS the gradient = 0 the F=0 at the TS. Using forces starting from large distances apart e.g. AB=BC=230 pm (where p1=p2=0) we see the F= -1.759, suggesting that the particles are too far apart to react. Where the sign suggests attraction and repulsion for a negative and positive force respectively.
Reducing the distance to 100, then to 90 pm, we see an increase in force from -1.166 to +0.132 respectively. This illustrates that within this region the Force crosses zero, hence the interaction between the particles is equal, therefore this is the TS=90.8 pm.
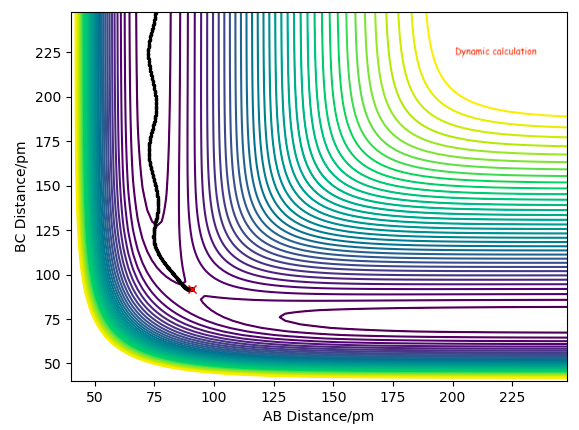
We can see that MEP calculation doesn't provide us a realistic view of the atom motion and doesn't show vibrational modes compared to the dynamic calculation below.
Changing the initial TS distance (AB=BC=90.8 pm) to nudge towards the products, i.e. BC=91.8, causes the products to form, as seen in the momentum/time plot where the AB momentum oscillates at 3.21, whilst BC momentum plateaus at 5.07. Distance/time calculations show AB oscillates at 74.02, whilst BC increases to 352.63.
Adjusting the initial geometry to AB=91.8 from AB=BC=90.8 nudges towards the reactants, hence reactants form. AB plateaus at 5.07, BC oscillates at 3.21. Distance/time calculations show BC oscillates at 74.02, whilst AB increases to 352.63.
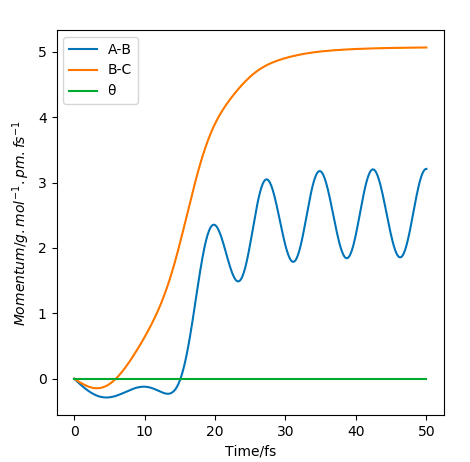 Momentum/time plot showing products forming.
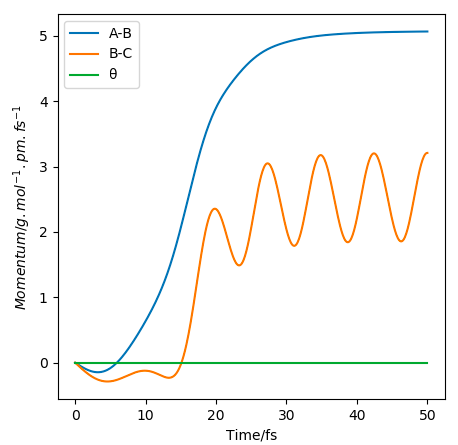 Momentum/time plot showing reactants forming.
A calculation where the initial positions correspond to the final positions of the trajectory you calculated above, the same final momenta values but with their signs reversed.
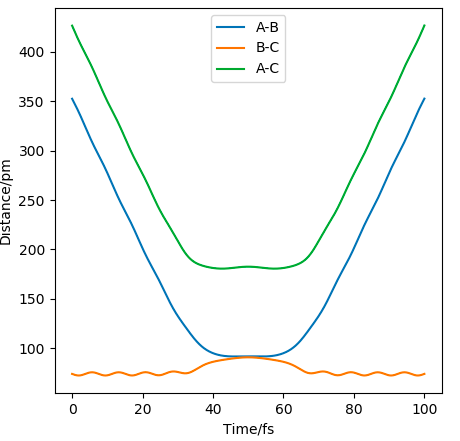
The distance/time graph where AB=74.02 and BC=352.63 and momentum = -5.07 and -3.21 respectively, shows that initially BC comes together to AC and then moves away as doesn't have enough energy to overcome the TS and rolls back down to the products.
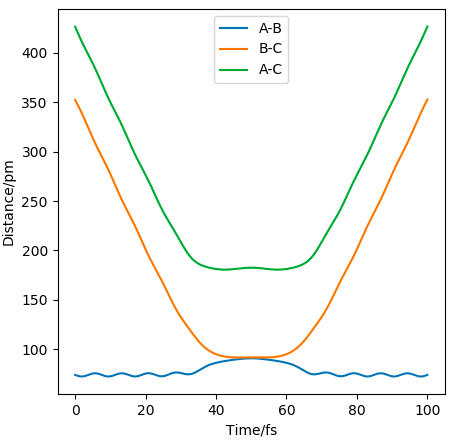
For the other situation the same thing happens as above but in reverse, since the E isn't enough to reach the TS, so goes back.
| p1/ g.mol-1.pm.fs-1 | p2/ g.mol-1.pm.fs-1 | Etot | Reactive? | Description of the dynamics | Illustration of the trajectory |
|---|---|---|---|---|---|
| -2.56 | -5.1 | -414.280 | YES | There is enough Kinetic Energy to overcome the activation energy and the transition state to break the BC bond and therefore form the AB bond, as seen in the contour plot to the right. The oscillatory pathway after the transition state shows the excess vibrational energy going to the AB bond, hence products have formed. | 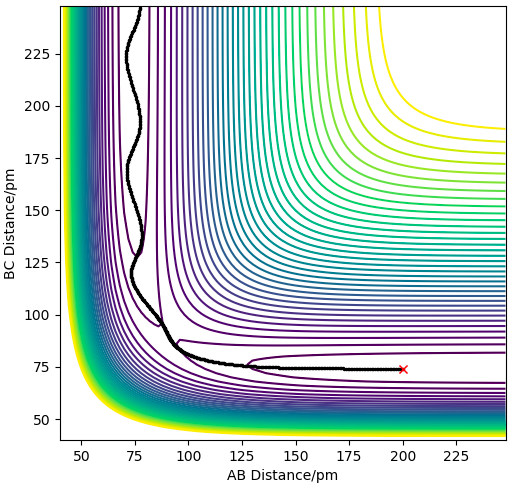
|
| -3.1 | -4.1 | -420.077 | NO | Not enough energy is supplied to overcome the activation energy barrier so the transition state is not reached and the reactants (BC) are reformed. | 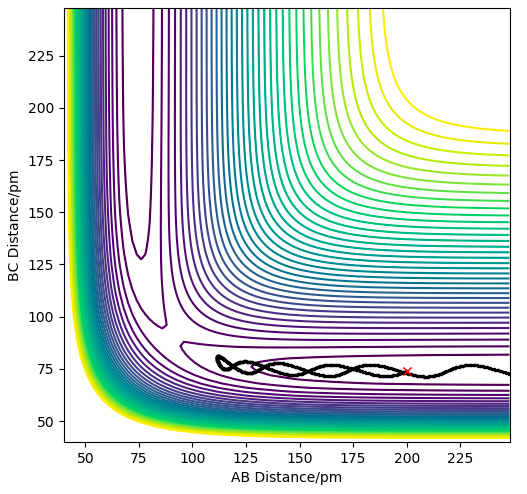
|
| -3.1 | -5.1 | -413.977 | YES | There is enough Kinetic Energy to overcome the activation energy and the transition state to break the BC bond and therefore form the AB bond, as seen in the contour plot to the right. The oscillatory pathway after the transition state shows the excess vibrational energy going to the AB bond, hence products have formed. | 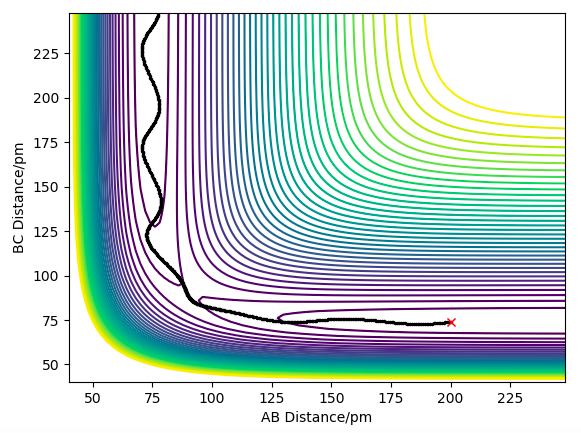
|
| -5.1 | -10.1 | -357.277 | NO | Enough energy is given to reach the transition state, and the products start to form, but the AB bond has extra vibrational energy therefore it causes the trajectory to recross the barrier and therefore reform the products. This barrier recrossing, is a violation of transition state theory, described below. | 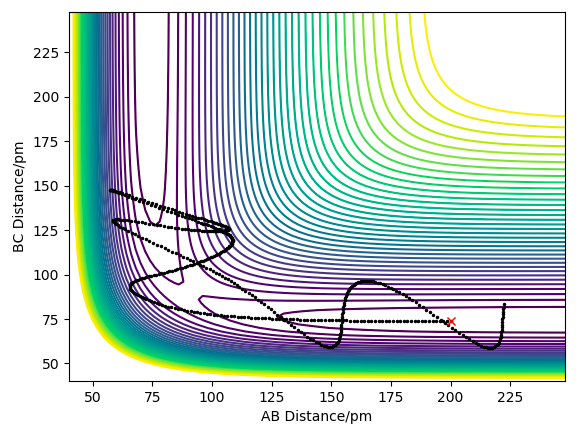
|
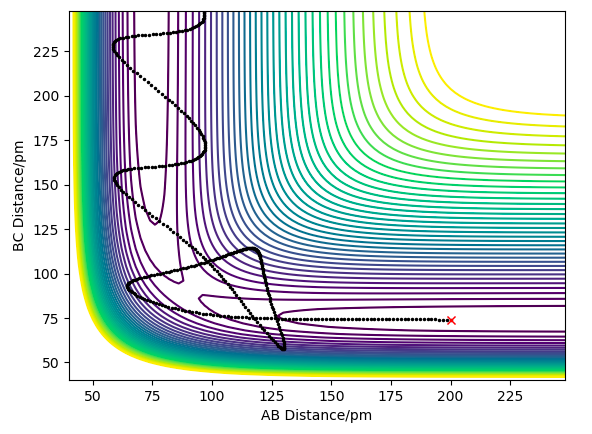
| -5.1 | -10.6 | -349.477 | YES | Kinetic Energy supplied is enough to overcome the activation energy, and the transition state, to break the BC bond and therefore form the AB bond, as seen in the contour plot to the right. But here there is even more energy supplied, which is why the trajectory circles round the transition state area, moving to a higher potential energy surface, Careful with wording: The potential energy surface is always the same - you can't leave it. Fdp18 (talk) 15:32, 16 May 2020 (BST)
before forming the products. The oscillatory pathway after the transition state shows the excess vibrational energy going to the AB bond, hence products have formed. |
|
Given the results you have obtained, how will Transition State Theory predictions for reaction rate values compare with experimental values?
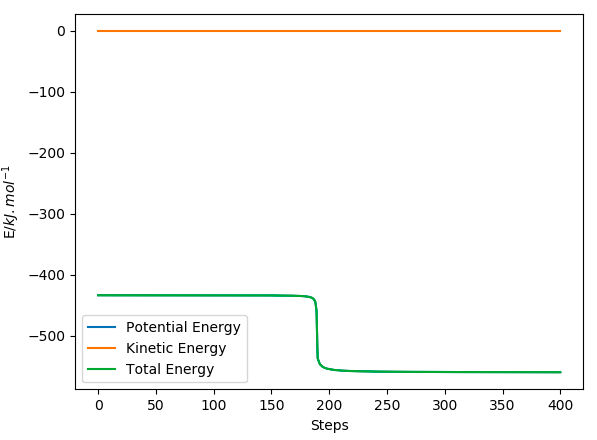
The Transition State Theory (TST) assumes rate constant is proportional to temperature and the Boltzmann constant. As temperature is increased, the velocity of particles is also increased proportionally, hence the Kinetic Energy (KE) of the reactants and rate(TST) increases. TST has many assumptions, the main one being that all collisions with KE > Ea will result in a successful reaction. Therefore once collisions occur, and reactant trajectory reaches the TS and the products then form. However as seen by the graph below, and in the penultimate table result, we see that the trajectory crosses the TS, forms the products, then recrosses the TS to re-form the reactants.
 This barrier recrossing is because once the products form, they have excess vibrational energy causing them to roll back to the reactants. Therefore TST overestimates the rate of this bimolecular reaction, since assumes all reactions go to completion, but experimentally, this violates the assumption.
Another assumption of TST is that it ignores Quantum Tunnelling and so motions along the reaction coordinate are treated classically. Ignoring the tunnelling effect therefore underestimates the TST, but since this is only a small effect compared to barrier recrossing, we see that TST is mainly an overestimate of rate.
EXERCISE 2: F - H - H system
By inspecting the potential energy surfaces, classify the F + H2 and H + HF reactions according to their energetics (endothermic or exothermic). How does this relate to the bond strength of the chemical species involved?
For the F + H2 reaction, we can see from the Potential energy surface plot that we have an exothermic reaction since our reactants (H-H) are at a higher energy than the products (H-F). This suggests that the H-H bond is stronger than the H-F bond strength, since its higher in energy. This is further confirmed by Hammond's postulate which says that the transition state resembles the reactants and products depending on how close it is in E to either of them. Since from the graph we can see the reactants are higher in energy compared to the products, we have an early transition state hence this is an exothermic reaction.
It is correct that H2+F -> HF+H is exothermic. Which bond is stronger then? Think about what 'high in energy' means - does having a lot of (excess) energy make a system stable or not? Fdp18 (talk) 15:36, 16 May 2020 (BST)
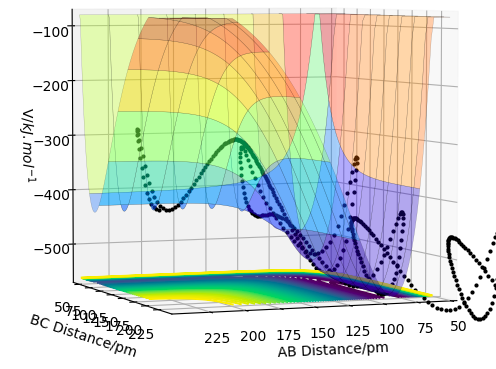 Surface plot showing endothermic reaction of HF +H.
Locating the transition state for this H2 + F reaction cannot be done the same way as for the homonuclear diatomic reaction for H2 + H, since the bond lengths will not be equal at the transition state. We therefore have to find the saddle point on the contour plot for this exothermic reaction, by adjusting the AB bond length, keeping the BC bond length consistent at 74 pm. This is because the transition state must be early, so adjusting the parameters via internal bisection, gives us the transition state where AB= 181.4 pm, BC=74 pm and the force is close to zero at +0.004 kJ/mol/pm, as seen in the contour plot below.
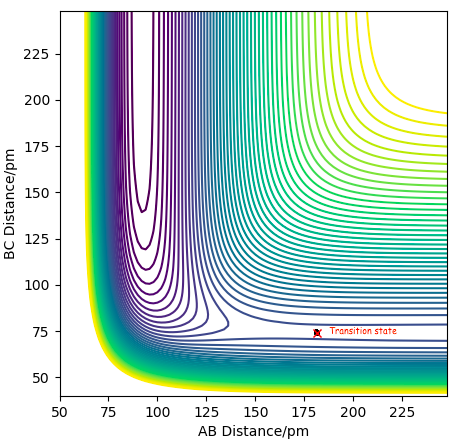 Contour plot showing the transition state for the F + H-H reaction at BC= 74 pm and AB = 181.4 pm.
The activation energy is found by finding the difference in energy between the transition state maxima (-433.942 kJ/mol) and the reactant energy minima. This is done by adjusting the AB distance from the initial TS trajectory in the direction of the reactants by increasing AB more and more until we get to the reactant energy, keeping BC the same at 74 pm. Since MEP calculations give us the closest energy minima, which should be the reactants of an exothermic reaction, we can then find the reactant minima by increasing the AB to 181.9 pm. The activation energy for this is therefore 1.18 kJ/mol and the steps used were 4000. By zooming into the Energy/ time plot for these parameters shows that there is an initial drop in gradient as seen in the plot, and this carries on decreasing giving a total activation energy of 1.18 kJ/mol. I do not see any drop at all in this figure - consider changing your y-axis. Fdp18 (talk) 15:43, 16 May 2020 (BST)
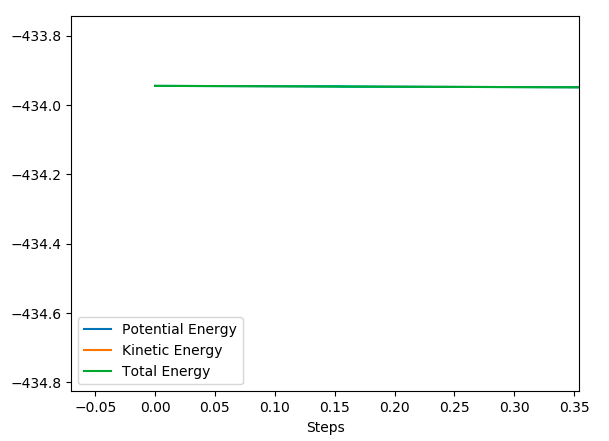 Energy/time plot for H2 + F reaction showing the activation energy via the slight negative gradient.
For the H + HF reaction, we can see from the Potential energy surface plot that we have an endothermic reaction since our reactants (H-F) are at a lower energy than the products. This suggests that the H-F bond is weaker than the H-H bond strength, since its lower in energy. see comment above - this part is wrong. Fdp18 (talk) 15:43, 16 May 2020 (BST)
Via Hammond's postulate since from the graph we can see the reactants are lower in energy compared to the products, we have a late transition state hence this is an endothermic reaction.
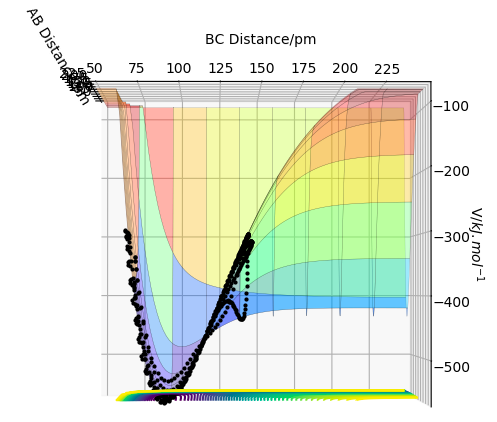 Surface plot showing endothermic reaction of HF +H.
To locate the transition state for the HF + H reaction we have to find the saddle point on the contour plot. Using Hammond's postulate since this is an endothermic reaction, the products resemble the transition state and so the transition state bond length resembles the bond length of the product (H-H=74 pm). So by adjusting the BC bond length, keeping the AB bond length consistent at 74 pm until the forces along both bonds are close to zero gives us the transition state where AB= 74 pm, BC=181.4 pm and the force at +0.002 kJ/mol/pm, as seen in the contour plot below.
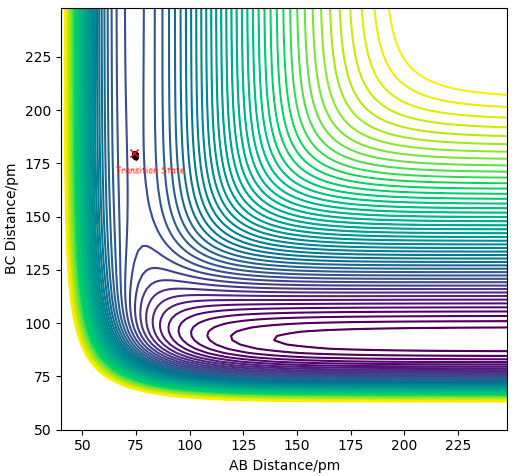 Contour plot showing the transition state for the HF + H reaction at BC= 181.4 pm and AB = 74 pm.
The activation energy is found by finding the difference in energy between the transition state maxima (-433.942 kJ/mol) and the reactant energy minima which is much lower than for the previous reaction. This is done by adjusting the AB distance from the initial TS trajectory in the direction of the reactants by decreased BC more and more until we get to the reactant energy, keeping AB the same at 74 pm. Since MEP calculations give us the closest energy minima, which should be the reactants of an endothermic reaction, we can then find the reactant minima by decreased the BC to around 179 pm. The activation energy for this is therefore 124.62 kJ/mol and the steps used were 400.
Energy/time plot for HF + H reaction where the activation energy is seen by the steep drop in energy.
The values are correct. What I cannot see here is that you understood that the 'two' transition states are the same. Fdp18 (talk) 15:45, 16 May 2020 (BST)
Identify a set of initial conditions that results in a reactive trajectory for the F + H2, and look at the “Animation” and “Momenta vs Time”. In light of the fact that energy is conserved, discuss the mechanism of release of the reaction energy. Explain how this could be confirmed experimentally.
The reactive trajectory chosen was AB =225, BC= 74, and where the momentum was -4 and -11 respectively. The animation confirmed this was a successful reactive trajectory. Energy is comprised of and released in the form of vibrational and translational energy, and the mechanism of release in this reaction is seen via the Momentum/ time plot seen below. We see that initially AB have no vibrational energy, whilst BC do, shown by the oscillations on the graph. As the reaction proceeds we see there is a convergence at around -7.28, after which translational energy of the reactants is transferred to vibrational energy, and vice versa. This is can be seen where the BC line plateaus, suggesting it has all translational energy now.
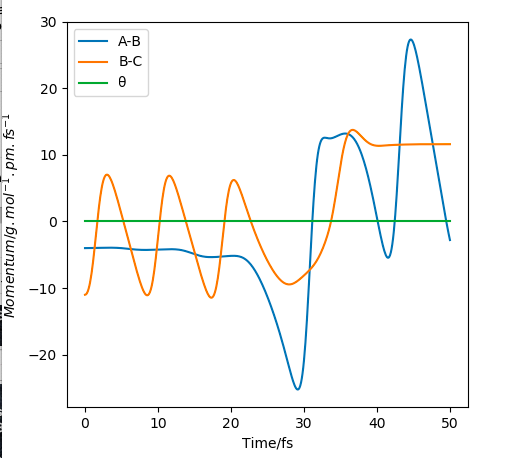 Momentum/time plot for H2 + F reaction.
This however could be more accurately confirmed via experimental analytical techniques such as IR spectroscopy. Since one of the selection rules state that only molecules which experience a change in dipole will be IR-active, and as the H-H reactant is not IR active, we should not see any vibrational bands in IR, i.e. they populate the ground state only. The product (H-F) however does possess a dipole moment, and therefore higher vibrational exited states will be populated, giving evidence of overtones. This therefore suggests that the energy has been distributed as vibrational energy for the products and translational energy to the H atom.
The selection rules don't forbid higher vibrational states to be populated - they just forbid the transition between them to take place.Fdp18 (talk) 15:48, 16 May 2020 (BST)
An H2 + F trajectory where AB=225, BC=74, and the momenta are -1 and -5.1 respectively show that no reaction takes place even though we have supplied the reaction with energy in excess of the activation energy, as seen in the contour plot below. This supports the theory from Hammond's postulate and Polanyi's rules where since this is an exothermic reaction, and so has an early transition state which resembles the reactants, translational energy is more efficient to lead to a successful reaction. This reaction has energy in the form of vibrational, which does not lead to a successful reaction due to the early barrier.
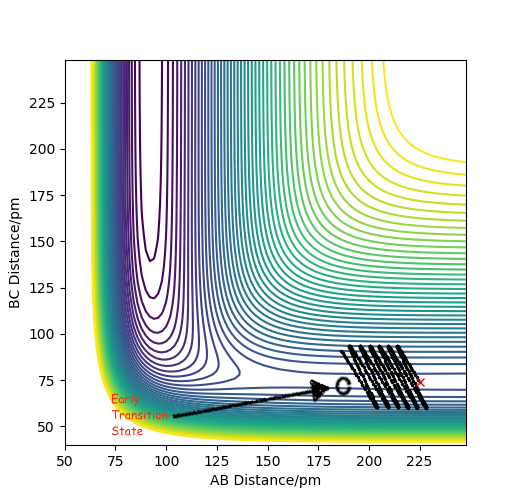 Contour plot showing an unreactive trajectory for the H2 + F reaction due to an early barrier.
On reducing the momentum of H-H further to 0.2, and the AB momentum to -1.6, we have reduced the vibrational energy even more, suggesting that the reaction should be successful, however can see from the plot below, that there is still not enough translational energy to overcome the early barrier, hence this trajectory is unreactive.
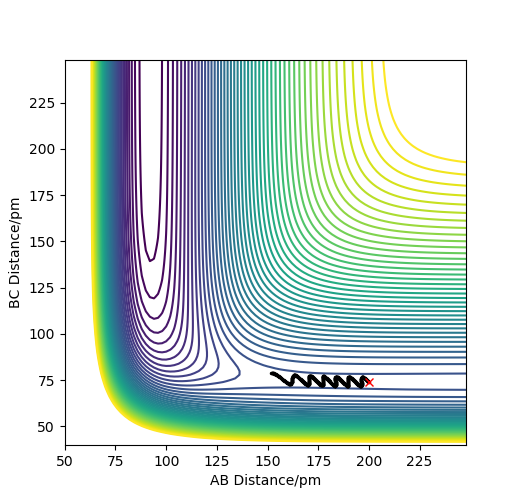 Another contour plot showing an unreactive trajectory for the H2 + F reaction due to an early barrier.
There is an important comment to be made here, which applies to both figures above. Your trajectories are too short - they just represent a H2 diatomic molecule slowly approaching a fluorine atom. However, since the trajectory ends before the 'interesting' region (i.e. the region of the transition state) is reached, you cannot draw any conclusions from them. I am not saying that the conclusions you have drawn are wrong, I'm just saying that you cannot decide yet. Is is like with a 'classic' organic synthesis: you can't say that the synthesis didn't work if you didn't even try to mix the reagents. Fdp18 (talk) 15:53, 16 May 2020 (BST)
An HF + H trajectory where AB=74, BC=200, and the momenta are -2 and -0.2 respectively sat the bottom of the entry channel, with low vibrational motion on on the H-F bond, and high value for the H atom shows that no reaction takes place even though we have supplied the H atom with a lot of kinetic energy, as seen in the contour plot below. This also supports the theory from Hammond's postulate and Polanyi's rules where since this is an endothermic reaction, and so has a late transition state which resembles the products, vibrational energy is more efficient to lead to a successful reaction. The H-F bond has more energy in the form of translational, which does not lead to a successful reaction due to the late barrier.
 Contour plot showing an unreactive trajectory for the HF + H reaction due to a late barrier.
On increasing the momentum of H-F to -0.2, and the AB momentum to -2, we have increased the vibrational energy of the bond whilst reduced it for the incoming H atom, suggesting that the reaction should be successful. This is confirmed by the plot below where there is enough vibrational energy to overcome the late barrier, hence this trajectory is reactive.
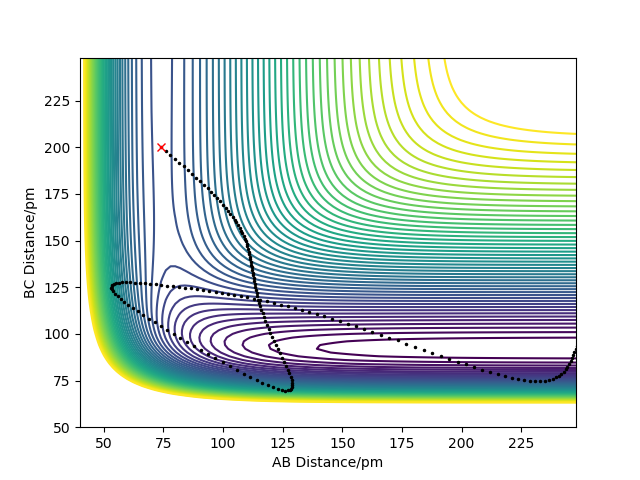 Another contour plot showing a reactive trajectory for the H-F + H reaction due to a late barrier.
You did attempt to answer the last question. However, the majority of the trajectories you provided are unsuitable for the purpose you present them for. Fdp18 (talk) 15:55, 16 May 2020 (BST)

