CG1417InorganicComp
BH3 Molecule
Optimisation of BH3
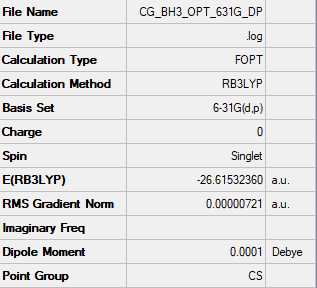
The following calculation was run as an optimisation type with B3LYP method using the 6-31G(d,p) basis set. The summary table is shown in Figure 1.
         Item               Value     Threshold  Converged?
 Maximum Force            0.000012     0.000450     YES
 RMS     Force            0.000008     0.000300     YES
 Maximum Displacement     0.000064     0.001800     YES
 RMS     Displacement     0.000039     0.001200     YES
 Predicted change in Energy=-1.126784D-09
 Optimization completed.
    -- Stationary point found.
The optimisation file is available here.
Ng611 (talk) 12:02, 5 June 2019 (BST) You've mixed up the results of your calculations here. We don't need the summary table or log file of your initial optimisation, just the final frequency calculation. You should also run the calculations separately, instead of using the FOPT function.
Another further calculation was run as a frequency type with B3LYP method using the 6-31G(d,p) basis set.
 Low frequencies ---   -7.5936   -1.5614   -0.0055    0.6514    6.9319    7.1055
 Low frequencies --- 1162.9677 1213.1634 1213.1661
BH3 |
The frequency file is available here.
From the calculation, the following stretching modes were observedː
| Mode | Wavenumber / cm-1 | Frequency | Symmetry | IR Active? | Type |
|---|---|---|---|---|---|
| 1 | 1163 | 93 | A2' ' | Yes | Out of plane bend |
| 2 | 1213 | 14 | E' | Yes | Symmetric Scissoring |
| 3 | 1213 | 14 | E' | Yes | Asymmetric rocking and scissoring |
| 4 | 2582 | 0 | A1' | No | Symmetric stretch |
| 5 | 2716 | 126 | E' | Yes | Asymmetric stretch |
| 6 | 2716 | 126 | E' | Yes | Asymmetric stretch |
Ng611 (talk) 12:04, 5 June 2019 (BST) Your two IR active modes at 1213 cm-1 are degenerate. Why assign them different modes?
Modes 1,2 and 3 all involved a change in bond angles rather than an elongation/shortening of bond length as observed in modes 4,5 and 6 and modes 1,2 and 3 had lower wavenumbers than modes 4,5 and 6 indicating that bond enlongation/shortening requires more energy to do than changing the bond angles in the molecule.
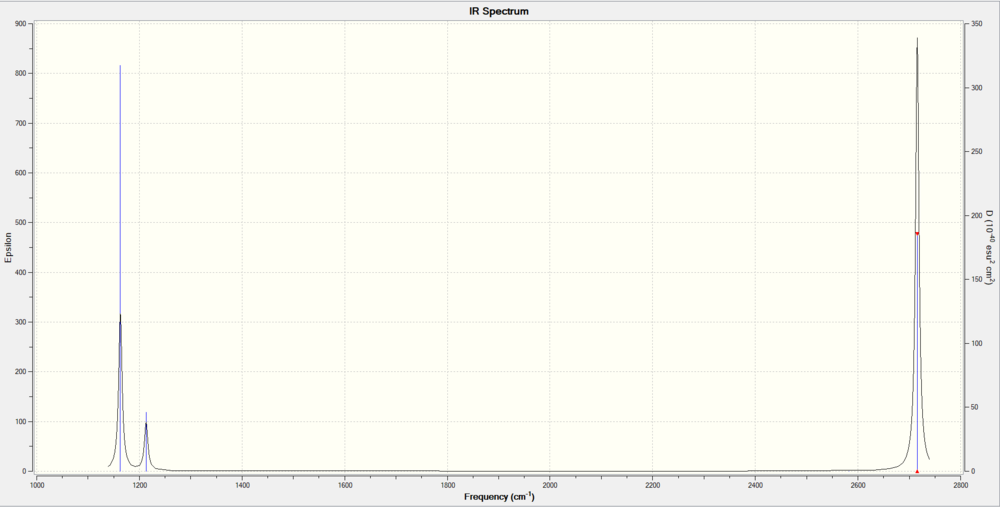
Six modes were observed which is to expected from the 3N-6 formula (N=4), of which 5 were IR active as they involved a change in dipole moment. This should mean five peaks are expected on the IR corresponding to modes: 1,2,3,5,6. However, since modes 5 and 6 and 2 and 3 are degenerate, only one peak shows at the corresponding wavenumber, hence only 3 peaks are observed at wavenumber = 1163 (1), 1213 (2,3), 2716 (5,6) cm-1. The IR spectrum is shown below in figure 2.
BH3 Molecular Orbitals
The molecular orbitals for BH3 were generated from the frequency file previously mentioned, and the following molecular orbital (MO) diagram was produced in Figure 3, showing both the MOs generated from the calculation along with the LCAOs (linear combination of atomic orbitals) predicted from theory. The diagram was obtained externally [1] with the MOs generated added along with the energy level for the 1s atomic orbital (AO) from the Boron atom and the LCAOs for the 3e' and 4e' MOs.
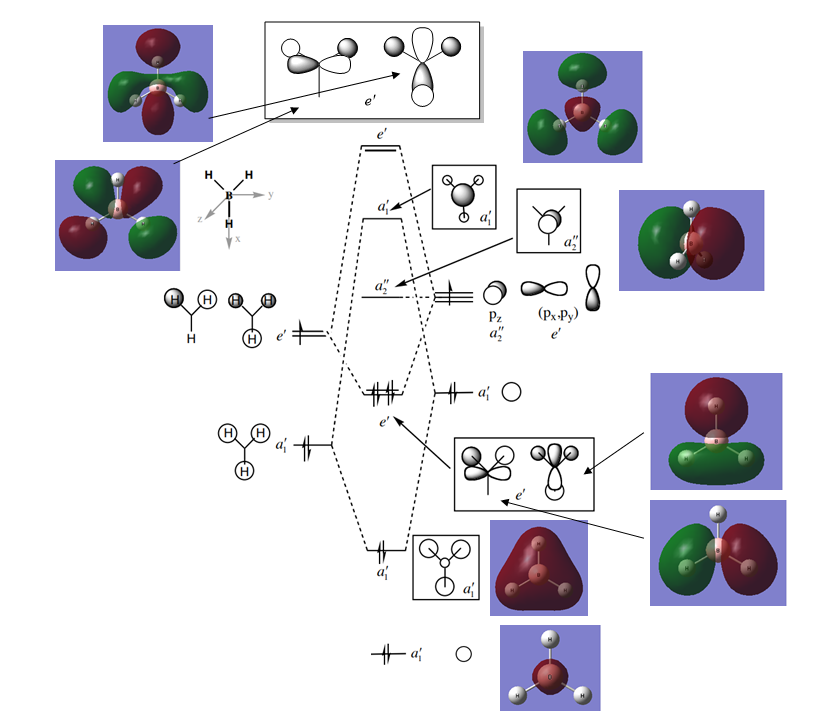
One key difference can be noticed between the LCAOs and the MOs and this is if two or more AOs or fragment orbitals (FOs) overlap the resulting MO can be difficult to accurately quantify at that point using MO theory, especially since the contribution from each of the AOs cannot be quantified without calcualtion. The MOs calculated accurately accounts for overlap and the resultant MO at each position correctly factors in the contribution from each AO. However, the general shape of the MO is very similar to that of the LCAO, so using molecular orbital theory to generate the inital LCAOs in a quick and reasonable way of predicting the resultant MO in a molecule.
Ng611 (talk) 12:08, 5 June 2019 (BST) Good explanation. Besides qualitative MO theory being unable to match the shape of the calculated orbitals exactly, are there any other differences?
NH3BH3
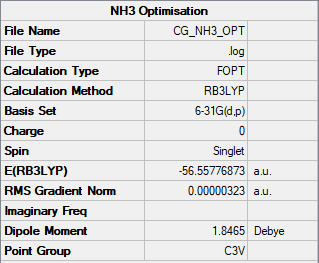
Ammonia, NH3 was analysed with an optimisation calculation type using a B3LYP method and the 6-31G(d,p) basis set. Figure 4 shows the summary table obtained from the calculation.
The item table is shown below to show the optimisation went to completion.
         Item               Value     Threshold  Converged?
 Maximum Force            0.000006     0.000450     YES
 RMS     Force            0.000004     0.000300     YES
 Maximum Displacement     0.000012     0.001800     YES
 RMS     Displacement     0.000008     0.001200     YES
 Predicted change in Energy=-9.843880D-11
 Optimization completed.
    -- Stationary point found.
Frequency analysis was then run using a B3LYP method and the 6-31G(d,p) basis set. Below are the low frequency linesː
 Low frequencies ---   -8.5223   -8.4750   -0.0038    0.0334    0.1918   26.4067
 Low frequencies --- 1089.7616 1694.1862 1694.1866
The frequency file can be found here.
NH3 |
Aminoborane, NH3BH3 then underwent an optimisation calculation using a B3LYP method and the 6-31G(d,p) basis set. Summary is shown below in figure 5.
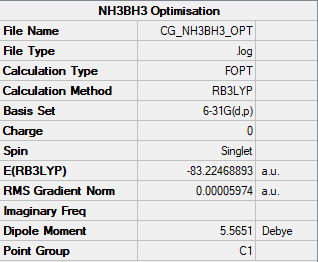
         Item               Value     Threshold  Converged?
 Maximum Force            0.000123     0.000450     YES
 RMS     Force            0.000058     0.000300     YES
 Maximum Displacement     0.000515     0.001800     YES
 RMS     Displacement     0.000296     0.001200     YES
 Predicted change in Energy=-1.635696D-07
 Optimization completed.
    -- Stationary point found.
A frequency analysis was run using a B3LYP method and the 6-31G(d,p) basis set. The following low frequency lines were obtainedː
 Low frequencies ---   -0.0615   -0.0457   -0.0066   21.6788   21.6847   40.5419
 Low frequencies ---  266.0173  632.3610  640.1362
The frequency file can be found here
NH3BH3 |
From the optimisation files, the energies of the following molecules were calculatedː
| Molecule | Energy / a.u |
|---|---|
| NH3 | -56.55777 |
| BH3 | -26.61523 |
| NH3BH3 | -83.22469 |
Ng611 (talk) 12:11, 5 June 2019 (BST) You've reported your BH3 value incorrectly. Your frequency table says its -26.61532 but you've put it down as -26.61523. This has led you to a value of about -135.7 kJ/mol, when the correct value is closer to -135.4. After rounding, this has led you to the wrong answer.
From this, the association energy between an NH3 molecule binding to a BH3 molecule can be calculated asː
This value for the dative B-N bond enthalpy is a plausible value for the association energy since it is the correct order of magnitude as expected. A typical C-C bond is around 350 kJmol-1 which shows the B-N bond enthalpy has the right order of magnitude and also shows that the bond is relatively weak and ammonia borane is less stable compared to isoelectronic ethane.
Ng611 (talk) 12:17, 5 June 2019 (BST) Cite your bond enthalpies!
NI3
An NI3 molecule underwent an optimisation calculation with a B3LYP method and GEN basis set. The summary from the calculation is in Figure 6.
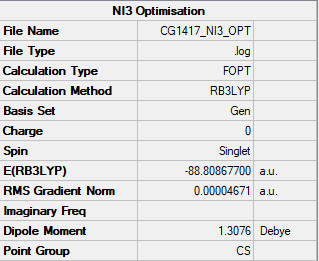
         Item               Value     Threshold  Converged?
 Maximum Force            0.000061     0.000450     YES
 RMS     Force            0.000037     0.000300     YES
 Maximum Displacement     0.000459     0.001800     YES
 RMS     Displacement     0.000285     0.001200     YES
 Predicted change in Energy=-3.108653D-08
 Optimization completed.
    -- Stationary point found.
Frequency analysis was then applied using a B3LYP method and 6-31G(d,p) basis set. Here are the low frequencies obtained:
 Low frequencies ---  -12.2077  -12.2011   -5.0177   -0.0040    0.0197    0.0795
 Low frequencies ---  100.8228  100.8235  147.0819
The frequency file can be found here.
NI3 |
The optimised N-I bond length was found to be 2.184 Å.
Ng611 (talk) 12:17, 5 June 2019 (BST) Good!
Ionic Liquids
[NMe4]+ and [PMe4]+ Optimisation
The [NMe4]+ cation was optimised using a B3LYP method and a 6-31G(d,p) basis set with the summary shown below in Figure 7.
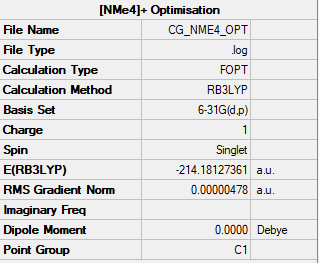
         Item               Value     Threshold  Converged?
 Maximum Force            0.000018     0.000450     YES
 RMS     Force            0.000004     0.000300     YES
 Maximum Displacement     0.000803     0.001800     YES
 RMS     Displacement     0.000241     0.001200     YES
 Predicted change in Energy=-1.282785D-08
 Optimization completed.
    -- Stationary point found.
Frequency analysis was also run on the molecule using a B3LYP method and 6-31G(d,p) basis set, below are the low frequencies for the moleculeː
 Low frequencies ---    0.0010    0.0011    0.0012   21.4055   21.4055   21.4055
 Low frequencies ---  188.2270  292.4306  292.4306
The frequency file can be found here.
Ng611 (talk) 12:18, 5 June 2019 (BST) You've attached an opt file here.
[NMe4]+ |
[PMe4]+ was optimised using a B3LYP method and 6-31G(d,p) basis set, with the summer shown below in Figure 8.
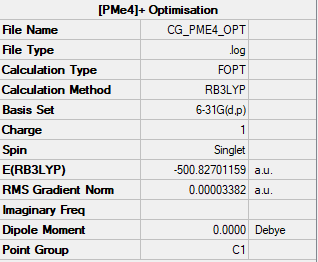
         Item               Value     Threshold  Converged?
 Maximum Force            0.000018     0.000450     YES
 RMS     Force            0.000004     0.000300     YES
 Maximum Displacement     0.000803     0.001800     YES
 RMS     Displacement     0.000241     0.001200     YES
 Predicted change in Energy=-1.282785D-08
 Optimization completed.
    -- Stationary point found.
Frequency analysis was run on the molecule using a B3LYP method and 6-31G(d,p) basis set, below are the low frequencies obtained.
 Low frequencies ---    0.0034    0.0038    0.0042   23.9917   23.9917   23.9917
 Low frequencies ---  159.7922  194.6080  194.6080
The frequency file can be found here.
[PMe4]+ |
Charge Distributions
The charge distributions of both optimised molecules were recorded and are shown in Figures 9 and 10.
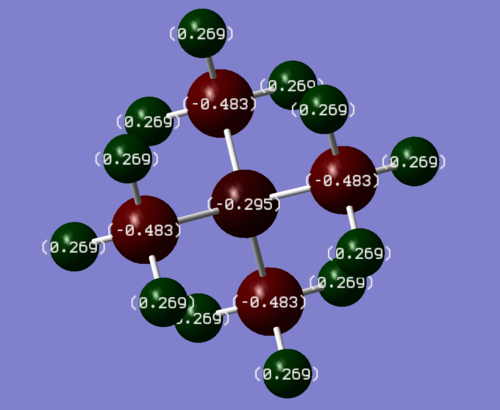
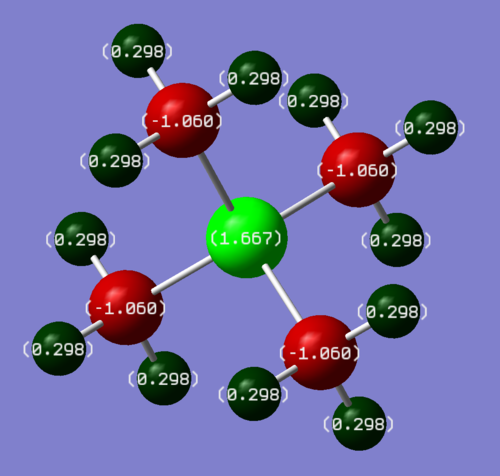
The charge on each of the methyl protons in both cations is similar with +0.269 C in [NMe4]+ and +0.298 C in [PMe4]+. The charges on the methyl carbons in both molecules differs more with -0.483 C in [NMe4]+ and -1.060 C in [PMe4]+, which means that there is a formal negative charge on each of the methyl carbons in [PMe4]+. The most significant difference between the charge distributions is the charge on the central atom in both molecules. In [NMe4]+, the central N atom has a charge of -0.295 C whereas in [PMe4]+, the central P atom has a charge of +1.667 C. The charge on the N atom is negative in [NMe4]+ and larger and positive in [PMe4]+. As a result of these charges, the P-C bond in [PMe4]+ is much more polarised and therefore weaker than the N-C bond in [NMe4]+. The strongly polarised P-C bond in [PMe4]+ is consistent with experiment, as the famous wittig reaction treats a carbon bonded to a phosphorus as a nucleophile (formal negative charge) and the weak P-C bond breaks easily in the reaction too.
Ng611 (talk) 12:23, 5 June 2019 (BST) You should also consider symmetry.
Classically, both cations are drawn with a formal positive charge on both the N and P atom which from the calculation is not found to be a truly accurate representation. The formal negative charge comes from VSEPR, with the nitrogen receiving receiving one electron from each covalent bond from it, which when combined with the core non-bonding electrons gives Nitrogen 6 electrons and a nuclear charge of +7, hence the Nitrogen has a +1 charge overall. From the calculation, in [NMe4]+, there is no positive charge present on the Nitrogen at all, instead it is all spread amongst the methyl protons, so in this respect the diagram is wrong.
Ng611 (talk) 12:20, 5 June 2019 (BST) NO! VSEPR is used to predict the geometry given the number of electron pairs in the molecule. What you probably mean is Lewis bonding, which does indeed predict a formal +1 charge on the nitrogen (which is incorrect).
Likewise, [PMe4]+ is commonly drawn with a formal positive on the Phosphorus charge due to VSEPR leaving the atom electron deficient by one in a similar manner to Nitrogen as mentioned earlier. However as the calculation shows, this formal charge is a much more accurate representation in comparison to that of [NMe4]+. The charge calculated is +1.667 C which is greater than one, however it is positive and so the typical drawing of [NMe4]+ using VSEPR is a somewhat accurate representation of the most important charge distribution in the molecule but still underestimates the actual charge present on the P atom.
LCAO Analysis
The first occupied MO chosen is MO 7, which is shown in Figure 11, likewise an LCAO diagram showing the combination of fragment orbitals from the methyl groups with the central Nitrogen atom is shown in Figure 12.
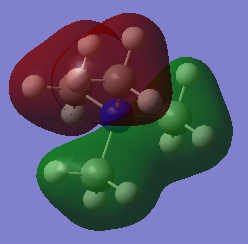
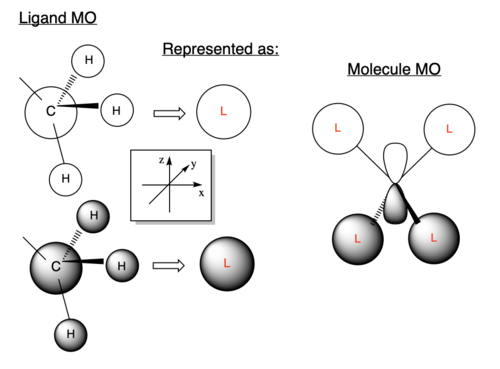
Figure 11 shows very strong bonding interactions between adjacent H 1s AOs with the 2s AOs of the methyl carbons as there is lots of electron density present in the internuclear region and a strong overlap between the two AOs with the same phase. Two adjacent methyl fragment orbitals with the same phase then experience bonding interactions with a 2pz AO of the Nitrogen atom, which are longer range interactions and the overlap is not directed very well but the interaction is bonding nonetheless. There is also one nodal plane that intersects the molecule which is an anti-bonding interaction between the two different regions of electron density with opposite phase. The node does not intersect any bonds and is therefore a weak antibonding interaction meaning that the strong bonding interactions outweigh this anti-bonding interaction and that the MO is bonding overall.
The second occupied MO chosen was MO 10 shown in Figure 13, and the LCAO diagram showing the combination of fragment orbitals is shown in Figure 14.
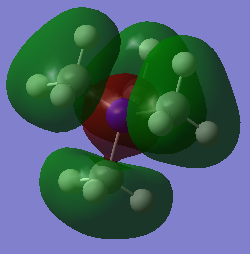
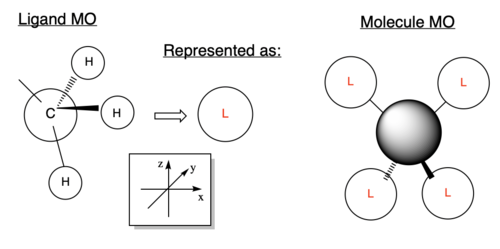
Figure 13 shows very strong bonding interaction between the H 1s AOs and the C 2s AO - there is a very strong overlap between the two AOs resulting in a strong bonding interaction. However, there is also an anti bonding interaction between each of the methyl fragment orbitals with the 2s AO of the Nitrogen atom. This anti-bonding interaction polarises electron density out of the internuclear region along the C-N bond making it unfavourable, however due to the amount of stronger bonding interactions in the methyl fragment orbitals, the MO is bonding overall.
The third MO chosen to analyse the fragment orbitals involved in forming it was MO 16, shown in Figure 15 and the LCAO diagram shown in Figure 16.
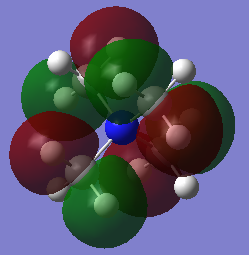
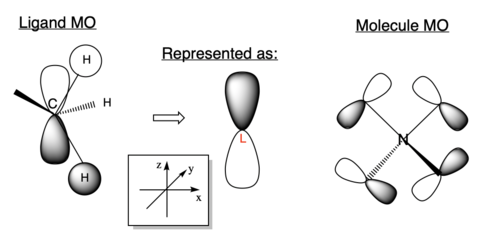
There is weak bonding character between the two 1s H AOs and the 2pz AO of the methyl carbon. The bonding interaction is weak because the overlap is not very well directed, resulting in a weak bonding interaction. There are also two nodal planes in the molecule, creating an antibonding interaction, however these all intersect atoms and not bonds meaning electron density is still retained within the internuclear regions, which is favourable meaning the nodes create weak anti-bonding character. Overall, due to the amount of weak bonding interactions in the fragment AOs and the weak anti-bonding interaction created by the nodal planes the MO is still bonding overall.
Ng611 (talk) 12:30, 5 June 2019 (BST) I like your LCAO, but your assignment of bonding/antibonding is totally off. Your second and third MOs you say are overall bonding-- I disagree with your second MO (but can see why you went the other way on it), but your third MO is definitely not bonding.
Ng611 (talk) 12:30, 5 June 2019 (BST) Consider labelling the key interactions in your diagrams rather than writing them out as text.
