CCL:01346889
Revision
Creating and optimising a BH3 molecule
Initially, a BH3 molecule was created in Gaussview and a B3LYP/3-21G optimisation was run in Gaussian. The final optimised structure was obtained.
The total energy for the optimised BH3 molecule is -26.36656 ± 0.0004 Hartrees.
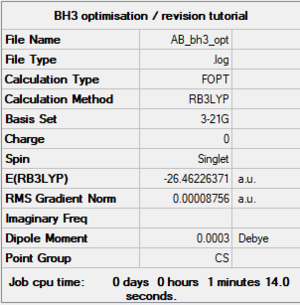
        Item               Value     Threshold  Converged?
Maximum Force            0.000217     0.000450     YES
RMS     Force            0.000105     0.000300     YES
Maximum Displacement     0.000919     0.001800     YES
RMS     Displacement     0.000441     0.001200     YES
Predicted change in Energy=-1.635268D-07
Optimization completed.
   -- Stationary point found.
First optimisation of the BH molecule |
Creating a better basis set
The calculations were now ran using a B3LYP/6-31G(d,p) basis set. The job converged properly. The total energy for this optimised structure was -26.61532 ± 0.0004 Hartrees.
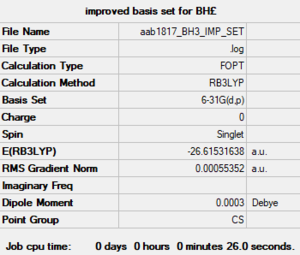
        Item               Value     Threshold  Converged?
Maximum Force            0.000012     0.000450     YES
RMS     Force            0.000008     0.000300     YES
Maximum Displacement     0.000064     0.001800     YES
RMS     Displacement     0.000039     0.001200     YES
Predicted change in Energy=-1.126784D-09
Optimization completed.
   -- Stationary point found.
Second optimisation of the BH molecule ran with an improved basis set. |
Frequency analysis of BH3
The improved molecule did not have D3h symmetry, hence some steps were carried out to force the symmetry onto the molecule.
B3LYP/6-31G(d.p.)
The final optimised molecule is thus:
Final optimised version of the BH3 molecule, used for frequency analysis. |
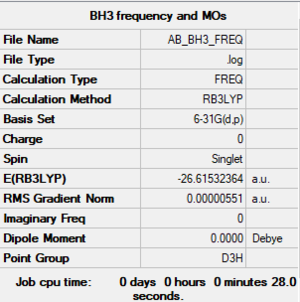
In the log file, the following can be read:
        Item               Value     Threshold  Converged?
Maximum Force            0.000217     0.000450     YES
RMS     Force            0.000105     0.000300     YES
Maximum Displacement     0.000919     0.001800     YES
RMS     Displacement     0.000441     0.001200     YES
Predicted change in Energy=-1.635268D-07
Optimization completed.
Low frequencies ---  -14.6858  -14.6818  -11.0436    0.0002    0.0165    0.3415
Low frequencies --- 1162.9492 1213.1220 1213.1222
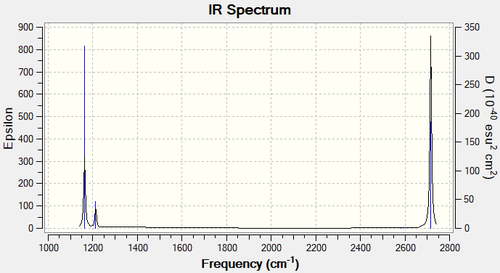
The vibrational analysis of the molecule indicates that there is a total of six vibrations: one at 1163 cm-1, one at 2583 cm-1, two degenerate ones at 1213cm-1, and two degenerate ones at 2716cm-1. The vibration at 2583cm-1 will not be shown on the infrared spectrum: firstly because it is IR inactive as there is no overall dipole moment change, and secondly because its infrared intensity is indicated to be zero.
Ng611 (talk) 14:52, 27 May 2019 (BST) Good explanation and good calculations!
| wavenumber (cm-1 | Intensity (arbitrary units) | symmetry | IR active? | type |
| 1163 | 93 | A2 | yes | out-of-plane bend |
| 1213 | 14 | E | very slight | bend |
| 1213 | 14 | E | very slight | bend |
| 2583 | 0 | A1 | no | symmetric stretch |
| 2716 | 126 | E | no | asymmetric stretch |
| 2716 | 126 | E | no | asymmetric stretch |
Indeed, when looking at the computed IR spectrum we observe three distinct peaks. The largest one corresponds to the 2716cm-1 vibrations, for which the individual intensity were summed up. The medium peak corresponds to the 1163cm-1 vibration and the smallest peaks corresponds to the 1213cm-1 vibration. This can be all observed in the figure below.
Molecular Orbitals of BH3
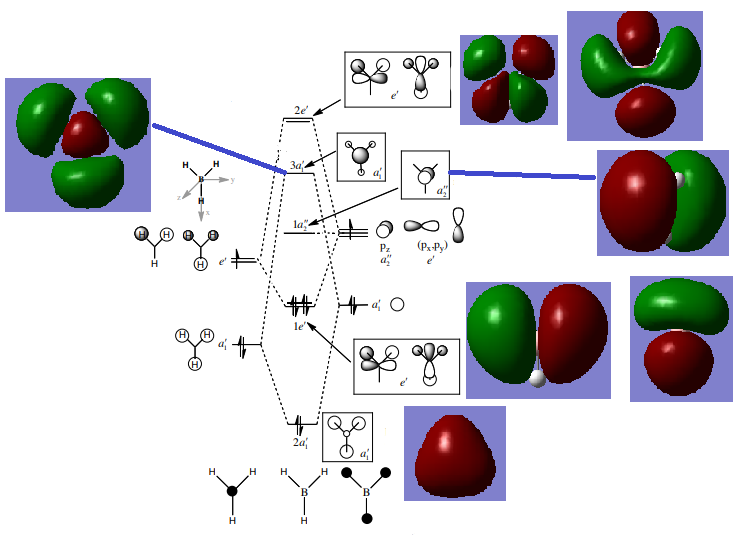
The biggest difference between the computed MOs and the LCAOs is that the former show the end result of the electron density, whereas the latter will show which are the contributors to that. MO theory and LCAOs are a good method to predict the overall shape of the MO and its bonding or antibonding characteristic, however more precise descriptions and understanding the computed/real MOs will provide more information as they merge the same phases together and cancel out parts where contributions of opposite phases are present.
Ng611 (talk) 14:53, 27 May 2019 (BST) Are there any there discrepancies you can see?
Ammonia Borane
NH3
B3LYP/6-31G(d,p)
Optimised NH3 molecule |
The energy of the molecule is -56.55777 ± 0.0004 Hartrees.
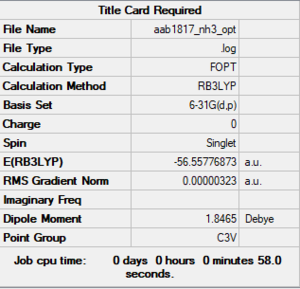
        Item               Value     Threshold  Converged?
Maximum Force            0.000006     0.000450     YES
RMS     Force            0.000004     0.000300     YES
Maximum Displacement     0.000012     0.001800     YES
RMS     Displacement     0.000008     0.001200     YES
Predicted change in Energy=-9.844603D-11
Optimization completed.
   -- Stationary point found.
Low frequencies ---   -0.0137   -0.0027    0.0007    7.0783    8.0932    8.0937
Low frequencies --- 1089.3840 1693.9368 1693.9368
NH3BH3
B3LYP/6-31G(d,p)
The energy of the molecule is -83.22469 ± 0.0004 Hartrees.
Optimised adduct molecule |
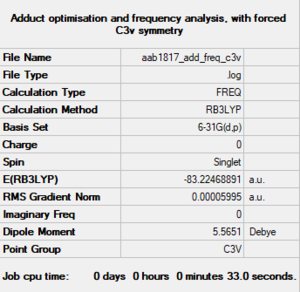
        Item               Value     Threshold  Converged?
Maximum Force            0.000122     0.000450     YES
RMS     Force            0.000058     0.000300     YES
Maximum Displacement     0.000531     0.001800     YES
RMS     Displacement     0.000296     0.001200     YES
Predicted change in Energy=-1.653992D-07
Optimization completed.
Low frequencies ---   -0.0251   -0.0030    0.0010   17.1202   17.1228   37.1150
Low frequencies ---  265.7788  632.2026  639.3473
Determining the energy of the bond
Thus we obtain: ΔE=E(NH3BH3)-[E(NH3)+E(BH3)]= -83.22469 -(-56.55777 -26.61532) = -0.05167 Hartrees that is -135.7 ± 5 kJ/mol
Ng611 (talk) 14:55, 27 May 2019 (BST) Your calculation is correct. However, if your uncertainty is 5 kJ/mol does it make sense to report your value to an accuracy of 0.1 kJ/mol?
Comparing this to a common bond such as C-C, which has an energy of 348 kJ/mol [2], this dative bond could be considered as weak.
Ng611 (talk) 14:55, 27 May 2019 (BST) Good comparison! Try not to use the web as a source though.
New
NI3 molecule
B3LYP/6-31G(d,p)LANL2DZ NI3
Optimised NI3 molecule |
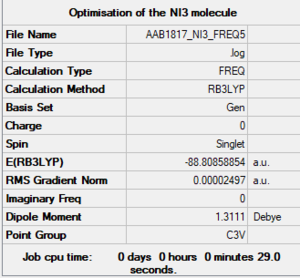
        Item               Value     Threshold  Converged?
Maximum Force            0.000049     0.000450     YES
RMS     Force            0.000025     0.000300     YES
Maximum Displacement     0.000435     0.001800     YES
RMS     Displacement     0.000221     0.001200     YES
Predicted change in Energy=-3.136136D-08
Optimization completed.
   -- Stationary point found.
Low frequencies ---  -12.6686  -12.6625   -6.2272   -0.0040    0.0189    0.0640
Low frequencies ---  101.0319  101.0326  147.3983
The optimised N-I distance computed is of 2.184 angstroms.
Project: Ionic liquids, designer solvents
[N(CH3)4]+ cation
B3LYP/6-31G(d,p)
Optimised N(CH3)4+ cation |
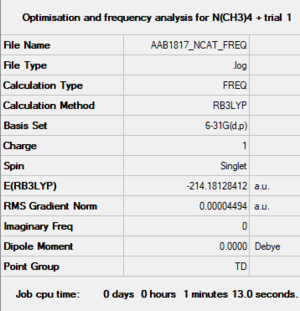
        Item               Value     Threshold  Converged?
Maximum Force            0.000068     0.000450     YES
RMS     Force            0.000027     0.000300     YES
Maximum Displacement     0.000155     0.001800     YES
RMS     Displacement     0.000067     0.001200     YES
Predicted change in Energy=-9.082841D-08
Optimization completed.
   -- Stationary point found.
Low frequencies ---   -0.0009   -0.0009   -0.0006   22.7176   22.7176   22.7176
Low frequencies ---  190.7581  294.0710  294.0710
[P(CH3)4]+ cation
B3LYP/6-31G(d,p)
Optimised P(CH3)4+ cation |
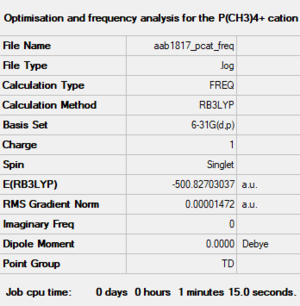
        Item               Value     Threshold  Converged?
Maximum Force            0.000030     0.000450     YES
RMS     Force            0.000012     0.000300     YES
Maximum Displacement     0.000110     0.001800     YES
RMS     Displacement     0.000046     0.001200     YES
Predicted change in Energy=-1.836189D-08
Optimization completed.
   -- Stationary point found.
Low frequencies ---   -0.0022   -0.0016    0.0011   25.3087   25.3087   25.3087
Low frequencies ---  161.2549  195.7495  195.7495
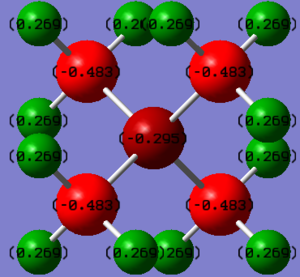
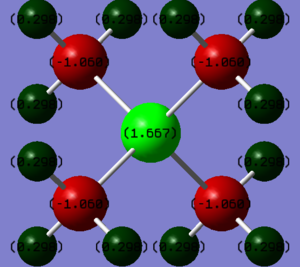
Comparing the charge distribution of the two cations
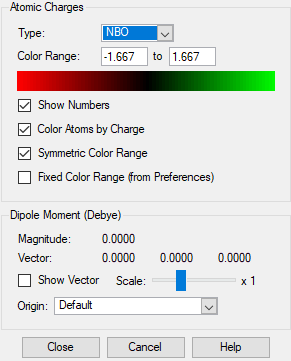
| Atoms | Charge |
|---|---|
| P | 1.667 |
| C | -1.060 |
| H | 0.298 |
| Atoms | Charge |
|---|---|
| N | -0.295 |
| C | -0.483 |
| H | 0.269 |
From these two tables, it can be concluded that although the cations show some similarities with their structures -both have three methyl groups attached to themselves, and the central atoms are both in group 15-, charge distribution is different. For the phosphorous cation, the positive charge is mainly located on the central atom, with some contribution by the hydrogen atoms on the methyl groups. However, for the nitrogen atom, the positive charge is exclusively spread out across the hydrogen atoms on the methyl groups.
Ng611 (talk) 14:59, 27 May 2019 (BST) Can you explain the differences in charge distribution?
Discussing the validity of this traditional description
The traditional description of the N(CH3)4 cation locates the positive charge on the nitrogen atom.
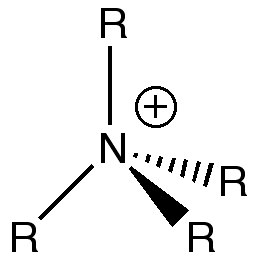
As seen in the computational analysis, the real model suggests that the nitrogen atom does not carry a positive but a small negative charge.
In the traditional description, the positive charge on the nitrogen is there to represent the fact that it is using its lone pair to create a fourth bond.
The calculations carried out show that the positive charge is instead actually distributed amongst all the hydrogen atoms on the methyl groups.
Ng611 (talk) 15:01, 27 May 2019 (BST) Your explanation is fairly good, but some more detail in your answer would be useful. Do you think the idea of 'lone pairs' is useful in explaining real MOs?
MOs and LCAOs diagrams.
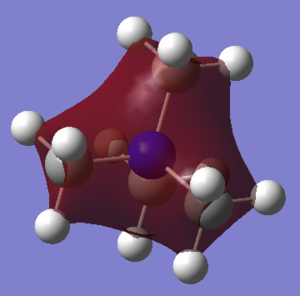
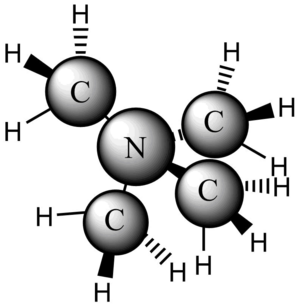
Identify the fragment orbitals of the methyl groups and use this information to simplify your representation of the overall MO as shown below:
Ng611 (talk) 15:05, 27 May 2019 (BST) From this diagram, it doesn't look like you've used FOs for this LCAO analysis. In actuality, there is a significant amount of bonding from the methyl hydrogens.
This molecular orbital exhibits strong bonding character (no nodes). All contributing orbitals are in the same phase, indicating that it is possible that the main contributing AOs are s orbitals. Thus, the LCAOs for this MO is composed of the 2s orbitals of nitrogen and carbon.
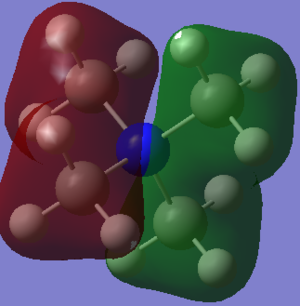
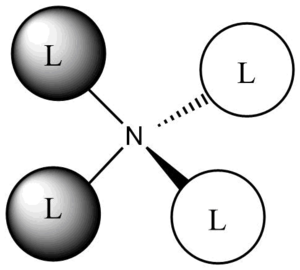
This molecular orbital exhibits rather non-bonding character: there is a node (change of phase) located on the nitrogen atom. This node separates the molecule into two equal parts. The two parts of the molecular orbital are of opposite phases, but of equal size: they both have the same constitution: they are the result of contributions from the s orbitals of carbon and hydrogen on the methyl groups, being in the same phase. Each phase of this molecular orbital has two methyl groups contributing to it.
Ng611 (talk) 15:08, 27 May 2019 (BST) What about placing a p-orbital on the nitrogen atom?
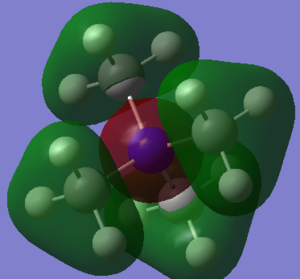
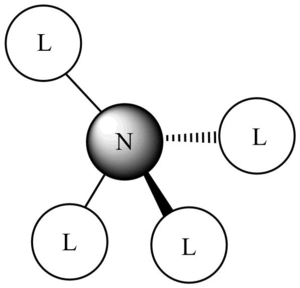
This molecular orbital shows stronger anti-bonding character out of the three MOs: indeed, we can see four nodes on the C-N bonds, which indicates how much the overall structure and stability of the compound would be affected if this orbital were filled. There different contributions to this molecular orbital: one phase (here labelled in red) from the nitrogen atom, the other phase (labelled in green) on the methyl groups. On the methyl groups, only phase is present, suggesting a composition of same phase s orbitals on the C and H atoms, that is the 2s orbital on the C atom, and 1s orbitals on the H atoms. The contribution from nitrogen is from its 2s orbital.
In each of the LCAOs, a simplification has been introduced for the methyl groups.

Ng611 (talk) 15:05, 27 May 2019 (BST) This is a good attempt at the MO analysis. Ideally, some more complicated and challenging MOs (perhaps using p-type FOs), as well as some identification of the key orbital interactions would be useful.
- ↑ http://www.huntresearchgroup.org.uk/teaching/teaching_comp_lab_year2a/Tut_MO_diagram_BH3.pdf
- ↑ https://chem.libretexts.org/Bookshelves/Physical_and_Theoretical_Chemistry_Textbook_Maps/Supplemental_Modules_(Physical_and_Theoretical_Chemistry)/Chemical_Bonding/Fundamentals_of_Chemical_Bonding/Chemical_Bonds/Bond_Lengths_and_Energies
- ↑ http://www.huntresearchgroup.org.uk/teaching/teaching_comp_lab_year2a/12c_ionic_liquids.html
- ↑ http://www.huntresearchgroup.org.uk/teaching/teaching_comp_lab_year2a/12c_ionic_liquids.html
