CAS115
Exercise 1
Question A
Q: What value does the total gradient of the potential energy surface have at a minimum and at a transition structure? Briefly explain how minima and transition structures can be distinguished using the curvature of the potential energy surface.
A: Gradient is equal to 0 due to the transition state being at a saddle point; the maximum of the lowest energy pathway. Calculating the gradient, when equal to 0 can show a maxima or minima,if the double derivative is positive this indicates a minima and if negative this shows a maxima.
Question B
Q:Report your best estimate of the transition state position (rTS) and explain your reasoning illustrating it with a “Inter-nuclear Distances vs Time” screenshot for a relevant trajectory.
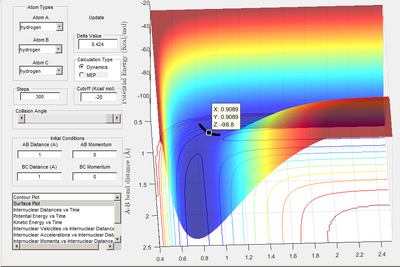
A: Transition state located at saddle point. It was determined to be -98.8 kcal/mol when A-B and B-C bond distances were both equal to 0.908 A. A plot of internuclear distances vs time (when initial r1 and r2 distances were both equal to 0.908) shows no oscillation in bond lengths or change in bond lengths as the distances are representative of the bond lengths at transition state when potential energy is at a maximum (so no further movement when momentum is 0)

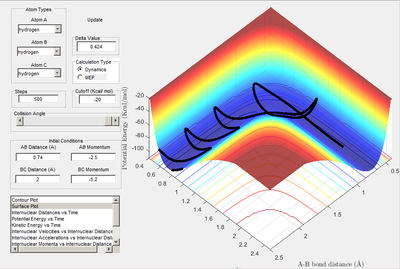
Transition state determined by observing the reaction trajectory of a contour plot when momenta is equal to 0 and intial r1 and r2 are set to 1. The assumed minima of this trajectory is observed and gives an approximate transition state bond length and energy. This is shown in the figure below.
Using this result trial and error was used to monitor bond length oscillation with time to find the transition state bond length to 3 s.f.
Image below shows that with time potential energy tends to a minima as reaction trajectory as reaction trajectory sits on the TS.
Question C
Q:Comment on how the mep and the trajectory you just calculated differ
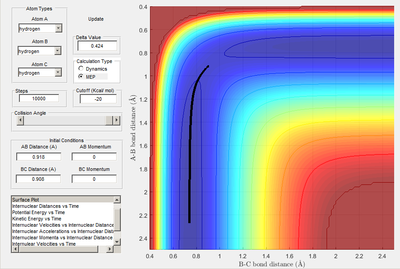
A: conditions: r1=0.908+0.01=0.918 r2=rts=0.908
Both the MEP and molecular dynamics plots follow the minima of the valley. The main difference between the 2 is the oscillation featured on the dynamics plot. This is due to MEP neglecting vibrational energy of molecules and instead only finding the minimal energy whilst disregarding the vibrational; it does this by basing calculations on the length as well as the depth of the curvature, of the reaction pathway. Molecular dynamics plot demonstrates the changing vibrational energies as r1 and r2 distances change. To summarise MEP always illustrates the lowest energy point; disregarding vibrations. Using molecular dynamic calculation plots a similar graph to the MEP but takes into account the vibrational energies.
Question D
Q=Complete the table by adding a column reporting if the trajectory is reactive or unreactive. For each set of initial conditions, provide a screenshot of the trajectory and a small description for what happens along the trajectory.
A= r1 = 0.74 and r2 = 2.0
| reaction number | P1 | P2 | Reaction?! |
|---|---|---|---|
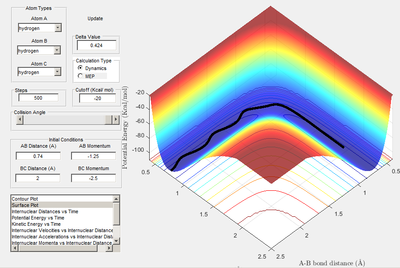
| 1 | -1.25 | -2.5 | yes |
| 2 | -1.5 | -2.0 | no |
| 3 | -1.5 | -2.5 | yes |
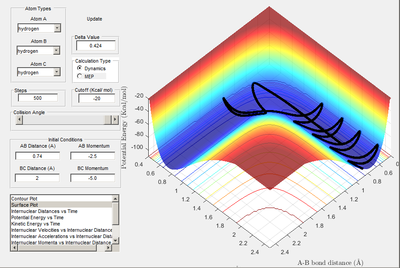
| 4 | -2.5 | -5.0 | no |
| 5 | -2.5 | -5.2 | yes |
Path 1: Reactive. Reaction trajectory shown to pass through transition state towards product formation. Momentum is therefore sufficient to break the activation barrier.
Path 2: Unreactive. r2 progressively decreases as A approaches bonded B but instead of reaction trajectory passing through the transition states the r2 length reaches a minima of sorts at around 1.1 A and begins to increase as A "bounces" away from bonded B.
Path 3: Reactive. Similar to reaction A. As P1 is greater for reaction number 3 all components of the reaction have greater vibrational energy. Tis is demonstrated by the graph.
Path 4: Unreactive. Example of barrier recrossing. System crosses over transition rate but converts back into reactants. Energy was therefore not sufficient to trigger reaction
Path 5: Reactive. Another example of barrier recrossing but after the recrossing the reaction proceeds.
Question E
Q: State what are the main assumptions of Transition State Theory. Given the results you have obtained, how will Transition State Theory predictions for reaction rate values compare with experimental values?
A: Transition state theory. The rate in which an activated complex forms products is dependent on the rate in which it passes through the transition state located on the saddle point as transition state theory predicts reaction trajectories only take the lowest energy path way. This rate is dependent on thermodynamic properties; entropys, Gibb's energy and activation energy. In reality the reaction trajectory may not pass through the saddle point but instead form a transition state of greater potential energy that may or may not lead to product formation. As a result of reaction trajectories passing through these higher energy transition states experimentally will have higher activation energies than those predicted by the transition state theory. [1].
"The second assumption is that any system passing through the transition state does so only once (before the next collision or before it is stabilized or thermalized as a reactant or product)"[1]. In reality reaction trajectory can pass through a transition state multiple time before being stabilised. This is clearly demonstrated in prior images. This multiple crossing can lead to transition states forming original reactants. This means despite Ea being successfully reached products may not form where as TS theory presumes products will form. due to this the rate predicted in TS theor is greater than that determined experimentally.
TS theory does not take into account quantum processes that can help trigger reaction so rates determined using this theory are lower than chemically observed. Quantum mechanical processes include tunneling that provide an alternative pathway for the reaction to occur when there may not be enough momentum for a reaction to proceed. This phenomenon can occur as a result of the particle wave duality, atoms can "tunnel". So a quantum mechanical reaction pathway does not need to pass through the high energy saddle point shown on the potential energy plots. Alternative reaction pathways are taken[2].
Exercise 2
Question A
Q: Classify the F + H2 and H + HF reactions according to their energetics (endothermic or exothermic). How does this relate to the bond strength of the chemical species involved?
A:
F + H2 -> FH + H
Image shows products at a lower potential energy than the reactants so therefore exothermic reaction
FH + H -> F + H2
Image shows products at a higher potential energy than the reactants so therefore endothermic reaction
Experimentally found values:
| Molecule | Bond enthalpy/(kj/mol) |
|---|---|
| H-H | 435 |
| H-F | 569 |
Calculated values from experimental bond enthalpies:
F + H2 -> FH + H =-134 kj/mol EXOTHERMIC
FH + H -> F + H2 = 134 kj/mol ENDOTHERMIC
As H-F formation is exothermic the bond strength of H-F is greater than that off H-H [3].
Question B
Q:Locate the approximate position of the transition state?
A:
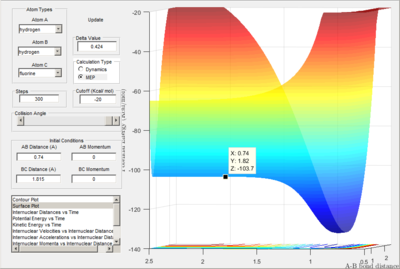
Location of determined transition state (positions shown to 2 dp)
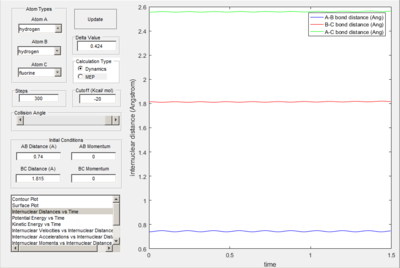
Proof of transition state due to lack of oscillation.
Transition state determined in a similar manor as question 1 B with trial and error however as the product isn't equivalent to reactant, reaction trajectory strayed away from Transiton state bond lengths.
H-H-F : 0.74 A and 1.815 A, 4 d.p
The transition state for the reaction: F + H2 → H + HF is located nearer to the reactants. This is in accordance with Hammond's postulate as the reaction is exothermic.
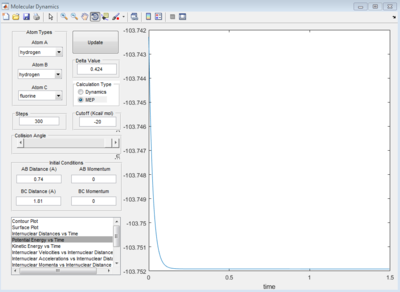
Image below shows that with time potential energy tends to a minima as reaction trajectory as reaction trajectory sits on the TS.
Question C
By calculating the energy difference between reactants and the transition state, activation energy can be found.
For H-F formation (H-H deformation):
Energy of reactants shown as -103.9 kcal/mol. Transition state -103.7 kcal/mol:
0.2 kcal/mol
For H-H formation (H-F deformation):
Energy of reactants shown as -133.9 kcal/mol. Transition state -103.7 kcal/mol:
30.20 kcal/mol
Question D
Q:
In light of the fact that energy is conserved, discuss the mechanism of release of the reaction energy. How could this be confirmed experimentally?
A:
Reactants have a mixture of Kinetic and potential energy. When 2 molecules collide to form a successful reaction the kinetic and vibrational enrgy is converted into potential energy that reaches a maxima at the transition state. The products then begin to form, converting much of this potential energy into kinetic and transitional energy.
From the surface plot we know the reactants for the reaction H-H+F -> H-F+H have more potential energy when compared to the products. Due to the conservation of energy we know that the products must therefore have greater kinetic and vibrational energy
Can be determined by using IR spectroscopy as products with less potential energy will have greater vibrational energy; observable through IR spectroscopy.
Calorimetry can also be used successfully as an increase in both translational a kinetic energy within a system provides the system with heat that causes a rise in temperature.
Image below shows the transition from High potential energy and low vibrational to low potential energy and high vibrational. A-B starting molecule (H-H)
Question E
Q:
Discuss how the distribution of energy between different modes (translation and vibration) affect the efficiency of the reaction, and how this is influenced by the position of the transition state.
A:
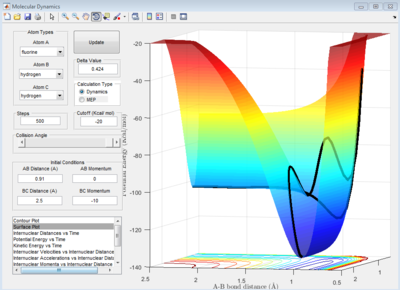
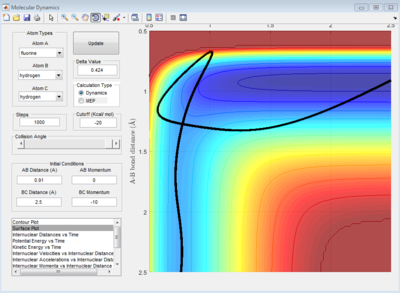
Endothermic: Transition states nearer the products. According to Polanyi's rules increasing the vibrational energy will have a greater influence on transition state formation compared to a relative increase in translational energy for an endothermic reaction. This may be due to the increase in vibrational energy lowering the bond strength of reactants thus encouraging a smaller difference in energy between that of reactant against the products. The effect of this in action is shown by the reaction between H + HF that could only be carried out when momentum was set high, thus vibrational energy is high. A:F, B:H, C:H, A-B=0.91, B-C=2.5 , MA=0, MC=-10 [4]
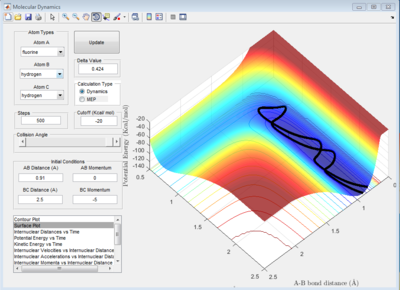
When vibrational energy of the process was lowered no reaction occurred, as demonstrated. A:F, B:H, C:H, A-B=2.5, B-C= 0.74, MA=-1, MC=-0.5
Exothermic: Transition state nearer the reactants. According to Polanyi's rules increasing the translational energy will have a greater influence on transition state formation compared to a relative increase in vibrational energy for an exothermic reaction. By increasing the momentum there is an Increase in the vibrational energy of the H-H bond. This disallowed the reaction to go to completion; this is in agreement with Polanyi's rules. By increasing momentum both the translational and vibrational energy increase. the vibrational favours (reverse) reaction was favoured and the reaction did not go to completion.
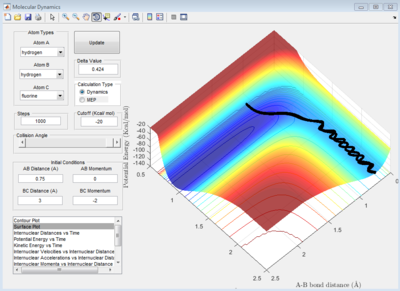
low vibrational energy showing reaction completion: A:H, B:H, C:F, A-B=0.74, B-C= 3, MA=0, MC=-1
When momentum was doubled and thus vibrational energy was higher in relation to translational energy the reaction did not go to completion: A:H, B:H, C:F, A-B=0.74, B-C= 3, MA=0, MC=-2
A higher translational energy of reactants can favour product formation but if too high products formation may be halted by the reformation of transition state that then goes on to form reactants. So the most efficient reaction proceeds when vibrational energy is low and translational energy is high but not so high it causes reactants to reform.
References
- ↑ 1.0 1.1 1.2 Donald G. Truhlar Department of Chemistry, University of Minnesota, Minneapolis, Minnesota 55455, Bruce C. Garrett Chemical Dynamics Corporation, 1550 W. Henderson Road, Columbus, Ohio 43220
- ↑ 2.0 2.1 Atkins physical chemistry,9th edition, chapter 21
- ↑ 3.0 3.1 Bond Dissociation Energies in Simple Molecules (PDF). NSRDS-NBS 31. Washington, DC: U.S. National Bureau of Standards. LCCN 70602101.
- ↑ 4.0 4.1 Shannon Yan, Yen-Tien Wu, and Kopin Liu, PNAS 2008 105: 12667-12672..

